-
Paper Information
- Previous Paper
- Paper Submission
-
Journal Information
- About This Journal
- Editorial Board
- Current Issue
- Archive
- Author Guidelines
- Contact Us
Resources and Environment
p-ISSN: 2163-2618 e-ISSN: 2163-2634
2012; 2(2): 51-55
doi: 10.5923/j.re.20120202.08
Application of Carbonized Poultry Waste in the Removal of Chemical Oxygen Demand (COD) from Dye Wastewater: Kinetic Study
 Abstract
 Reference
 Full-Text PDF
 Full-Text HTML
S. Idris 1, J. Yisa 1, A. U. Itodo 2, K. A. Popoola 1
1Department of Chemistry, Federal University of Technology P.M.B. 65 Minna Niger state Nigeria
2Department of Chemistry, Kebbi State University of Science and Technology, Aliero Kebbi state Nigeria
Correspondence to: S. Idris , Department of Chemistry, Federal University of Technology P.M.B. 65 Minna Niger state Nigeria.
| Email: |  |
Copyright © 2012 Scientific & Academic Publishing. All Rights Reserved.
The removal of COD from dye wastewater by poultry waste activated carbon using KOH as an activating agent was carried out with two step process. Batch adsorption method was employed at various contact time. The study indicated optimum COD removal of 65.15% at the contact of 120 minutes and 150 minutes respectively. In the kinetic study, pseudo first-order, pseudo second-order, Natarajam and Khalaf first order and elovich model were tested but pseudo second-order showed the best fit for the adsorption process. The result further revealed that poultry waste, an available adsorbent is very effective in COD removal from dye wastewater.
Keywords: Poultry waste, Kinetic study, COD, Dye wastewater, Natarajam and Khalaf first order
Article Outline
1. Introduction
- Pollution, contamination of earth’s environment with materials that interfere with human health, the quality of life or the natural functioning of ecosystem (living organism and their physical surroundings). Although some environmental pollution is a result of natural causes such as volcanic eruptions, most is caused by human activities. Pollution of water by organic and inorganic chemicals is of serious environmental concern. Industrial wastewaters result from spills, leaks and product washing and water resulting from cooling processes. The organic content of wastewater is traditionally measured using parameters such as biochemical oxygen demand (BOD), chemical oxygen demand (COD), total suspended solids (TSS) and total organic carbon (TOC). In recent years, increasing awareness of the environment impact of COD has prompted a demand for the purification of industrial wastewaters prior to discharge into natural waters. This has led to the introduction of more strict legislation to control water pollution, such as the environmental quality (scheduled waste) Regulation (Quek et al., 1998). This effect is likely to be even pronounced for small and medium scale industries where profit is small and expertise on wastewater treatment is unlikely to be available.A number of conventional treatment technologies have been considered for treatment of wastewater contaminated with organic substances. Among them, adsorption process is found to be the most effective method. Adsorption as a wastewater treatment process has aroused considerable interest during recent years. Commercial activated carbon is regarded as the most effective material for controlling the organic waste. However, due to its high cost and about 10- 15% loss during regeneration, poultry droppings, groundnut shell, peat, lignite, bagasse pith, wood saw dust etc. have attracted the attention of several investigations and adsorption characteristics have been widely investigated for the removal of refractory materials (Badmus et al., 2007; Mall et al.,1994). This study is aimed at analyzing the adsorption capacity of activated carbon prepared from animal waste on wastewater using a dyeing effluent as a case study and to carry out batch adsorption tests to establish adsorption capacity of the activated carbon prepared from animal waste for the removal of COD from wastewater. The objectives of the study are to investigate the adsorption kinetic using pseudo first-order, pseudo second-order, Natarajan and Khalaf first order and Elovich model and to test the adsorption mechanism using intraparticle diffusion model.
2. Materials and Methods
2.1. Sample Collection and Preparation
- The poultry waste was collected from Kura farms Chanchaga, Minna. The dye waste water was obtained from local dye industry, Jafaru Mairiga Street, F-Layout Minna, Niger State, Nigeria in the month of August, 2010 and stored at room temperature without further purification. The poultry waste was dried then ground and sieved with a 2 mm mesh size sieve. The less than 2 mm sample were stored in airtight container. Ash content was determined using the method described by AOAC (1990).
2.2. Preparation of Activated Carbon
- Activation (Two step process): Activation, involving two steps activation scheme was adopted. Firstly, 5 g of blended raw sample was weighed into six different clean and pre-weighed crucibles. They were introduced into a muffle furnace at 600℃ for 5 minutes after which they were poured from the crucible into a bath of ice water. The excess water was drained off then carbonized sample was washed, using 0.1 M HCl to remove surface ash, followed by hot water wash and further washing with distilled water to remove residual acid. The sample was then sun dried, and further dried in the oven at 100℃ for one hour. This process was repeated until a substantial amount of carbonized sample was obtained.Thereafter, 5g of already carbonized sample was mixed with 5cm3 of activating agent (1M KOH). The sample was allowed to stand for 2 hours, after which it was introduced into a furnace and heated at 8000C for 5 minutes. The activated sample was cooled with ice-cold water, excess water was drained off and the sample dried at room temperature. The above procedure was repeated for different residual time (10 min and 15 min) until substantial amount of activated carbon was obtained. Washing of the activated sample was done with 0.1M HCl to remove surface ash, followed by hot water wash and rinsing with distilled water to remove residual acid. Washing was continue until the pH of sample solution fall within 6-7, then the sample was dried in oven at 110℃ overnight and stored in air tight container (Rahman et al., 2005; Fan et al., 2005; Ahmedna et al., 2000a).
2.3. Characteristics of Activated Carbon
 | (1) |
 | (2) |
 | (3) |
2.4. Batch Adsorption
- 2g of activated carbon was interacted with 40cm3 of industrial dye waste water in a beaker and covered. This was allowed to stand for 30 minutes. It was then filtered using whatman filter paper (No. 42) and the filtrate collected. The process was repeated at pre-set time (60,90,120 and 150 minutes). Each mixture was separately filtered and the filterate collected. This was continued until 200cm3 of each filtrate obtained. This was used for the determination of chemical oxygen demand (COD). (Hameed et al., 2007).
2.5. Determination of COD
- 50cm3 of the filtrate was measured into 250cm3 conical flask. 10cm3 of 0.00833M K2Cr2O7 solution was added. 1g HgSO4, 80 cm3 of mercury sulphate acid solution and a few beads was also added. The mixture was heated under reflux for 10 minutes. It was allowed to cool, the condenser was rinsed with 50cm3 water and the flask cool under running tap. Two drops of ferroin indicator solution was added and titrated with 0.025M ferrous ammonium sulphate solution till the color changes from blue-green to red-brown. The titer value was recorded for the sample. The COD for the blank was determined using distilled water and the difference between the sample titer value and the blank titer value give the measured COD of the dye waste water (Udo and Ogunwale, 1986).
 | (4) |
2.6. Determination of the Adsorption Capacity
 | (5) |
2.7. Adsorption Kinetics
- In order to describe the adsorption kinetics of COD on the adsorbent, pseudo first-order (Lagergren, 1898), pseudo second- order (Ho et al., 2000), Natarajan and Khalaf first order (Raji et al., 1986) and Elovich model (Chien and Clayton, 1980; Sparks 1986) were applied to the experimental data.Pseudo first- order equation:
 | (6) |
 | (7) |
 | (8) |
 | (9) |
2.8. Test of Kinetics Model
- The applicability of pseudo first- order and pseudo second- order kinetic models are verified through the sum of error squares (SSE, %) given by:
 | (10) |
 | (11) |
3. Results and Discussion
3.1. Characteristic of the Adsorbent
3.2. Effect of Contact Time
- The highest percentage COD removal by adsorbent (PW/KOH/5) was obtained at higher contact time of 120 and 150 minutes, that is, 65.15% adsorbed. This is as a result of availability of more active site by the adsorbent which give it better adsorption capacity for the adsorbate to be removed at higher contact time respectively. The result revealed better COD adsorption for the first 60 minutes by the adsorbent (PW/KOH/10), which show increase from 51.52% to 54.55% adsorbed. Thereafter, a decrease in the adsorbent efficiency was recorded which may be due to the complete clogging of available adsorption sites on the adsorbent. Therefore, the adsorption showed the optimum equilibrium time at 60 minutes. The findings also indicated that the activated carbon (PW/KOH/15) showed the highest percentage COD removed at the contact of 90 minutes and 120 minutes, which is 25.7% adsorbed. Desorption that occur after may be due to unavailable free active site on the adsorbent and the equilibrium contact by this adsorbent is between 90 minutes – 120 minutes respectively (Fig.1). Similar observation was recorded by Shama et al., (2010) and Sucharita and Nandini (2009).
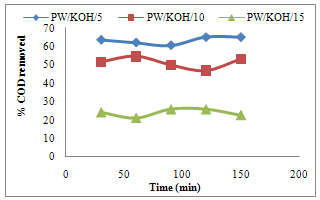 | Figure 1. Effect of contact time on COD adsorbed by Poultry waste activated carbon |
3.3. Adsorption Kinetic
- The results for kinetic parameters are shown in Table 2-5. Pseudo first –order, pseudo second-order, Natarajan and Khalaf first order and Elovich model equations were applied to the adsorption data. Sample with correlation coefficient (R2) values close or equal to 1 is accepted for a given model and relatively high R2 value indicates that the model successfully describes the adsorption kinetics. R2 values for pseudo second-order is high compared to R2 values of other tested kinetic model (Table 2 – Table 5) with values greater than 0.973 (Fig.2). Sample with values of qe(exp) close to qe(cal) is accepted for a given model. The values of qe(exp) is close to qe(cal) for pseudo second-order compared to pseudo first-order kinetic model. Furthermore, the result confirmed that COD adsorption is best described by pseudo second-order compared to other kinetic models tested. A number of authors have reported pseudo second-order kinetic for adsorption of methylene blue on palygorskite (Al-Futaisi et al., 2007) and dehydrated wheat bran carbon (Ozer and Dursun, 2007).
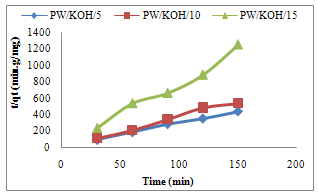 | Figure 2. Pseudo second-order kinetic for COD adsorption on Poultry waste activated carbon |
|
|
|
|
3.4. Test of Kinetic Models
- The applicability of pseudo first –order and pseudo second-order were tested using percentage sum of error squares (% SSE). The higher the value of R2 and the lower the values of % SSE, the better will be the goodness of the fit. Also sample with least % SSE is accepted for a given model. The % SSE values for pseudo second-order is lower compared to that of pseudo first -order (Table 2 and 3).These finding further revealed that pseudo second-order best describe COD adsorption onto the adsorbent. Namasivayam and Kavitha (2002) reported similar process for adsorption of congo red dye on activated carbon from coir pith.Mechanism of adsorption was study using intraparticle diffusion model. Intraparticle diffusion parameters is shown in table 6. If the value of C is zero, then the rate of adsorption is controlled by intraparticle diffusion for the entire adsorption period (Hameed, 2009). As seen from table 6, C value are a little above zero indicating more than one process that affected the adsorption Ofomaja (2007) reported similar phenomenon.
|
4. Conclusions
- The results of the findings revealed that poultry waste can be employed as a low cost adsorbent for COD uptake from dye wastewater using KOH as an activating agent. COD adsorption was carried out in batches at different contact time. Equilibrium contact time varies from 90 minutes for PW/KOH/15 to 150 minutes for PW/KOH/5 adsorbents respectively. Four Kinetic models, pseudo first- order, pseudo second-order, Natarajan and Khalaf and Elovich model were tested to investigate the adsorption process. The pseudo second-order kinetic model best describe the adsorption process. Furthermore, poultry waste can also be used to remove other pollutant from similar wastewater.
Appendix
- PW/KOH/5, PW/KOH/10 and PW/KOH/15 are poultry waste activated with KOH as an activating agent at the residual time of 5, 10 and 15 minutes.Residual time is the time the activated carbon spend in the furnace at 800oC to increase the porosity and better adsorption site for the activated carbon.
ACKNOWLEDGEMENTS
- The author acknowledge the Laboratory Technologists, Department of Chemistry, Federal University of Technology, Minna Niger Sate, Nigeria, for their support during the research period
References
| [1] | Ahmedna, M., Marshall., W.E., and Rao, M., 2000, Granular activated carbons from agricultural by- products: Preparation, Properties and application in came sugar refining. Bulletin of Lousana State University Agricultural Centre, 54. |
| [2] | Ahmedna, M., W., Mursihall, W.E. and Rao, M., 2000a, Production of granular activated carbon from selected agricultural by-products. Bioresource Technology, 71 (2),113 – 123. |
| [3] | Al-Futaisi, A., Jamrah, A., and A1- Hanai, R., 2007, Aspect of Cationic dye molecule adsorption to palygorskite. Desalination, 214, 327-342. |
| [4] | AOAC., Official method of analysis, Washington DC. Association of Official Analytical Chemist, 14th edition:140-147, 1990. |
| [5] | Apipreeya, K.I., Phussadee, P., and Prasert, P.,2006, Removal of metal ion from synthetic waste water by activated carbon from Eucalyptus Camaldulensis Denn Bark. The 2nd Joint International Conference on“Sustainable Energy and Environment (SEE 2006)”. E – 041: 1-9. |
| [6] | Badmus, M.A.O., Audu, T.O.K., and Anyanta, B.U., 2007, Removal of COD from industrial waste water by activated carbon prepared from periwinkle shells. Korean Journal of Chemical Engineering, 24, 246-252. |
| [7] | Chien, S.H. and Clayton, W. R., 1980, Application of Elovich equation to the kinetics of phosphate release and sorption on soils. Soil Sci. Soc. Am. J., 44, 265- 268. |
| [8] | Fan, M., Daugard, W. D., and Brown, C., 2005, Steam activation of chars produced from oat hulls. Bioresource Technology, 93 (1), 103 - 107 |
| [9] | Crank, G., The Mathematics of diffusion, Clarendon, Press, London,1933. |
| [10] | Hameed, B.H., 2009, Evaluation of Papaya seed as a novel non-conventional low Cost adsorbent for removal of methylene blue. Journal of Hazardous Materials, 162, 939-944 |
| [11] | Hameed, B.H., Din, A.T.M., and Ahmed, A.L., 2007, Adsorption of Methylene blue onto bamboo- based activated carbon: kinetics and equilibrium studies. Journal of Hazardous Material, 141, 819-825. |
| [12] | Ho, Y.S., Mckay, G., Wase, D.A.J., and Foster,C.F., 2000, Study of the sorption of divalent metal ions into Peat. Adsorp. Sci. Technol.,18, 639-650. |
| [13] | Ioannidou, O. and Zabaniotou, A., 2006, Agricultural precursor for activated carbon Production. Renewable and Sustainable Energy Reviews, 11 (1), 1966-2005. |
| [14] | Lagergren, S.,1898, About the theory of so-called adsorption of soluble substances. K. Sven Vetenskapsakad Handl, 24 (4),1-39. |
| [15] | Mall, I.D., Mishra, N., and Mishra, I.M., 1994, Removal of organic matters from sugar milk effluent using bagasse fly ash activated carbon. Res.Ind., 39, 115-119. |
| [16] | Namasivayam, C. and Kavitha, D., 2002, Removal of congo red from water by adsorptiononto activated carbon prepared from coir pith, an agricultural solid waste. Dyes Pigments,54,47-58. |
| [17] | Ofomaja, A.E., 2007, Kinetics and mechanism of methylene blue sorption onto palm kernel Fibre. Process Biochem., 42, 16-24. |
| [18] | Okiemen,F.E., Ojokoh, F.I., Okiemen, C.D., and Wuana, R.A., 2004, Preparation and evaluation of activated carbon from rice husk and rubber seed shell. Chemical Journal , 191-196. |
| [19] | Omonhenles, S., Ofomaja, A., and Okiemen, F., 2006, Adsorption of methylene blue onto unmodified and modified citric acid saw dust. Journal of Chemical Society of Nigeria, 30 (182), 1671 –164. |
| [20] | Ozor, A. and Dursun, G., 2007, Removal of methylene blue from aqueous solution by dehydrated wheat bran carbon. Journal of Hazardous Material, 146, 262-269. |
| [21] | Quek, S.Y., Wase, D.A.J., and Forster, C.F.,1998, The use of Sago waste for the sorption of lead and copper”. Water SA, 24 (3), 251-256 |
| [22] | Rahman, I.A., Sa’ad, B., Shaidan, S., and Sya Rizal, E.S., 2005, Adsorption characteristics of malachite green on activated carbon derived from rice husk produced by chemical thermal process. Bioresource Technology, 96 (14), 1578 -1583. |
| [23] | Raji, C., Manju, G.N., and Anirudhan, T.S., 1986, Removal of heavy metal ions from water using sawdust –based activated carbon. Indian J. Eng.Mater. Sci., 4 (6), pp. 254-260. |
| [24] | Shama, S.A., Moustafa, M. E., and Gad, M. A., 2010, Removal of heavy metals Fe,3+ Cu2+, Zn2+, Pb2+, Cr3+ and Cd2+ from aqueous solutions by suing eichhorinia crassipes. Portugaliae Electrochemical Acta, 28 (2), 125-133. |
| [25] | Sparks, D.L., Kinetics of reaction in pure and mixed systems in soil physical Chemistry”, CRC Press, Boca Raton,1986. |
| [26] | Sucharita, T., and Nandini, N., 2009, Adsorption efficiency of carbon from treated sugarcane bagasse in removing chromium (vi) from aqueous solutions by optimization of adsorption parameters. Journal of Applied and Natural Science, 1 (2), 155-158. |
| [27] | Udo, E.J., and Ogunwale, J. A., Laboratory manual for the analysis of soil, plant and water samples, 2nd edition, University Press Limited, Ibadan, Nigeria, 132-133,1986. |