Resources and Environment

p-ISSN: 2163-2618    e-ISSN: 2163-2634

2012;  2(2): 20-29

doi: 10.5923/j.re.20120202.04

Groundwater Quality Assessment of Yenagoa and between 2010 and 2011

Gordon T. Amangabara 1, Enyinaya. Ejenma 2

1Dept of Environmental Technology, Federal University of Technology, Owerri; Nigeria

2Federal College of Agriculture, Ishiagu, Ebonyi State, Nigeria

Correspondence to: Gordon T. Amangabara , Dept of Environmental Technology, Federal University of Technology, Owerri; Nigeria.

Email:

Copyright © 2012 Scientific & Academic Publishing. All Rights Reserved.

Abstract

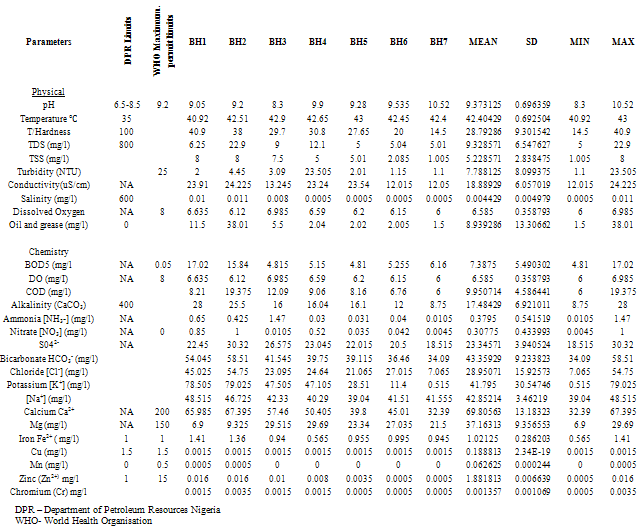
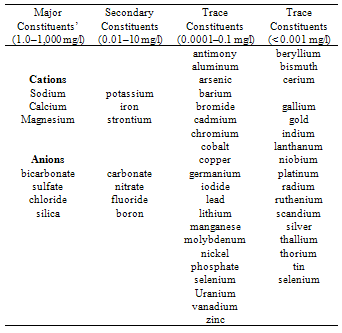
The hydrochemical characteristics of groundwater in Yenagoa and environs was investigated to determine the areal distribution of geochemical parameters and attempt to explain the controlling processes responsible for the various facies. Sixty water samples were collected from wells ( Borehole) at different times in both the dry season ( December to February) and the raining/wet Season ( Between May and October) and were analyzed for various parameters including pH, total dissolved solids (TDS), potassium (K), Sodium (Na), Calcium (Ca), Magnesium (Mg), Chlorine (Cl), Bicarbonate (HCO3) and sulphate ion (SO42-) after standard procedures. The Data obtained from the laboratory analysis were used as variable inputs for the descriptive statistics such as mean, minimum, maximum and standard deviation. Laboratory tests were carried out on representative soil samples in accordance with British Standards (B.S) 1377, which are equivalent to the American Society of Testing Materials (ASTM) standards. The tests were grain size distribution analysis, permeability (using the constant and falling head permeameters) and Atterberg (consistency) limits and was conducted to enable the evaluation of the gradation, hydraulic conductivity (coefficient of permeability/ and consistency (water absorbing and adsorbing ability) properties of the soil samples, as well as their classification. Results showed that water table was generally close to the surface of the area. The first 0 to 5cm depth consist of organic clay, and essentially, the area is mostly characterized by the sandy – clay and silty-clay materials. By implication, the upper clay protective layer for groundwater is thin, coupled with organic materials, biochemical oxygen demand is enhanced. Permeability and transmissivity character of the borehole indicate that if surface water is polluted in one area it can easily get transferred to other part of Yenagoa thus causing serious concern for health implication. The physico-chemical character of the groundwater reflects the hydrochemical facie of the groundwater in the study area. The most prevalent ionic concentration includes iron, calcium, magnesium, Sodium, potassium, chloride, and bicarbonate. The trend of occurrence shows the following relationship: Ca > HCO3 > Na+ > K > Mg > Cl- > SO42. Na+ > K > Cl-. There is elevated occurrence of Ca2+ > HCO3- > Mg2+ ions in the groundwater beyond permissible level reflecting processes of natural rainwater recharge and water – soil/rock interaction

Keywords: groundwater, hydrochemical, borehole, physicochemical, pollution, aquifer

1. Introduction

The challenge of ensuring usable water in sufficient quantities to meet the needs of human and ecosystems emerged as one of the primary issues of the 21st century (Eden and Lawford, 2003). For example, inadequate water supply and poor water quality give rise to health and other societal issues, limit agricultural productivity and economic prosperity, and pose national security risk in some countries (Lawford et al., 2003; Nwidu et al., 2008). Problem of this nature have been increasing in scope, frequency, and severity because the demand for water continue to grow while supply of renewable water remain fixed. While it is agreed that water is one of the most important resources with great implications for African development, the freshwater situation in is unfortunately not encouraging. Presently, it is estimated that more than 300 million people in live in a water-scarce environment. By 2025, eighteen African countries are expected to experience water stress. The amount of freshwater available for each person in is about one-quarter of what it was in 1950. In many countries, requirements for domestic freshwater use, sanitation, industry and agriculture cannot be met (African Water Journal). The situation is getting worse as a consequence of population growth, rapid urbanization, increasing agriculture and industrial activities, and lack of adequate capacity to manage freshwater resources.
Bayelsa (Figure 1.) is a wetland in the Niger Delta with possible serious problems of drinking water. Bayelsa State Government had reported that all the surface water bodies in the State are pollution-laden and hence there is the need to resort to groundwater for consumable water (Bayelsa State Water Board, 2001). Water enters the subsurface through infiltrating precipitation and through percolation from surface water bodies. Once in the groundwater systems, water moves through the subsurface, at varying rates, in response to pressure and elevation differences and permeability of the geologic materials through which it travels. As a prelude to understanding and predicting the impact of future water development plans in the quality of water in the area, it is necessary to investigate and evaluate the hydrochemistry of the groundwater. More so, that the surface of the delta is dissected by a dense network of rivers and creeks, which create a condition of delta-wide hydrological continuity. Water pollution in one part of the delta can readily be felt in other part.
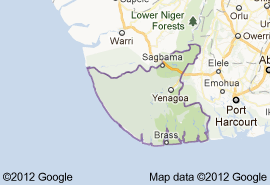
Figure 1. Map of State
Studies conducted by Abam (2001), Oteri (1989, 2003) and Okagbue (2007) have identified salinity or saline water intrusion into groundwater aquifers and elevated levels of nitrates, ammonia and chlorides as major problems in the Niger Delta sub-region. one of the contiguous States with in the Niger Delta for example, has problems of elevated levels of magnesium (Mg), Calcium (Ca), Bicarbonate (HCO3) and hydrogen ion concentration. High sulphate ion (SO42-) reflects the dissolution of sulphides from interstratified peat within the geological formation, high turbidity, increased level of iron around Ogunu, Edjeba, Ughelli, Asaba and Warri areas were also reported (Okolie et al., 2005; Oseji et al., 2005; Olobaniyi and Owoyemi, 2006; Ibe and Agbanu, 2006; Olobaniyi, 2007).
Rivers State another contiguous State with Bayelsa, studies have shown have increased levels in Total Dissolved Solids (TDS) ( up to 2900mg/l), high hydrocarbon content – oil and grease (71mg/l in 2006 compared to 1.8mg/l recorded seventeen years earlier) are reported to be some of the groundwater problems according to Ayotamuno and Kogbara (2007). Amajor (1991) had reported iron and chloride elevation as groundwater issues and this was corroborated by Ophori et al., (2007). Similar problems as reflected in Delta and were also reported by Edet (2004), Amadi et al., (2005) for Akwa Ibom State.
In our study area (Bayelsa State), the works of Ekundayo (2006) on groundwater protective soil in Brass Island and Nwidu et al., (2008) on water quality in Amassoma had reported high transmissivity and leakage factors with a heterogeneous permeability, making groundwater susceptible to pollution in the area. It therefore becomes very imperative to have a better knowledge of the aquifer formation and characteristics (confined or unconfined) and hydrogeochemistry of the groundwater in Yenagoa and its environs being the capital city with a burgeoning population.
The investigation of the hydrogeochemistry of groundwater is predicated on the fact that usefulness of groundwater to human to a large extent depends on its chemistry. Based mainly on this, several bodies have set various standards for water usage (WHO, 1963). The chemistry of groundwater is determined by such hydrologic, climatic and hydrogeologic factors as, the type of aquifer, the mode and source of recharge, the drainage area, and the permeability of the soil cover (Abam, 2001; Amadi et al., 2005; Oseji et al., 2005; Ekundayo, 2006; Olobaniyi and Owoyemi, 2006).

2. Materials and Method

The Study Area
Yenagoa, the study area is the capital of . It lies within latitudes 04°4N and 05°, 02N and longitudes 006°, 15E and 006°, 24E and situated in the southern part of the Niger Delta of Nigeria (Figure 1). It is underlain by a sequence of sedimentary formations with a thickness of about 8000 metres and include from bottom to top, Akata Formation, Agbada Formation, Benin Formation. The Benin Formation is Oligocene to Pleistocene in age. It consists predominantly of freshwater continental friable sands and gravel that are of excellent aquifer properties, with occasional intercalation of shales. This formation contains the most productive and hence most tapped aquifer in the delta region especially in areas of Yenagoa where it is shallow. It consists of fine to medium and coarse-grained unconsolidated sands that are often feldspathic (with 30-40 wt % feldspars) and occasionally gravelly. The formation generally does not exceed 120 metres in thickness and it is predominantly unconfined.
The hydraulic conductivities of the sand vary from 3.82 x 10⁻³ to 9.0 x 10⁻² cm/sec, which indicates a potentially productive aquifer. Specific capacities recorded from different areas within this formation vary from 6700 lit/hr/m to 13,500 lit/ hr/m (Offodile, 1991). The water table is very close to the ground surface and varies from 0 to 4 metres. This limited groundwater level fluctuation reflects the high amounts of precipitation often recorded in Yenagoa over the greater part of the year. Recharge is from precipitation and the numerous rivers in the delta. Fresh water occurs in shallow unconfined aquifers, in sands of the coastal beach ridges and river point bars, as well as in sandy islands within the mangrove belt. It also occurs in confined aquifers at varying depths.
Table 1. Locations of Boreholes
Sample BoreholeLocation
1Ede-Epie Roundabout
2Yenezuegene
3Opolo
4Otuoke (Ogbia)
5Opposite FGGC, Imiringi
6Near Kolo Creek Gas Turbine
7The precinct, Tombia

3. Methodology

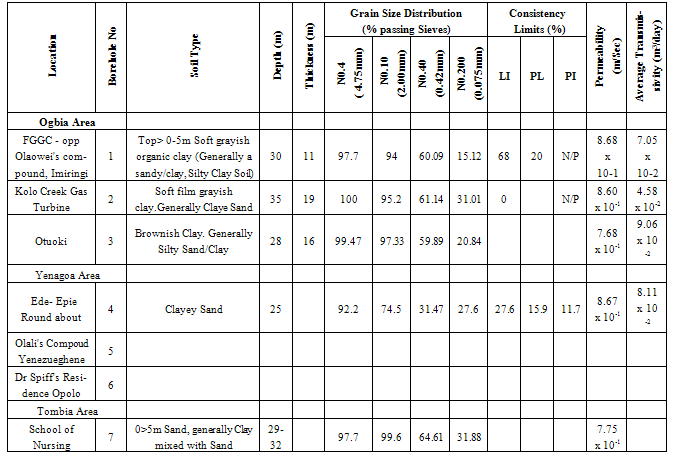
Water samples from seven different sources were collected during a twelve-month period, Table 1 shows the locations.
Water Samples were collected from already sunk private bore holes in two seasons. The dry season measurements were taken on the 15th of every month between November - December 2010 and January to March 2011 and Raining Season measurements taken on the 15th of every month between June and October 2010) The borehole characteristics i.e. depth, soil property, yield etc where available was also collected from the owners of the boreholes sampled.
The samples for physicochemical investigation
Screw capped sterile bottles were used to collect water samples from the boreholes, which have hand pumps or tap outlets. The hand pumps were operated continuously for five (5) minutes before samples were taken aseptically for analysis as done by Cheesebrough, (1991) and Ogbonna et al., (2007). The collected sample was then labeled at the point of collection, preserved and stored prior to taking them to the laboratory. Bottles were already rinsed with water to be sampled before sample collection. Sufficient air space was left to create space for water expansion. This mode of data collection is called Ruthner sampling method. One advantage of this method is that it provides immediate knowledge of the water temperature at the same time of collection. Some fast changing physicochemical parameters e.g. Dissolved Oxygen, were determined in situ with the aid of portable coleman pH meter, salinity, temperature, Total Dissolved Solids (TDS) and conductivity were also determined in situ with the aid of conductivity/TDS meter (Jackson, 1962, APHA, 1985)
Laboratory Techniques
Total Hardness of the water was obtained by titrimetric methods. 25ml of sample was diluted with distilled water after which, 2 drops of buffer solution (pH 10), sodium cyanide (250g) and indicator powder (200g) were added. The solution was then titrated with 0.01m to a blue end point. The hardness was obtained as mg CaCO3 per litre. Alkalinity was obtained by titrating 50ml of sample with HCl (0.1m) while turbidity was estimated by nephelometric method using La Motte 2020 portable turbidity meter. The Data obtained from the laboratory analysis were used as variable inputs for the descriptive statistics such as mean, minimum, maximum and standard deviation.

4. Results and Discussion

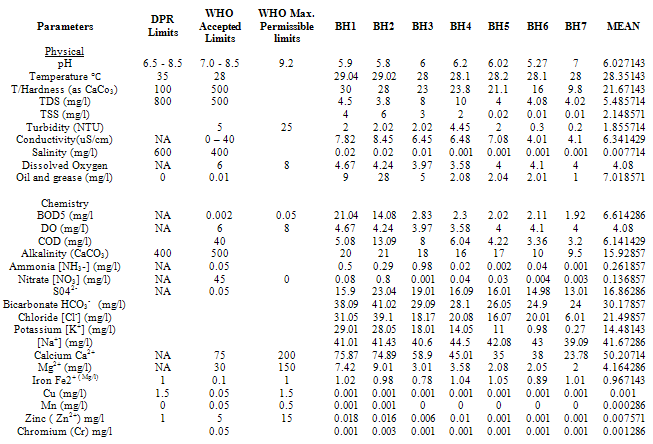
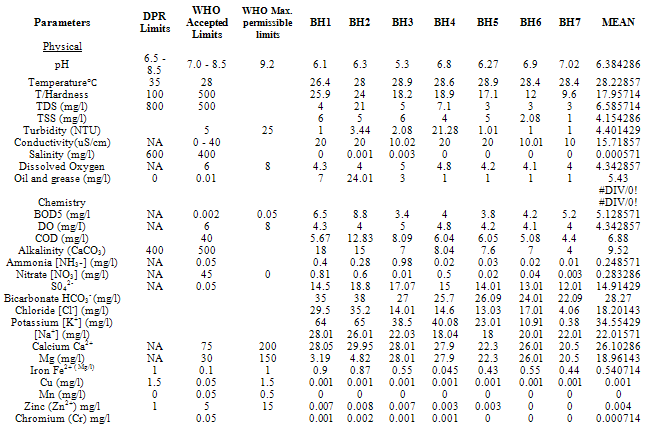
Results obtain from both field work and laboratory analyses are presented as Table 2 – 5.
Table 2. Characteristic of Some of the Sampled Boreholes
     
Table 3. Dry Season Measurement ( 2010- Nov/Dec; 2011 - Jan, Feb, Mar)
     
Table 4. Wet Season Measurement (2011 - May – October)
     
Table 5. Summary of dry and wet season measurement for 2010/2011
     
Hydrogeology Characteristics
From Table 1, the lithologic profiles of the soils from Borehole 1, 2, 3, 4, and 7 are predominantly soft grayish brown organic clay from 0 – 5m depth. This soil is fine-grained and highly plastic. Below this is dark grey soft film of clay and silty sands which are medium grained, loosely dense silty sand and in some section sandy clay soils. In general the area is more of sandy clay and sandy silt soil. Grain size analysis results shows that Borehole 1 and 2 are poorly sorted with fines (silt/clay fractions). The coarse grained sands possess greater infiltration capacity since the number of particles per unit area is large and void spaces are greater.
The permeability test result according to Ekundayo (2006) reveal a low value of 2.17 x 10⁻³cm/sec for the silty clay soil, while the sandy soils display a high range of 7.33 x 10⁻¹ to 8.67 x 10⁻¹cm/sec. Infiltration capacity of the soil depends on the permeability, degree of saturation, vegetation and amount/duration of rainfall. The implication from this is that Boreholes with sandy soil have confining layers that are unequally effective and more surface based pollutants could find their way into the aquifer through the area surrounding these boreholes.
The average transmissivity of the confining layers ranges between 4.58 x 10⁻² and 9.06 x 10⁻² this result is suggestive of highly transmissible aquifer indicating the possibility of leakage. Furthermore, the permeability and transmissivity character of the borehole indicate that if surface water is polluted it can easily get transferred to other part of the State capital thus causing serious concern for health implication.
Physicochemical Analyses
The physicochemical properties of groundwater in Yenagoa and environs analyses showed the pH value of 6.02 for the dry season and 6.38 for the wet season (Table 3– 4). These values are within the standard permissible limits of 6.5 – 8.5 (USEPA, 1990).
It can be deduced that there are slight traces of dissolved acidic salts. This may be linked with the characteristics of the Niger Delta region since movement of such salts from the surface of the soil to ground water might have occurred during seepage as ground water pollution can occur through seepage of pollutants and by migration of contaminants from the surface of the soil. This could be aided by the high infiltration and permeability of the soils (sandy loam soils) which implies that any contaminant on the surface has the potential to leach or move fast into the subsurface, which could lead to ground water contamination (Scawb et al 1990). This fact, coupled with the observation that the water table is shallow could have caused the trend described above. However, as ground water recharge occurred during the wet season due to continuous rainfall and deep percolation, increased dilution occurred thus yielding acceptable pH values (6.02) during the wet season.
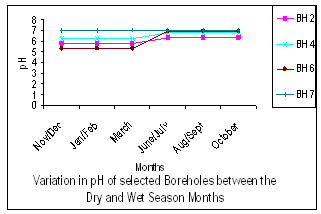
Figure 2. Variation of pH between Dry and Wet seasons
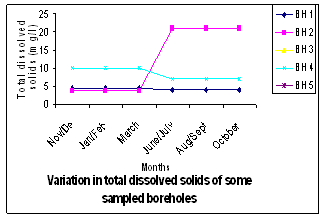
Figure 3. Variation in TDS in Boreholes Sampled
The values for Total Dissolved Solids (TDS) and Total Suspended Solids (TSS) are 9.32mg/l and 5.22mg/l. These are within the permissible limit set for drinking water. Boreholes 1 and 2 have slightly higher concentration compared to other boreholes this could be as a result of the presence of the Flow Station and gas turbine in the area. Total Dissolved solids (TDS) are fingerprints of industrial activity which is to a great extent absent in Yenagoa and environs.
Conductivity and Salinity almost go together as well as TDS. The mean values for Conductivity is 18.88µS/cm with standard deviation of 6.057 while salinity value is 0.004429 with standard deviation of 0.004979. This is in consonance with the TDS value recorded. A higher TDS means that there are more cations and anions in the water. With more ions in the water, the water become saline and increases the electrical conductivity. The likely reason for the low salinity in the study area can be attributed to the effective recharge from both precipitation and surface/river drainages. Although all naturally occurring water has some amount of salt in it (Ayotamuno and Kogbara, 2007), the values around Kolo Creek and Imiringi area can be linked to salts discharged from the industrial operations from the Flow station or the Gas turbine.
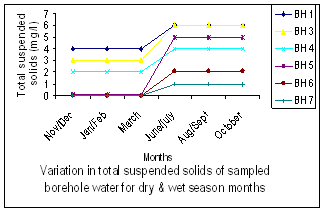
Figure 4. Variation in Total Suspended Solids
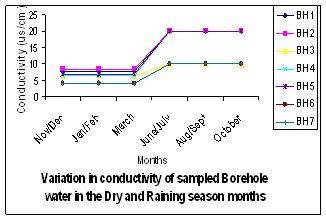
Figure 5. Variations in Conductivity of Sampled Boreholes
The Biochemical Oxygen Demand (BOD) is reported to be a fair measure of cleanliness of any water on the basis that values less than 1-2mg/l are considered clean. 2-3mg/l fairly clean, 5mg/l doubtful and 10mg/l definitely bad and polluted (Moore and Moore, 1976). This shows that the overall quality of groundwater in the study area is doubtful. The BOD values raised some concern, as they were relatively high in some of the groundwater samples especially those around Imiringi and Ede –Epie Communities. The mean value for all boreholes for the period under review is 7.3875mg/l with standard deviation of 5.490. The WHO permissible limit for BOD5 is 0.05mg/l. This occurrence in high BOD value can be connected to the presence of decomposable organic matter. Table 2 showed boreholes with organic clay. In all, the concentration is more in the dry season than in the wet season.
The Dissolved Oxygen (DO) values are within the permissible limits of 6-8mg/l. the mean value is 6.585 with standard deviation of 0.35879
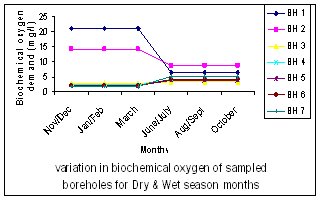
Figure 6. Variation in Biochemical Oxygen Content
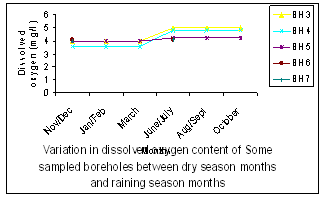
Figure 7. Variation of Dissolved Oxygen Content
The Chemical Oxygen Demand (COD) is an indication of organic matter susceptible to oxidation by chemical oxidant. Large value of COD shows that the water body will be in an oxidative stress. The mean value of COD in our study area is 9.95 with standard deviation of 458. The minimum value is 6mg/l and the maximum is 19.37 and this occurs at the area within the Kolo Creek Gas turbine and Shell Flow Station. The type of organic activity that could warrant this concentration was not immediately identified.
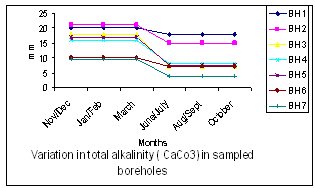
Figure 8. Variation in Total Alkalinity (CaCo3) in Boreholes Sampled
Alkalinity (as CaCO3) is not a pollutant. It is a total measure of the substances in water that have acid neutralizing ability. It protects or buffers against pH changes i.e. keep the pH fairly constant and makes water less vulnerable to acid rain. The mean value for Alkalinity is 17.84. The implication from this value is that there are geologic formations which may have carbonate, bicarbonate and hydroxide compounds.
The inorganic chemical constituents obtained in this study are in normal range permissible by WHO. The constituents have been grouped into three categories. Major constituents with permissible concentration range of 1.0 – 100mg/l and which are cations include - sodium, calcium and magnesium while anions include bicarbonate, sulfate, chloride and silica. The Secondary category with permissible concentration range of 0.01 – 10mg/l and which are cations include – Potassium (K) and Iron (Fe). The third category is trace elements and they have allowable limits of concentration in the range of 0.001 – 0.1mg/l). The cations in this group include – Chromium (Cr), copper (Cu), lead (Pb), Manganese (mn) and Zinc (zn).
Table 6. Primary (major), secondary, and trace constituents in natural ground water
     
From Table 5, we were able to establish that, for the major constituent category, Ammonia [NH3-] (mg/l) recorded a mean value of 0.3795mg/l. Min 0.015, Max 1.47 with standard deviation of 0.541. The permissible limit is 0.05mg/l. Nitrate [NO3] (mg/l) recorded a mean value of 0.307mg/l. Min 0.004mg/l and Max is 1mg/l. The standard deviation is 0.433 these values are within the acceptable limits for drinking water. Normally, nitrate pollution is associated with septic systems and agricultural activity.
SO42- however has elevated concentration of 23.34mg/l with standard deviation of 3.940, this is a bit high. The outcome of this elevated concentration maybe due to the fact that the Deltaic plain is a sequence of sands and silt with local intercalation of peat and sulphur-rich clays. The dissolution of sulphides such as pyrite from the interstratified material by percolating water produces SO4 ions in water. SO4 occurrence could also be related to increasing heavy traffic flow and petroleum activities between Ede-Epie and Tombia on the one side and Ede-Epie and Kolo Creek/ Imiringi on the other side. Gaseous emissions from vehicles contain significant amount of sulphur rich gases. The gas flares in the area are also major contributor of sulphur-rich gases into the atmosphere. The relative calm atmosphere coupled with constant rainfall and high temperature in the area ensures that much of the emitted substances are not carried far from the vicinities before they are scavenged out of the atmosphere as acid rain (Oghenejobor, 2005; Olobaniyi and Owoyemi, 2006) and recharges the aquifer. Recent studies on a nearby Niger Delta Community have shown that SO4 contribution to free acidity could be high as 76% (Ogunkoya and Efi, 2003).
The mean value for Chloride is 28.95mg/l. The concentration was more in the wet season. The boreholes that have higher values are those in the Ogbia axis i.e. FGGC and Gas Turbine, Kolo Creek/Imiringi, closely followed by those in Yenagoa axis – Ede-Epie, Opolo etc.
Bicarbonate also records high concentration. A mean measurement of 43.35mg/l with min and max value of 34.09 and 58.51 respectively was reported. The presence of bicarbonate speaks of the nature of rock type in the area.
Other inorganic ionic concentrations from our water samples that were analysed include Potassium 41.795mg/l; Sodium (Na+) 42.85mg/l and Calcium 69.80mg/l with standard deviation of 67.39. Calcium salt and calcium ions are among the most commonly occurring inorganic chemical in nature. Though the human body requires approximately 0.7 – 2.0g of calcium per day as food element, excessive amounts can lead to the formation of kidney or gallbladder stones. Calcium toxicity is rare, but over consumption may lead to deposit of calcium phosphate in soft tissue of the body. Calcium intoxication causes depression. The release of calcium into water system is closely related to what releases iron into the groundwater of our study area.
Other secondary constituent of groundwater found in our analyses are magnesium and iron. Mg has a mean concentration of 37.163mg/l and Iron Fe2+ 1.021mg/l. Min and Max values are 0.565 and 1.41 with standard deviation of 0.286 (Table 6, Fig 9). These two elements are in excess of the acceptable limits for drinking water. Iron exposure at high levels has been shown to result in vomiting, diarrhea, abdominal pain, seizures, Shock, low blood glucose, liver damage, convulsions, coma and possibly death after 12 – 48 hours of ingesting toxic level of iron (Nwidu et al., 2008). Death may also occur if children ingest sufficient iron to exceed the body’s iron-binding capacity; the metal-binding proteins that make ionic iron available (Conrad, 2004).
The nature and presence of iron in groundwater in the area indicates that the iron problem in the area is not migratory but of origin. It may be attributed to industrialization and improper waste management. Like nitrate pollution, iron are associated with natural water recharge and water-soil/rock interaction. Surface water charge with atmospheric and biogenic CO2 infiltrates into the subsurface and aggressively attack aluminosilicates including feldspar and micas present in the Formation liberating cations such as iron, calcium, and magnesium into the water and leaving residues of clay minerals. A consequence of this incongruent dissolution is a rise in pH and in HCO3 (Freeze and Chary, 1979). The concentration (mean) of Zinc (zn) is 1.88mg/l and the regulatory standard is 0.05 with maximum tolerance limit set at 0.5mg/l by WHO. The rest of Copper (Cu) Manganese (Mn) and Chromium (Cr) were more or less not detected.
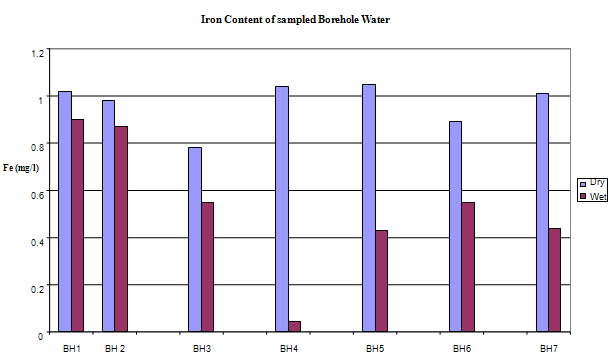
Figure 9. Iron Concentration in sampled Boreholes
The hydrocarbon levels obtained indicate that the baseline levels have been greatly upset. In 1987, the ground water sampled in nearby Port Harcourt had hydrocarbon levels of about 1.8 mg/l (Horsfall and Spiff, 2001) but the levels obtained in the present study range from 2.52 to 5.52 mg/l in the dry season for Total Petroleum Hydrocarbon (TPH) and 24.43 - 71.37 mg/l for oil and grease in the dry season (Appendices I and II).
The above results indicate that ground water contamination by industrial activities takes a short period of time especially in areas with soils having moderate to high porosity, infiltration and permeability as was typical of soils within the study area. Furthermore, during the dry season the risk of contaminant accumulation is higher and poses a threat to the survival of the inhabitants of the area who depend on these water sources for their survival, but the risk is less during the wet season, as deep percolation of the high rainfall amounts received induces groundwater recharge and subsequent dilution of contaminant.

5. Summary and Conclusions

The most prevalent ionic concentration includes iron, calcium, magnesium, Sodium, potassium, chloride, and bicarbonate. The trend of occurrence shows the following relationship:
The main naturally occurring iron minerals are magnetite, hematite, goethite and siderite. The Niger Delta region experiences long duration and intensive rainfall couple with high temperature; these weather phenomena accelerate weathering of the geologic formation in the area. The weathering processes release the iron element into waters, under oxygen-poor conditions; it mainly occurs as binary iron. But under acidic and neutral, oxygen-rich conditions it becomes part of many organic and inorganic chelation complexes that are generally water soluble and the dissolved iron is mainly in the form of Fe(OH)2+ (aq).
Usually there is a difference between water soluble Fe2+ compounds and water insoluble Fe3+ compounds. The latter are only water soluble in strongly acidic solutions, but water solubility increases when these are reduced to Fe2+ under certain conditions. Iron does not clearly alter in pure water or in dry air, but when both water and oxygen are present (moist air), iron corrodes. Its silvery colour changes to a reddish-brown, because hydrated oxides are formed. Dissolved electrolytes accelerate the reaction mechanism, which is as follows:
4Fe + 3O2 + 6H2O -> 4Fe3+ + 12OH- -> 4Fe(OH)3 or 4FeO(OH) + 4H2O
Usually the oxide layer does not protect iron from further corrosion, but is removed so more metal oxides can be formed. Electrolytes are mostly iron (II) sulphate, which forms during corrosion by atmospheric SO2. In sea regions atmospheric salt particles may play an important role in this process. Iron (II) hydroxide often precipitates in natural waters giving the characteristic brown colour to the water when the mg/l is highly elevated. The manganese level from the water sample is 0.062625mg/l the WHO accepted limit is 0.05. The slight increase in elevation above the recommended mg/l could be associated with the elevated iron level.
The implication of the finding is that groundwater quality improves away from industrial settings, traffic activities. This inference is instructive for water resource developers in Yenagoa and environs. The recent drive towards industrialization and the attendant urbanization means a greater demand for groundwater in the area. New groundwater abstraction schemes are recommended.
Future success in understanding the dynamic nature of groundwater systems will rely on continued and expanded data collection at various scales, improved methods for quantifying heterogeneity in subsurface hydraulic properties, enhanced modelling tools and understanding of model uncertainty, and greater understanding of the role of climate and interactions with surface water.

References

[1]  Abam, T.K.S (2001) Regional Hydrological Research perspective in the Niger Delta J. Hydrological Sciences. 46(1) African Water Journal
[2]  Amadi, P.A., Ofoegbu, C and Morrison T (1989) Hydrogeochemical Assessment of Groundwater in parts of the . Environ. Geol. Water Sci. Vol.14 No.3 pp 195 – 202
[3]  Amajor, L. C (1991) Aquifers in the formation (Miocene—recent), Eastern Niger Delta, : Lithostratigraphy, hydraulics, and water quality. Environmental Geology and Water Sciences, Springer. Vol. 17, Issue 2, pp.85-101
[4]  American Public Health Association (1985). Standard methods for the examination of water and waste water. APHA, .
[5]  Ayotamuno, M. J. and Kogbara, R. B. (2007). Response of Environmental characteristics to industrialization: A case study of the Onne oil and Gas . J. of Food, agriculture and Environment Vol. 5 (1) 288 – 289
[6]  Government of (2009) Sustainable Development Strategy March, 2009. Retrieved from http://www.bayelsa.gov.ng
[7]  Cheeseborough, M (1991) Medical Laboratory manual for Tropical Countries. Microbiology. Tropical Health Technology/Butterworth Heinemann, University Press, , Vol. II, pp 206 – 220
[8]  Conrad, M. E (2004) Toxicity of Iron retrieved from http://www.emedicine.com/Med/topic.htm Eden S and Lawford, R. G (2003) Using Science to address a growing Worldwide water Dilemma for the 21st Century. In Lawford et al (eds) Water: Science, Policy and Management. Water Resources Monograph 16. American Geophysical Union 10.1029/106WM03
[9]  Edet, A. E (1992) Groundwater quality assessment in parts of Eastern . Journal of Environmental geology, Vol.22 No.1 pp. 41-46
[10]  Ekundayo, E.O (2006) Geoenvironmental properties of Ground water protective Soil Layers in Brass, Nigeria. Interl. Jour of Environment and Waste Management. Vol.1 No.1. pp 75-84
[11]  Freeze, R.A. and Cherry, J.A (1979). Groundwater. Prentice-Hall, inc, New jersey. 604pp Horsfall, M. O. and Spiff, A. I (2001). Principles of EnvironmentalPollution (with Physical, Chemical & Biological Emphasis). 1st revised edn, Metroprints Ltd., , 218 p.
[12]  Ibe, K.M and Agbamu, P.U. (2006) Impacts of Human Activities on Groundwater Quality of an Alluvial Aquifer: A Case Study of the , , SW, . of Technology, Owerri. , M.L (1962) Soil Chemical analysis. Prentice Hall, Cliff NJ 498p
[13]  Lawford, R. G., Landwehr, J. M., Sorooshian, S and Whitaker, M.P.L (2003) International Hydrologic Science Programs and Global Water Issues. Water: Science, Policy and Management. Water Resources Monograph 16. American Geophysical Union 10.1029/016WM14 , W. J., and Moore, E. A (1976). Environmental Chemistry, Academics Press, Inc.London, pp. 360-368.
[14]  Nwidu, L.L., Oveh, B., Okoriye, T and Vaikosen, N.A (2008) Assessment of the water quality and prevalence of water borne diseases in , . African Journal of Biotechnology Vol. 7 (17), pp. 2993-2997
[15]  Offodile, M .E (1991) An approach to groundwater study and development in . Mecon Services Ltd., . 245p
[16]  Ogbonna, D.N., Benibo, N.A and Wachukwu, C.K (2007) Bacteriological and Physico-chemical quality of borehole water from Borikiri area of , . Current Trend in Biochemical Research 9 (1) pp 63 -68
[17]  Oghenejoboh, K.M (2005). The impact of acid rain deposition resulting from Natural gas flaring on the socio-economic life of the people of ’s Niger Delta. Journal of Industrial Pollution and Control 21 (1) pp 83- 90
[18]  Ogunkoya, O.O. and Efi, E.J (2003). Rainfall quality and sources of rainwater acidity in Warri area of the . Jour. Min. Geol. 39(2), pp 125- 130.
[19]  Okagbue, C. O. (1989) Geotechnical and Environmental Problems of the Delta. Bulletin of Engineering Geology and the Environment Vol.40, No.1 Springer Berlin pp119 – 126
[20]  Okolie, E. C., Osemeikhian, J. E and Asokhia, M. B (2005) Estimate of Groundwater in parts of Delta Area of Nigeria using geoelctric method Journal of Applied Sciences and Environmental Management, (1): pp 31-37
[21]  Olobaniyi, S.B and Owoyemi, F.B (2006). Characterization by Factor analysis of the chemical facie of Groundwater in the Deltaic Plain Sands aquifer of Warri, Western Niger Delta, . African Journal of Science and Technology( AJST) Science and Engineering Series Vol.7 No.1 pp73 -81.
[22]  Olobaniyi, S. B., Ogban, F.E., Ejechi, B.O and. Ugbe. F.C (2007) Quality of groundwater in . Journal of Environmental Hydrology, Vol. 15, Paper 6.
[23]  Ophori, D.U., Gorring, M., Olsen, K., Orhua, E and Hope, J (2007) A Preliminary Analysis of groundwater chemistry in shallow boreholes, . Journal of Environmental Hydrology, Vol. 15, Paper 13
[24]  Oseji, J. O; Atakpo, E. A and Okolie, E. C (2005) Geoelectric investigation of the aquifer characteristics and groundwater potential in Kwale, Delta State, . J. Appl .Sci. Environ. Mgt Vol.9 (1) 157 -160Oteri, A.U (1984) Electric Logs for Groundwater Exploration in the Niger Delta. Challenges in African Hydrology and Water Resources (Proceedings of the Harare Symposium, July, 1984) IAHS Publc No.144.
[25]  Oteri, A.U and Atolagbe, F.P (2003) saltwater intrusion into Coastal Aquifers in . The Second International Conference on Saltwater intrusion and Coastal Aquifers- Monitoring, Modeling and Management. . March 30th – April 2, 2003.
[26]  Schwab, G. O., Fangmeier, D. D., Elliot, W. J. and Frevert, R. K (1993).Soil and Water Conservation Engineering. 4th edn, John Wiley and Sons Inc., , 50 p
[27]  World Health Organization (1963). Guidelines for Drinking Water Standards. WHO,