-
Paper Information
- Previous Paper
- Paper Submission
-
Journal Information
- About This Journal
- Editorial Board
- Current Issue
- Archive
- Author Guidelines
- Contact Us
Resources and Environment
p-ISSN: 2163-2618 e-ISSN: 2163-2634
2012; 2(1): 67-79
doi:10.5923/j.re.20120201.09
Impacts of Gold Mill Tailings Dumps on Agriculture Lands and its Ecological Restoration at Kolar Gold Fields, India
 Abstract
 Reference
 Full-Text PDF
 Full-text HTML
Surendra Roy, Piyush Gupta, T. A Renaldy
National Institute of Rock Mechanics, Kolar Gold Fields, 563117, Karnataka, India
Correspondence to: Surendra Roy, National Institute of Rock Mechanics, Kolar Gold Fields, 563117, Karnataka, India.
| Email: |  |
Copyright © 2012 Scientific & Academic Publishing. All Rights Reserved.
Huge amount of mill tailings at Kolar Gold Fields are creating environmental problems. In this study, an attempt was made to assess the impacts of mill tailings on agriculture lands and to identify suitable species for its reclamation. For this, soils collected from different agriculture lands were mixed with tailings in different proportions and tomato (Lycopersicon esculentum) was planted in soils and mixtures. For selection of suitable species, native species were planted only in tailings. Physico-chemical properties varied in soils, tailings and mixtures. pH and electrical conductivity of soils increased with an increase of tailings content. Nitrogen, phosphorous, potassium, magnesium in soil-tailings showed symptoms of deficiency in tomato plants except calcium and sulphur. Correlation among iron, manganese, zinc and copper indicated common source of their occurrence. These elements decreased with increase of pH and sand percentage, and increased with the increase of clay content. Iron, manganese, copper in tomato fruits were within the limit whereas zinc was observed toxic beyond 30% of mill tailings. Soil/tomato plant transfer coefficients distinguished the concentrations of micronutrients in tomato fruits and soil-tailings mixture. Growth status of native species revealed that Babool, Gulmohar, Neem and Eucalyptus are suitable for dump reclamation.
Keywords: Soils, Mill Tailings, Tomato, Native Species, Micronutrients, Nutrient Deficiency, Kolar Gold Fields (KGF)
Cite this paper: Surendra Roy, Piyush Gupta, T. A Renaldy, Impacts of Gold Mill Tailings Dumps on Agriculture Lands and its Ecological Restoration at Kolar Gold Fields, India, Resources and Environment, Vol. 2 No. 1, 2012, pp. 67-79. doi: 10.5923/j.re.20120201.09.
Article Outline
1. Introduction
- At Kolar Gold Fields (KGF), Karnataka, about 40 million tonnes of mill tailings were generated during beneficiation of gold ore[1], which have covered about 2-sq. km. of the area[2]. Though plantations on the dumps are almost nil but some grasses have come on the dump surface. Particulate matter concentration beyond the permissible limit at KGF has indicated influence of tailings on air environment[3]. Formation of gullies on the dumps due to rain may also affect the surrounding. As agriculture lands are available at some distances around the dumps, therefore, it can influence the crop yields.Mill tailings contain minerals like amphiboles, chlorite, calcite, feldspar, mica, pyrite, quartz, etc.[4] and have micronutrients[5]. The nutrients present in mill tailings can be used for the ecological restoration of dumps. According to Williamson and Johnson[6], the favored stabilization method for metallic mine wastes is by the use of vegetation. Native species provide an aesthetically attractive vegetation cover, long-term surface stability and a low maintenance commitm-ent. Moreover it is compatible with reprocessing of the waste if it proves to be economically viable.Usually agriculture lands have potential for the crop yield. To know the influence of mill tailings on agriculture lands, soils and tailings can be mixed together and their properties can be studied. Because physico-chemical properties of dump may react with soils nutrients and influence its concentration. Considering these, gold mill tailings dump of KGF and agriculture lands existing surrounding the dump was selected to examine the effects of mill tailings on agriculture lands and to study about native plant species suitable for the reclamation of dumps.
2. Methodology
2.1. Collection of Samples
- At first, a detailed survey of the mill tailings dumps and agriculture lands available surrounding the dumps were carried out at KGF. Considering that the dumps can influence the agriculture lands existing in all the four directions, therefore, soils from the agriculture lands of different villages namely Krishnavaram (north), Chinakkan nagar (south), Parandapalli (east) and Volgamadi (west) were collected (0-15 cm). Figure 1 shows the locations of mill tailings dumps and surrounding agriculture lands at KGF. Before collection of samples, surface litter was scrapped and vegetation cover was removed. Considering that tree species to be planted for dump reclamation will have deep roots, therefore, dump samples were collected up to a depth of 50 cm. The tools like trowel, spade and auger was used for samples collection. Sampling tubes made up of steel were used for the collection of bulk density samples. There was no considerable difference in the areas to be sampled; each sampling area was treated as a single unit. Samples were collected in zigzag way and composite was prepared by mixing five different samples[7]. The collected samples kept into thick quality polythene bags were labeled, sealed and brought to the laboratory. The samples were dried at room temperature and ground using mortar and pestle and sieved through a 2 mm sieve.
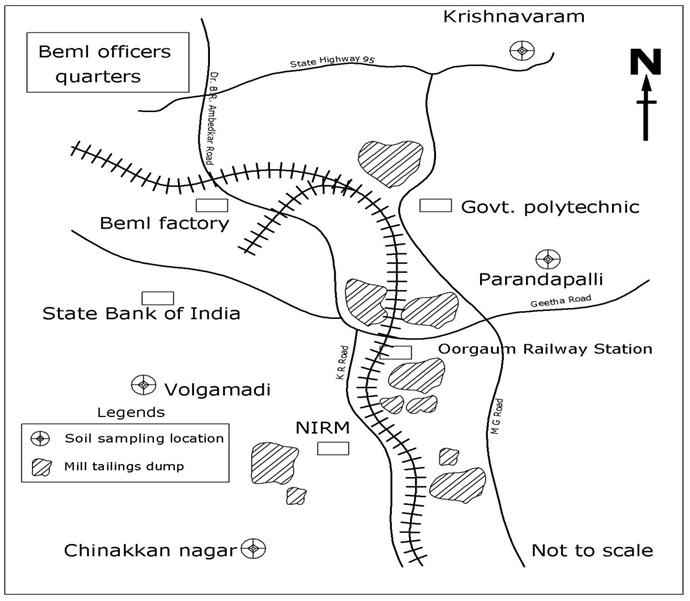 | Figure 1. Mill tailings and soil sampling locations at KGF |
2.2. Selection of Vegetable Species to Assess the Impacts of Mill Tailings on Soils
- Water supply is limited worldwide and there is an increasing necessity to reduce the quantity of water used during the irrigation practices[8]. Tomato has the highest acreage of any vegetable crop in the world[9], and requires deficit irrigation, which can save water during production period[8]. Deficit irrigation is useful not only in reducing production costs for tomato, but also in preserving water consumption and minimizing leaching of nutrients and pesticides into groundwater[10]. According to Reddy et al.[11], Bangalore and Kolar districts of Karnataka state itself produce tomato (Lycopersicon esculentum) about 35% of total tomato production and it is grown at most of the time in a year. Therefore, tomato vegetable was selected for the study. To assess the impacts of mill tailings on soils, soil samples collected from the different agriculture fields were mixed with the mill tailings in proportion of 0% (only soil) 10%, 20%, 30% and 40% and filled in the cement pots. These were called as soil-tailings mixture. Tomato seedlings were planted in different mixture pots. It was also planted in a pot containing only mill tailings. Seedlings were irrigated on alternate day for the period of three months (July-September). At the end of the harvesting period, tomato produced from each pot was tested for the micronutrients. No manures were used during crop period.
2.3. Selection of Plant Species for Dump Reclamation
- For the selection of plant species for mine waste reclamation, the normal practice is to choose drought-resistant, fast growing trees, which can grow in elevated metal content[12]. According to Williamson and Johnson[6], native species are more suitable for metallic mine wastes reclamation. Considering these, thirteen different native species were selected (Table 1) and planted into dumps filled in different cement pots. Dump was filled in such a way that it could show in-situ condition. Since plants may need different nutrients in different quantities, therefore, the growth rate (height and perimeter) of each species was assessed at the end of every month that continued up to three months. Plants were irrigated on alternate day.
2.4. Mill Tailings, Soils and Tomato Parameters Tested
- The physical parameters like moisture content, bulk density, infiltration rate, water holding capacity and texture for mill tailings and soils were determined. Texture and water holding capacity were also determined for the soil-tailings mixture. The chemical parameters like pH, electrical conductivity, organic carbon, cation exchange capacity, and available nutrients like nitrogen, phosphorus, potassium, sodium, calcium, magnesium, sulphur and micronutrients (iron, manganese, zinc and copper) were analyzed for mill tailings, soils and soil-tailings mixture. Micronutrients were also analyzed in tomato fruits.Moisture content and bulk density was determined by gravimetric and weight-volume method respectively. Water holding capacity was assessed using perforated circular soil boxes and infiltration rate by double ring infiltrometer[13]. Texture was determined by pipette method and textural class by Textural Triangular Diagram. pH was analyzed by pH meter and electrical conductivity by conductivity meter in a soil to water ratio of 1:2.5 and 1:2 respectively. Organic carbon was estimated using rapid dichromate oxidation technique[14], nitrogen by alkaline potassium permanganate method[15] and phosphorus by Olsen’s method[16]. Potassium was extracted by neutral 1(N) ammonium acetate solution (soil-to-extractant ratio of 1:10) and determined by flame photometer[14]. Sodium and cation exchange capacity was also analyzed by flame photometer. Calcium and magnesium were determined by EDTA titration and sulphur by turbidimetric method[7]. Iron, manganese, zinc and copper were extracted using diethylene-triamine-pentacetic acid (DTPA) buffered at pH 7.3[17] and analyzed by atomic absorption spectrophotometer (AAS). Micronutrients in tomato fruits were also analysed using AAS after digestion.
3. Results and Discussion
- In discussion, the results of soils and soil-tailings mixture has been indicated only by direction like north, south, east and west in place of their villages.
3.1. Moisture content
- The water in soil is not only important as a solvent and transporting agent but it maintains texture and compactness of soil[18]. Moisture content varied from one location to other (Figure 2), which might be due to change in texture. The lowest value in mill tailings indicates that drought resistance/ native plants, which do not need water for irrigation, would be suitable for dump reclamation.
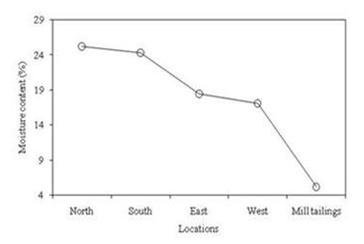 | Figure 2. Variation in moisture content at different locations |
3.2. Bulk density and infiltration rate
- Bulk density is the mass (weight) of a unit volume of dry soil in its natural structure. Bulk density varied from location to location (Figure 3a). It was the highest for mill tailings and the lowest for east. It is clear that the highest value is less than 1.7 g/cm3 as bulk density greater than 1.8 g/cm3 are considered unsuitable for plant growth[7].Infiltration rate is the distance travelled by water through a soil column. Initially, it is high but decreases with time, and tends to approach a steady infiltration rate. The infiltration rate was the highest at the location east and the lowest on the mill tailings dumps. All the values were greater than 2.50 cm/h (Figure 3b) indicates high rate of infiltration[7].Since compaction influences the infiltration rate, therefore, correlation between bulk density and infiltration was derived (Figure 3c). The negative correlation coefficient was statistically significant at 1% of level of significance indicating decrease in infiltration rate with the increase of bulk density.
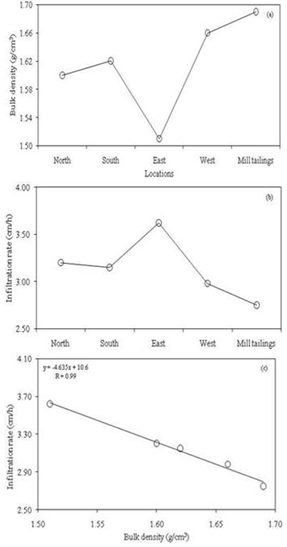 | Figure 3. Variation in (a) bulk density and (b) infiltration rate at different locations, and (c) correlation |
3.3. Water Holding Capacity and Texture
- Water holding capacity of soil refers to maximum amount of water held in the saturated soils and determined largely by the interaction of soil texture. Relative proportion of soil particles of various sizes is called texture of soil. Larger particles help in providing the physical support to the plants, while smaller size determines the capacity of soil to hold water and availability of nutrients[19].Soils with high clay content (above 40%) hold less plant available water than loamy soils. Fine-textured soils work satisfactorily than sandy soils and hold more water and plant nutrients[20]. Water holding capacity increased with the increase of mill tailings percentage (Figure 4). Texture class for the different percentage of clay, silt and sand was determined using textural triangular diagram (Table 2). The texture class of mill tailings was sandy loam (SL). The texture of north soil was sandy clay loam (SCL) but its class became SL at 30% and 40%. The texture remained SCL up to 40% in south soil-tailing mixture due to high clay and low sand content compared to others. The texture of east changed from SCL to SL at 30% and 40%. The texture of west was SL, which did not change at any percentage of soil-tailings mixture. SCL comes under moderately fine textured and SL under coarse textured group[21]. Moderately fine textured of south soil-tailings mixture might be the reasons for higher fluctuations in water holding capacity whereas insignificant increase in others were due to coarse textured groups. Increase in water holding capacity can save water for irrigation.
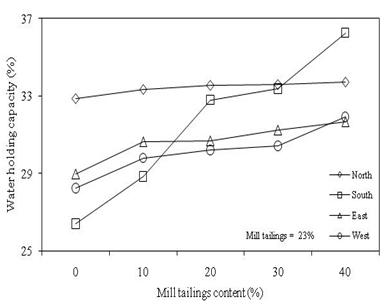 | Figure 4. Variation in water holding capacity in soil-tailings mixture |
| |||||||||||||||||||||||||||||||||||||||
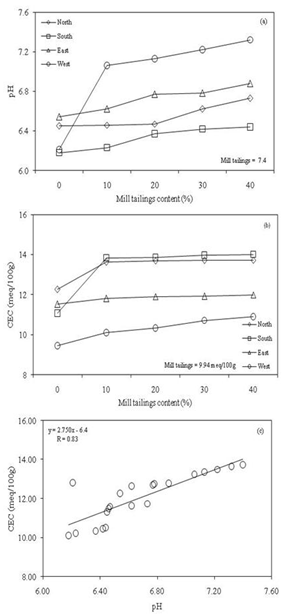
3.4. pH and Cation Exchange Capacity
- Soil reaction is usually expressed as a pH value and it is a function of soil composition. In soils, containing soluble carbonate minerals, the pH increases due to dissolution of carbonate. pH between 7 and 8.5 indicates the solubility of calcium carbonate[22]. The pH of mill tailings was 7.4. Though pH of agriculture lands in each direction was acidic in nature but it increased as the mill tailings percentage increased (Figure 5a) indicating presence of calcite in tailings. For good growth of tomato, soil pH must be 6.5[23] or from 6.5 to 7.5[24]. pH less than 6.5 in south soil-tailings showed poor growth in tomato plants.The cation exchange capacity (CEC) is the total number of milli-equivalents of the exchangeable cations which 100 grams of soil contain[21]. It refers ability of soil to maintain positively charged nutrients and hence a good indicator of soil fertility and nutrient retention capacity[25]. An increase in percentage of mill tailings showed an increase in CEC (Figure 5b). Higher soil’s CEC can retain more cations [20] but insignificant increment reveals poor addition of cations. According to Molley[25], as pH increases, the number of negative charges on the colloids increases hence CEC increases (Figure 5c).
 | Figure 5. Variation in (a) pH and (b) CEC in soil-mill tailings mixture, and (c) correlation |
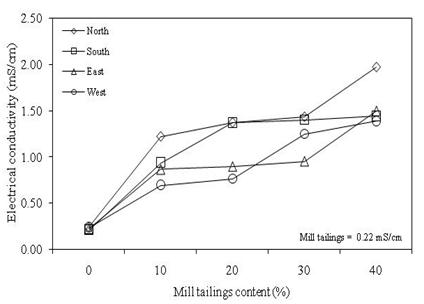
3.5. Electrical Conductivity
- Electrical conductivity (EC) gives an idea of the soluble salts present in the soil. Though there is no significant variation among soils and mill tailings but as the percentage of mill tailings increased, its concentration increased (Figure 6). Dissolution of calcite of mill tailings might be the reasons for increasing the concentration. Conductivity or soil salinity for all the mixture lied between 0.21 mS/cm and 1.97 mS/cm (Figure 6). Tomato is tolerant to salinity up to 2 mS/cm [26] indicating unsuitability for further mixing of mill tailings. The number of tomato decreased with the increase of salinity (Table 3). Cuartero and Muñoz [27] stated that decline in number of fruits explains the yield reduction at high ECs.
| |||||||||||||||||||||||||||||||||||||||||||||||||||||||||||||||||
 | Figure 6. Variation in electrical conductivity in soil-mill tailings mixture |
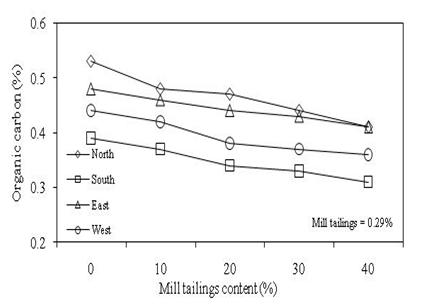
3.6. Organic carbon
- Soil organic matter and related soil properties are the important indicators of soil quality. It has no definite chemical composition, soil organic carbon, the dominant elemental constituent of soil organic matter is more commonly measured and reported in scientific literature[29]. Organic carbon multiplied by a factor of 1.75 gives the organic matter values[30]. Under natural condition, trees, shrubs, grasses and other native plants supply large quantities of organic residues annually by way of their roots and tops, when decomposed by many types of organisms. Earthworms, centipedes, ants, etc. also play an important role in the translocation of plant residue[21]. Daniels and Haering[20] stated that dead root, litter and leaf drop, and the bodies of soil animals such as insects and worms are the primary sources of organic matter in soil. It is the major source of nutrients like nitrogen, phosphorus and potassium[31].Organic carbon was the lowest in mill tailings compared to soils (Figure 7). As the percentage of mill tailings increased, organic carbon decreased indicating variation in humification after mixing. Organic carbon decreases probably due to low humification by the lack of microflora [32]. Some grasses on mill tailings dumps results presence of organic carbon. Different amounts of crop residues can show different value of organic carbon in soils [33]. Organic carbon was found deficient in soils and soil-tailings mixture except in north soil (Table 4).
 | Figure 7. Variation in organic carbon in soil-tailings mixture |
|
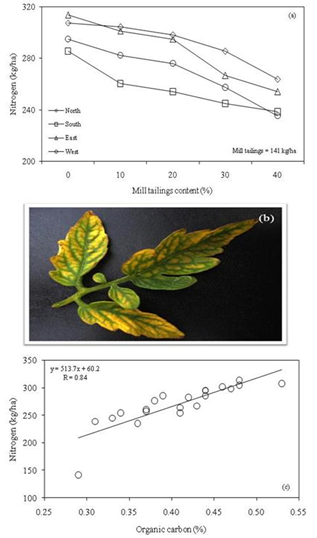
3.7. Nitrogen
- Nitrogen (N) is required in large amount for optimum production of tomato as it removes large quantity of nitrogen from the soil[24]. For the assessment of nutrient deficiency, visual nutrient deficiency symptoms are considered as a very powerful diagnostic tool for evaluating the nutrient status of plants[35]. In nitrogen deficiency, younger leaves remain small and pale green. As deficiency increases older leaves become yellow and die prematurely. It can decrease the production by decrease in number of fruits and its size[24].Though there were decrease in nitrogen with the increase of mill tailings in soils but considerable vegetative growth in tomato plants occurred during crop period (Figure 8a). The numbers and size of the fruits decreased as the proportion of mill tailings increased (Table 3). The lower concentration in south showed low production compared to others. Deficiency (Figure 8b) influenced the production in plants indicating addition of manure can enhance the yields.As organic matter is the major source of nitrogen supply, therefore, correlation was derived between organic carbon and nitrogen (Figure 8c). Correlation coefficient, statistically significant at 1% level of significance, revealed organic carbon is the major source of nitrogen. Similar results were also obtained by Ghose[32] and Maiti and Ghose[12]. Hence addition of organic manure will be beneficial as it can release the nutrients gradually throughout the season and maintain a good physical condition of the soil[21]. The production of tomatoes can be increased using the rate of nitrogen 180 kg/ha as recommended by the University of Agricultural Sciences, Bangalore[36].
 | Figure 8. (a) Variation in nitrogen in soil-tailing mixture (b) nitrogen deficiency and (c) correlation between organic carbon and nitrogen |
3.8. Phosphorus
- Phosphorus (P) helps in root growth and production of large number of blossoms, results increase in tomato production[24]. It decreased with the increase of mill tailings (Figure 9a). The lower concentrations in south could be one of the reasons for the lowest yield (Table 3). The available phosphorus is much lower than the available nitrogen and potassium because most of the phosphorus present in soil is not readily available to plants[32]. Phosphorus was deficient in soils and soil-tailing mixture (Table 4) showing yield reductions[37]. Purple color observed in the leaves of all the tomatoes plants (Figure 9b) indicated phosphorus deficiency[38].According to Donahue et al.[31], organic matter is a good source of phosphorus and as phosphorus is mineralized from organic matter it becomes available for plant growth. Therefore, the correlation was derived between organic carbon and phosphorus. The correlation coefficient was statistically significant at 1% level of significance (Figure 9c) indicating decrease in phosphorus due to decrease in organic carbon. The result agrees with Ghose[32]. According to University of Agricultural Sciences, Bangalore, the recommended rate of phosphorus for tomato is 66 kg/ha[36], which can control the deficiency and increase the yield.
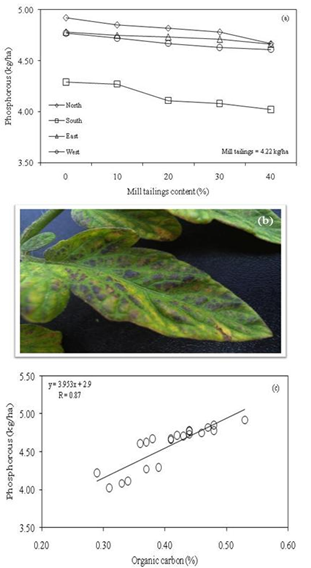 | Figure 9. (a) Variation in phosphorus in soil-tailing mixture (b) phosphorus deficiency and (c) correlation between organic carbon and phosphorus |
3.9. Potassium and sodium
- Potassium (K) is absorbed in larger amounts than any other nutrient except nitrogen[39]. It improves the rigidity of straw and stalks, increases resistance to plant disease and enhances fruit size, flavor, and colour. In case of deficiency, plant growth becomes weaker and leaf symptoms appear[37] in the form of chlorosis along the edges of leaves (leaf margin scorching).Potassium decreased with the increase of mill tailings (Figure 10a), which might be due to decrease in organic carbon[12]. The concentration indicated deficiency in all the plants (Table 4). Though potassium in south soil-tailings is higher than east and west, but tomatoes yields is lower in south (Table 3). The presence of higher sodium (Na) in east and west soil-tailings might have compensated the K (Figure 10b). No significant changes occurred in sodium with the increase of mill tailings. In case of K deficiency, the presence of Na ions can compensate the absence of K ions. Even after substitution of sodium, K deficiencies (leaf margin scorching) were observed in all the plants (Figure 10c) of tomatoes[38]. The recommended rate of potassium for tomato is 99.6 kg/ha as per the University of Agricultural Sciences, Bangalore[36] which can control the deficiency and enhance the production.As organic carbon influences the potassium, therefore, potassium was plotted with organic carbon and correlation was derived (Figure 10d). Correlation coefficient was statistically significant at 1% level of significance indicating that organic carbon is a major source of potassium. Maiti and Ghose [12] also found similar results for potassium.
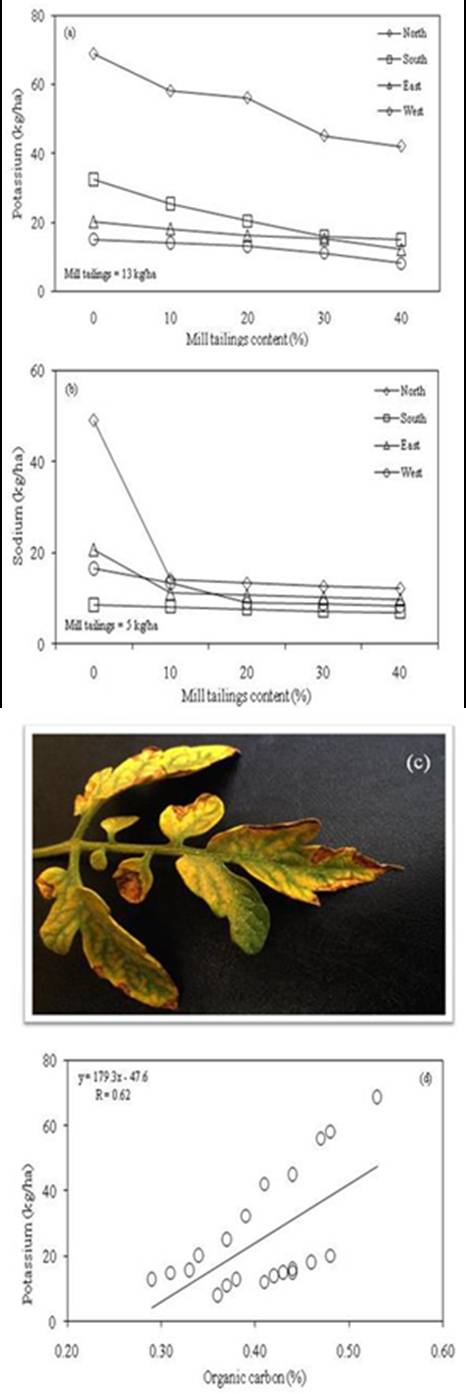 | Figure 10. Variation in (a) potassium and (b) sodium in soil-tailing mixture, (c) potassium deficiency, and (d) correlation between organic carbon and potassium |
3.10. Calcium and magnesium
- Calcium (Ca) and magnesium (Mg) are required in large amounts for good crop growth and have similar chemical properties. Magnesium is the primary component of chlorophyll and actively involved in photosynthesis[39] whereas calcium is essential for root and leaf development, function of cell membranes, formation of cell wall compounds, etc[37]. Calcium deficiency causes a well known disorder called “blossom-end rot” appears in tomato fruit, which occurs when soil pH is <4.5[24] whereas in case of magnesium deficiency, the chlorotic, mottled leaves become brittle and tend to curl upward[37].Calcium increased as the mill tailings percentage increased (Figure 11a) indicating increase in pH, presence of calcite and Ca-feldspar in tailings enhanced the concentrations. Calcium deficiency was not observed in tomato. Increase in pH and chlorite in tailings increased the magnesium concentration in mixture (Figure 11b). Raising the soil pH enhances the magnesium concentration[40]. Though magnesium concentration increased in soil-tailings but upward curling in leaves of tomato plants indicated magnesium deficiency (Figure 11c). As magnesium is held less tightly than calcium by cation exchange sites, hence soils usually contain less Mg[39]. Magnesium deficiency can be reduced by spraying MgSo4 (Epsom salt) at the rate of 2.6 g/L in the foliage several times during tomato growth[24].
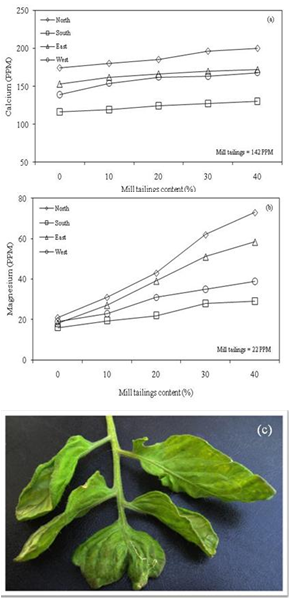 | Figure 11. Variation in (a) calcium and (b) magnesium in soil-tailings mixture, and (c) magnesium deficiency |
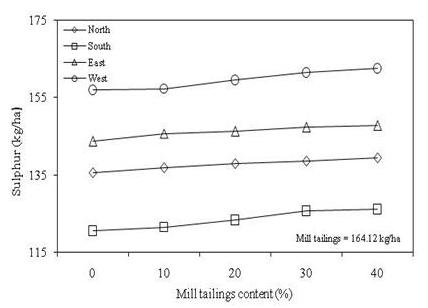
3.11. Sulphur
- Most crop need less sulphur relative to the other macronutrients[39] because it is usually applied in combination with other macronutrients[24]. Slight increase in sulphur concentration was found in soil-tailings mixture (Figure 12) indicating that mill tailings influences soils. The sulphur was the highest in mill tailings compared to soils showing presence of sulphur bearing minerals in tailings. Industrial development and automobiles also contribute sulphur into the atmosphere, which is added into soils through rainfall[22]. Sulphur deficiency is more likely on acid soils[37] i.e. pH might be lower than 6.0[39]. In soil-tailings mixture, an increase in pH might be the reasons for increase in sulphur. An absence of uniform yellowing over the entire plant including younger leaves[35] indicated non deficiency in tomato.
 | Figure 12. Variation in sulphur in soil-tailings mixture |
3.12. Micronutrients
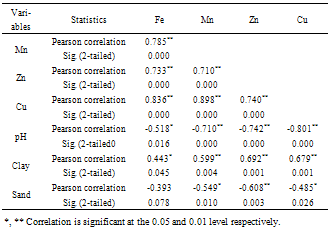
- Weathering of rocks is the principal resource from which soils derive their micronutrients[30]. Four micronutrients like iron (Fe), manganese (Mn), zinc (Zn) and copper (Cu) are essential for plant growth and yield [31]. Analytical results indicated that as the percentage of mill tailings increased concentration of micronutrients decreased (Figure 13). Iron content in mill tailings was the highest compared to soils (Figure 13a) indicating contribution of pyrite in mill tailings. Even at 40%, the concentrations of micronutrients were many times higher than the values given in Table 4. This might be the reasons for non-deficiencies in tomato plants.Different soil properties like pH, clay and sand strongly influence the micronutrients (Fe, Mn, Zn and Cu). Clay content predominantly controls the micronutrient retention and availability [30]. According to Nayek et al [41], pH is known to affect the solubility and plant availability of metals. Therefore, the influence of these properties on micronutrients was assessed. For this, a 21 set of data of Fe, Mn, Zn, Cu, pH, clay, and sand, tested for soils, dump and soil-tailings mixture were used. Correlation between variables was derived using SPSS software version 13.0 for windows (Table 5).All the micronutrients were positively correlated to each other indicating their interdependence and availability from common soil factors[30]. Ma et al.[42] reported significant positive correlation among Fe, Mn, Cu and Zn whereas Chen et al. [43] found among Mn, Cu and Zn. According to Chen et al.[43], high correlation among trace elements suggests similar process control element associations in parent materials.pH varied from 6.18 to 7.40. It was negatively correlated with Fe, Mn, Zn and Cu indicating that as the pH increases available micronutrients decreases. Similar observations with pH were found by Katyal and Sharma[30] for Fe, Mn and Zn, by Nayek et al.[41] for Fe, Mn, and Cu and by Wu et al.[44] for Cu.Positive correlation of clay with the micronutrients revealed higher availability of nutrients with the increase of clay. According to Katyal and Sharma[30], Cu content in soils increases with the increase in fineness of soil texture and vice versa. Significant correlation observed by Chen et al.[43] with Fe, Mn, Zn and Cu state that clay content is important in controlling the level and distribution of trace metal concentrations in soils. The negative correlation of sand with micronutrients revealed that decrease in available nutrients with increase of particle size. Katyal and Sharma[30] also found similar correlation of Cu with sand.
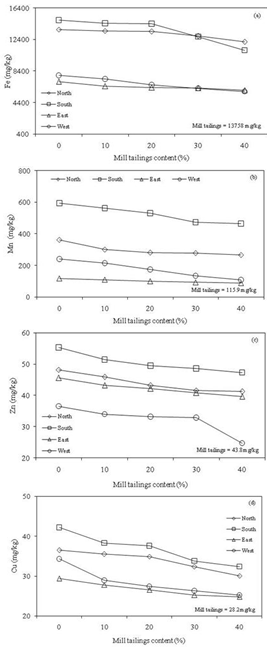 | Figure 13. Variation in (a) Fe (b) Mn (c) Zn and (d) Cu in soil-tailings mixture |
|
3.13. Status of Micronutrients in Tomato Fruits
- Fe, Mn, Zn and Cu accomplish decisive functions to maintain human health. Deficiency leads to undesirable pathological conditions whereas excess quantity becomes toxic[45]. The edible parts like roots, stems, leaves and fruits of the vegetables are consumed depending on their types. Concentrations of micronutrients in these parts do not remain same[41]. Since in tomato only fruits are edible, therefore, ripe tomato harvested after three months was tested.Concentrations of micronutrients in tomato fruits increased as the percentage of mill tailings increased (Figure 14). The concentrations of these micronutrients were compared with FAO/WHO Standards[46] given for metal concentrations in consumable vegetables[41]. From the Figure 14a, it was found that Fe ranged from 72.1 mg/kg to 199.5 mg/kg, which are within the limit of 450 mg/kg. Mn varied from 9.6 mg/kg to 21.2 mg/kg (Figure 14b). According to Nayek et al.[41], Mn toxicity in plants occurs when the concentrations range from 400 to700 mg/kg. Zn was within the limit of 60 mg/kg in north, south, east and west up to 30% indicating further is unsuitable (Figure 14c). Cu varied from 8.2 to 17.1 mg/kg, which were within the limit of 40 mg/kg (Figure 14d).
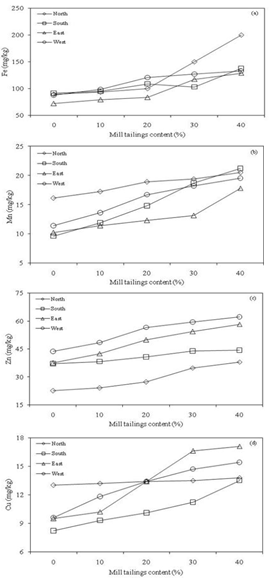 | Figure 14. Variation in (a) Fe (b) Mn (c) Zn and (d) Cu in tomatoes |
3.13.1. Soil/tomato plant transfer coefficient
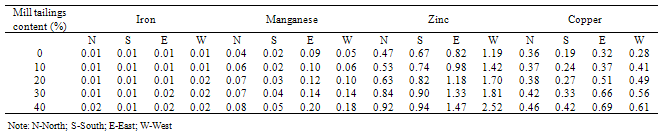
- A quantitative evaluation of the relationship of element uptake by the vegetables from soil solution was made by calculating appropriate plant/soil concentration factor, which indicates uptake of elements by the plant from the soil solution[47]. Nayek et al.[41] stated that the high metal translocation (>1) from soil to plant indicates higher metal uptake by the species. Soil/plant transfer coefficients for the micronutrients are shown in Table 6. The coefficient less than 1 for iron, manganese and copper indicates its lower concentrations in tomato fruit. The coefficients were also less than 1 for zinc in north, south and up to 10% of mill tailings in east. The coefficient greater than 1 from 20% onwards in east soil-tailings and in all the mixture of west-soil tailings indicated higher values of zinc in tomato fruit. Nayek et al.[41] found transfer coefficient of 0.63, 0.43, 0.48 and 0.23 for iron, manganese, zinc and copper respectively whereas Mohamed et al.[47] observed 0.04, 0.21, 2.50 and 0.53 for iron, manganese, zinc and copper respectively in tomato fruit. Metals are natural components of soil, thus many plants in the natural environment have great variation in transfer factor of these metals[48].
3.14. Growth of plant species on mill tailings
- Nitrogen, phosphorous and potassium are usually found deficient in mining wastes due to unavailability of organic matter. Without these nutrients, no plant growth will occur [49]. The tomato species planted in mill tailings grew adequately with some blossoms indicated availability of NPK. Hence presence of these nutrients would help in the growth of native plant species.The height and perimeter of each native plant species were measured after planting in the pots. Then with respect to this measurement, percentage increase in growth rate was determined at the end of every month. Percentage increase in the last month with respect to time of planting was also assessed (Table 7). At the end of first month, Bald Cypress showed zero percent increase in height and perimeter among thirteen plants. Even at the end of second month, there was nil growth in height. Increase in perimeter was nil at the end of third month. These lapses indicated that available nutrients are inadequate for this plant.Higher percentage increase in height was observed in Gulmohar, Eucalyptus and Babool at the end of first, second and third month respectively whereas the perimeter was higher for Tamarind, Gulmohar and Neem in corresponding month. When the highest percentage growth in height and perimeter was compared at the end of third month with respect to time of planting, the Babool was the highest in height (220.5%) and Gulmohar in perimeter (200%). Finally, Babool, Gulmohar, Neem and Eucalyptus are recommended for the reclamation of dump as these can grow in better way with the available nutrients of mill tailings. According to Williamson and Johnson[6], Eucalyptus has shown successful growth on nutrient-poor subsoil and meeting local requirements of timber but continuous grazing by livestock is inadvisable on reclaimed lands due to the toxicity hazards of heavy metals in the herbage. Reclamation by these plants will not only control air and water pollution but will also enhance the aesthetic view of this area as well as input of organic matter in tailings. Organic matter levels increase with time and thus nutrient retention capacity also increase[49].
|
| |||||||||||||||||||||||||||||||||||||||||||||||||||||||||||||||||||||||||||||||||||||||||||||||||||||||||||||||||||||||||||||||||||||||||||||||||||||||||||||||||||||||
4. Conclusions
- The lowest moisture content in mill tailings indicated that drought resistance /native species should be grown on dumps. Increase of mill tailings in soil-tailings mixture enhanced water holding capacity, which can save water for irrigation. Increase in cation exchange capacity revealed addition of cations from mill tailings. The highest electrical conductivity of 1.97 mS/cm among soil-tailings mixture revealed that further mixing will be unsuitable. Lower pH (< 6.5) in south showed poor growth in tomato plants. Yellow leaves, leaves of purple colour and chlorosis with leaf margin scorching revealed deficiency for nitrogen, phosphorus and potassium respectively. Calcium and sulphur deficiency did not occur whereas curling of leaves upward showed magnesium deficiency.Iron, manganese, zinc and copper decreased with the increase of mill tailings in soil however the values were many times higher than the limit prescribed indicating non deficiency in tomato. Positive correlation among them showed common source of their occurrence. The micronutrients increased with the increase of clay and decreased with increase of sand percentage indicating coarser size particles reduce the nutrients.Iron, manganese, and copper in tomato fruits did not exceed the limit prescribed for consumable vegetables whereas zinc was within the norm in north, south, east and up to 30% of mill tailings in west indicating further mixing will cause zinc toxicity. Soil-plant transfer coefficient showed that zinc at 20% onwards in east and in all proportion of west is higher in tomato fruits than soil-tailings mixture.Sufficient growth of tomato plant with some blossoms indicated presence of NPK in mill tailings. Native plant species like Babool, Gulmohar, Neem and Eucalyptus were found to be suitable for the reclamation of mill tailings dumps. These plants will not only provide ecological benefit in terms of fuel, organic matter input to dumps, and timber but will also be adequate for the control of wind and water erosion, enhancing aesthetic views and for preserving valuable metal if available in dumps.
ACKNOWLEDGEMENTS
- The authors are thankful to the Director, National Institute of Rock Mechanics for in-house funding of this project.
References
| [1] | P.A.K. Shettigher, Gold Production in India – Problems and Perspectives, Metals in India’s Development – The Vision of Jawaharlal Nehru, New Delhi, Ministry of Steel and Mines, Govt. of India, E.I.H. Press, Delhi, pp. 127-140, 1989. |
| [2] | P.R. Reddy, Environmental Geological Studies in the Kolar Gold Fields Area, Karnataka State, Kolar Gold Mine’s Centenary Celebrations, India, Vol. 2, pp. 423-435, 1980. |
| [3] | Roy, S., and Adhikari, G.R., 2009, Seasonal variation in suspended particulate matter vis-a-vis meteorological parameters at Kolar Gold Fields, India., Int. J. Environ. Eng., 1(4), 432-445. |
| [4] | Rao, S.M., and Reddy, B.V.V., 2006, Characterization of Kolar gold field mine tailings for cyanide and acid drainage., Geotech. Geol. Eng., 24 (6), 1545-1559. |
| [5] | S. Divya, Use of gold ore tailings (GOT) as a source of micronutrients to sunflower (helianthus annuus l.) in a vertisol, M. Sc. thesis (Agriculture) in Soil Science and Agricultural Chemistry, University of Agricultural Sciences, Dharwad, India, 2007. |
| [6] | A. Williamson, and M.S. Johnson, Reclamation of Metalliferous Mine Wastes. In: Effect of Heavy Metal Pollution on Plants (ed. N.W. Lepp), Applied Science Publishers Ltd., England, Vol 2, pp. 185-212, 1981. |
| [7] | S.K. Maiti, Handbook of Methods in Environmental Studies, Vol. 2: Air, Noise, Soil and Overburden Analysis, ABD Publishers, Jaipur, India, 2003. |
| [8] | Zegbe-Domı´nguez, J.A., Behboudian, M.H., Lang, A. and Clothier, B.E., 2003, Deficit irrigation and partial root-zone drying maintain fruit dry mass and enhance fruit quality in ‘Petopride’ processing tomato (Lycopersicon esculentum, Mill.)., Hort. Sci., 98 (4), 505–510. |
| [9] | L.C. Ho, Tomato. In: Photoassimilate Distribution in Plants and Crops: Source–Sink Relationships (eds. E. Zemaski and A.A. Schaffer), Marcel Dekker Inc., New York, pp. 709–728, 1996. |
| [10] | Pulupol, L.U., Behboudian, M.H. and Fisher, K.J., 1996, Growth, yield, and postharvest attributes of glasshouse tomatoes produced under water deficit., Hort. Sci., 31 (6), 926–929. |
| [11] | Reddy, B.A., Patil, M.S. and Rajasekaram, T., 2010, Effect of tomato leaf curl virus infection on plant growth and yield in tomato., Karnataka J. Agric. Sci., 23 (5), 806. |
| [12] | Maiti, S.K. and Ghose, M.K., 2005, Ecological restoration of acidic coal- mine overburden dumps – An Indian case study., Land Contam. Recl., 13 (4), 361-369. |
| [13] | C. Dakshinamurthi and R.P. Gupta, Practicals in Soil Physics, IARI, New Delhi, 1968. |
| [14] | M.L. Jackson, Soil Chemical Analysis, PHI Pvt. Ltd, New Delhi, pp. 71–81, 1973. |
| [15] | Subbiah, B.V. and Asija, G.L., 1956, A rapid procedure for the estimation of available nitrogen in soils., Curr. Sci., 25, 259-260. |
| [16] | Sparling, G.P., Whale, K.N. and Ramsay, A.V., 1985, Quantifying the contribution from the soil microbial biomass to extractable p levels of fresh and air dried soils., Aust. J. Soil. Res., 23, 613-621. |
| [17] | W.L. Lindsay and W.A. Norvell, Development of DTPA-soil tests for Zn, Fe, Mn and Cu. In: Soil Science Society of America Proceedings, 42, pp. 421–428, 1978. |
| [18] | M.M. Saxena, Environmental Analysis: Water, Soil and Air, Agro Botanical Publishers (India), Bikaner, p.123, 1989. |
| [19] | R.K. Trivedy, P.K. Goel and C.L. Trisal, Practical Methods in Ecology and Environmental Science, Enviro Media publications, Karad, India, 1987. |
| [20] | W.L. Daniels and K.C. Haering, Concepts of Basic Soil Science. In: The Mid-Atlantic Nutrient Management Handbook (eds. K.C. Haering and G.K. Evanylo), Mid-Atlantic Regional Water Program, Virginia Tech., 2006. |
| [21] | M.M. Rai, Principles of Soil Science, 4th ed., Macmillan India Limited, Delhi, 2002. |
| [22] | H.D. Foth and B.G. Ellis, Soil Fertility, 2nd ed., Lewis Publishers, New York, 1997. |
| [23] | C.R. O’Dell, C. Conner, R.C. White and H. Snodgrass, String Weave Fresh Market Tomatoes Summer and Fall Production Guide, Virginia Polytechnic Institute and State University, Petersburg, 2009, Available: www.ext.vt.edu. |
| [24] | U.M. Sainju, R. Dris and B. Singh, Mineral Nutrition of Tomato, 2003, Available:www.aseanfood.info/Articles/11019991.pdf. |
| [25] | L. Molley, The Chemical Nature of Soils. In: Soils, Ontario Forestry Association, 2011, Available: |
| [26] | http://www.ontarioenvirothon.on.ca/files/soil/soil_Chapter4.pdf |
| [27] | Yadav, B.R. and Paliwal, K.V., 1990, Growing vegetables with saline water., Ind. Hort., 35 (3), 11-13. |
| [28] | Cuartero, J. and Muñoz, R.F., 1998, Tomato and salinity., Hort. Sci., 78, 83-125. |
| [29] | Reina-Sa´nchez, A., Romero-Aranda, R. and Cuartero, J., 2005, Plant water uptake and water use efficiency of greenhouse tomato cultivars irrigated with saline water., Agric. Wat. Mgmt., 78, 54–66. |
| [30] | Weil, R.R., Islam, K.R., Stine, M.A., Gruver, J.B. and Samson-Liebig, S.E., 2003, Estimating active carbon for soil quality assessment: A simplified method for laboratory and field use., Am. J. Alternative Agr., 18 (1), 3-17. |
| [31] | Katyal, J.C., Sharma, B.D., 1991, DTPA-extractable and total Zn, Cu, Mn and Fe in Indian soils and their association with some soil properties., Geoderma, 49, 165–179. |
| [32] | R.L. Donahue, R.W. Miller and J.C. Shickluna, Soils – An Introduction to Soils and Plant Growth, 5th ed., PHI, New Delhi, pp. 148–149 and 234, 1990. |
| [33] | Ghose, M.K., 2004, Renewal of land damaged by coal mining for its sustainable, beneficial use in the Indian context., Land Contam. Recl., 12 (1), 29-37. |
| [34] | T.D. Biswas, and S.K. Mukherjee, Textbook of Soil Science, 2nd ed., Tata McGraw-Hill Publishing Company Limited, New Delhi, 1994. |
| [35] | Korikanthimath, V.S., Gaddi, A.V., Gowda, S.J.A. and Rao, G., 2002, Soil fertility evaluation in plantation belt of Kodagu district, Karnataka., J. Med. Aromat. Plant Sci., 24, 407-409. |
| [36] | W. Berry, Symptoms of Deficiency in Essential Minerals. In: Plant Physiology (eds. L. Taiz and E. Zeiger), 5th ed., Sinauer Associates Inc., Sunderland, MA, USA, 2010. |
| [37] | Hebbar, S.S., Ramachandrappa, B.K., Nanjappa, H.V. and Prabhakar, M., 2004, Studies on NPK drip fertigation in field grown tomato (Lycopersicon esculentum Mill.)., Eur. J. Agron., 21, 117-127. |
| [38] | M. Treshow, Environment & Plant Response, McGraw-Hill Book Company, New York, 1970. |
| [39] | Passam, H.C., Karapanos, I.C., Bebeli, P.J. and Savvas, D., 2007, A review of recent research on tomato nutrition, breeding and post-harvest technology with reference to fruit quality., Eur. J. Plant Sci. Biotechnol., 1 (1), 1-21. |
| [40] | G. Mullins and D.J. Hansen, Basic Soil Fertility. In: The Mid-Atlantic Nutrient Management Handbook, (eds. K.C. Haering and G.K. Evanylo), Mid-Atlantic Regional Water Program, Virginia Tech., 2006. |
| [41] | P.R. Hesse, A Textbook of Soil Chemical Analysis, CBS Publishers & Distributors, New Delhi, 2002. |
| [42] | Nayek, S., Gupta, S. and Saha, R.N., 2010, Metal accumulation and its effects in relation to biochemical response of vegetables irrigated with metal contaminated water and wastewater., J. Hazard. Mater., 178, 588-595. |
| [43] | Ma, L.Q., Tan, F. and Harris, W.G., 1997, Concentrations and distributions of eleven elements in Florida soils., J. Environ. Qual., 26, 769-775. |
| [44] | Chen, M., Ma, L.Q. and Harris, W.G., 1999, Baseline concentrations of 15 trace elements in Florida surface soils., J. Environ. Qual., 28 (4), 1173-1181. |
| [45] | Wu, C., Luo, Y. and Zhang, L., 2010, Variability of copper availability in paddy fields in relation to selected soil properties in southeast China., Geoderma, 156, 200-206. |
| [46] | Fraga, C.G., 2005, Relevance, essentiality and toxicity of trace elements in human health., Mol. Aspects Med., 26, 235–244. |
| [47] | FAO/WHO Standards, Joint Expert Committee on Food Additives, Summary and Conclusions, In: 3rd Meeting, Rome, 1-10th June, 1999. |
| [48] | Mohamed, A.E., Rashed, M.N. and Mofty, A., 2003, Assessment of essential and toxic elements in some kinds of vegetables., Ecotoxic. Envir. Saf., 55, 251–260. |
| [49] | Freedman, B., Hutchinson, T.C., 1980, Pollutant inputs from the atmosphere in soils and vegetation near a nickel, copper smelter at Sudburg, Canada., Can. J. Bot., 58, 108–132. |
| [50] | C.G. Down and J. Stocks, Environment Impact of Mining, Applied Science Publishers, London, 1977. |