-
Paper Information
- Next Paper
- Previous Paper
- Paper Submission
-
Journal Information
- About This Journal
- Editorial Board
- Current Issue
- Archive
- Author Guidelines
- Contact Us
Resources and Environment
p-ISSN: 2163-2618 e-ISSN: 2163-2634
2012; 2(1): 33-40
doi: 10.5923/j.re.20120201.05
Distribution of Heavy Metals in Water and Sediment along Abonnema Shoreline, Nigeria
 Abstract
 Reference
 Full-Text PDF
 Full-Text HTML
Ideriah T. J. K. 1, David-Omiema S. 2, Ogbonna D. N. 3
1Institute of Pollution studies, Rivers State University of Science and Tech., Rivers State, Nigeria
2Institute of Geosciences and Space Technology, Rivers State University of Science and Tech., Rivers State, Nigeria
3Department of Environmental and Applied Biology, Rivers State University of Science and Tech., Port Harcourt Rivers State, Nigeria
Correspondence to: Ideriah T. J. K. , Institute of Pollution studies, Rivers State University of Science and Tech., Rivers State, Nigeria.
| Email: |  |
Copyright © 2012 Scientific & Academic Publishing. All Rights Reserved.
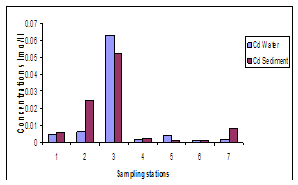
The concentrations of Cd, Cr, Cu, Zn and Pb in water and sediment collected along Abonnema shoreline were determined using GBC Avanta flame Atomic Absorption Spectrophotometer version 2.02. The metal concentrations in water ranged from < 0.001 -0.0772 mg/l Cu, 0.1139 - 6.1168 mg/l Zn, 0.0002 - 0.0012 mg/l Pb, <0.001 - 0.0628 mg/l Cd and 0.0632 - 0.1836 mg/l Cr and in sediment 0.1332 - 0.6229 mg/kg Cu, 1.0535 -7.0965 mg/kg Zn, 0.0075 - 0.0520 mg/kg Pb, <0.001 - 0.0526 mg/kg Cd and 0.0762 -0.3071 mg/kg Cr. The concentrations of the metals and their pollution index values in sediment were higher than those in water. The mean metal pollution index values for Cu (0.151±0.140), Cd (0.007±0.0005), and Cr (0.153±0.059) at the high activity area higher than Cu (0.132±0.131), Cd (0.002±0.001) and Cr (0.122±0.0295) at the low activity area while Zn (1.205±1.036) high and (1.478±0.6175) low as well as Pb (0.009±0.008) high and (0.020±0.0185) low showed the reverse. The difference in metal concentrations and metal pollution index values between sediment and water as well as high and low activity areas were not significant (P>0.05). The shoreline was considered critically contaminated as the concentrations of Cr, Zn and Cu exceeded permissible limits set by Rivers State ministry of environment, Federal Environmental Protection Agency and World Health Organization and therefore pose serious environmental concern. Low pH, high commercial activities, wastes, tidal and wave actions influenced the concentrations of metals in the area. Regular monitoring and evaluation of the water, sediment and sea foods were recommended.
Keywords: Heavy Metals, Abonnema, Shoreline, Water, Sediment, High Activity, Low Activity, Sombriero River
Cite this paper: Ideriah T. J. K. , David-Omiema S. , Ogbonna D. N. , "Distribution of Heavy Metals in Water and Sediment along Abonnema Shoreline, Nigeria", Resources and Environment, Vol. 2 No. 1, 2012, pp. 33-40. doi: 10.5923/j.re.20120201.05.
Article Outline
1. Introduction
- Coastal areas are sites of discharge and accumulation of a range of environmental contaminants[1]. Studies on heavy metals in rivers, lakes, fish and sediments have been a major environmental focus especially during the last decade[2-6]. Heavy metals contamination of coastal water and sediment has been identified as a serious pollution resulting from industrialization. Heavy metals contamination of river water is one of the major quality issues in fast growing cities because maintenance of water quality and sanitation infrastructure do not increase along with population and urbanization growth especially in developing countries[7,8]. There are five major sources of heavy metals viz: Geological weathering, (natural phenomenon), industrial processing of ore and metals, the disposal of metals and metal components, leaching of metals from garbage and solid waste heaps and animal and human excretions[9]. The single largest source of heavy metals in most coastal ecosystems in the United States is residential waste water effluents[9]. Other sources of heavy metals are Harbour activities such as docking, vessel repair facilities, antifouling, vessel paints, anticorrosion ma- terial and petroleum exploitation which activities introduce lead (Pb), copper (Cu), zinc (Zn), Cadmium (Cd), chromium (Cr) and other metals into the coastal wasters[10-12]. Heavy metals discharged into aquatic ecosystems are likely to be scavenged by particles leading to their accumulation in sediments[13]. A large reservoir of metals in the sediments can act as a source to the overlying water column after their input to the ecosystem has ceased[14], potentially leading to adverse ecologic effects[13]. However, the extent of the risks is difficult to accurately assess because of the complexity of biologic and chemical interactions that alter the bioavailability of metals. Release from sediments may not only result from re-suspension of particulates, but also through the activities of microorganisms within the sediments and at the sediment-water interface, resulting in biotransformation to more volatile/soluble forms[15]. These soluble forms of the heavy metals may be incorporated in crustaceans, finfish and shellfish[10]. Trace metal contaminations are important due to their potential toxicity for the environment and human beings. Among environmental pollutants, metals are of particular concern due to their potential toxic effect and ability to bioaccumulate aquatic ecosystems[16]. Pb and Zn are toxic in their cationic forms while Hg, Cu and others are biochemically transformed by microorganisms to organic metal compounds prior to becoming toxic. These alkylated metallic compounds increase their biological availability in terms of uptake and toxicity above that expected based on their cationic behaviour[10]. In addition to being toxic, these biologically available forms of metals often are bio-concentrated readily to very high levels in finfish and shell fish. Ingestion of sea foods contaminated by steady accumulation of these heavy metals has caused human health risks as in Minamata Bay case history[10]. These heavy metals are also enzyme poisons[17]. Since the heavy metals are also enzyme poisons, they can affect the capacity of the natural self- purification instruments of the coastal waters by disabling them structurally so that can not degrade other poisonous substances carried into the coastal waters at usual rates of biodegradation. The effect is, increase in concentration of biodegradable contaminants in sea foods. Lead (Pb), copper (Cu) and zinc (Zn) are usually found around harbours in coastal, waters; also they are impurities in petroleum[11-12]. The shoreline of Abonnema having served as harbour for more than two decades, before it was abandoned at the wake of the Nigerian Civil war in 1967 by the Nigerian ports Authority, by implication has the toxic heavy metal pollutants found around harbours. These heavy metals get adsorbed onto the sediment surface at different pH. Heavy metals sop onto suspended particulates; this is a concern because filter feeding organisms such as shellfish are most likely to bioconcentrate the metals associated with these particulates [10].The coastal waters of the shoreline of Abonnema, which is the Sombriero River, leads to other oil and gas bearing communities like Idama and Soku where oil and gas exploitation activities are at the peak. The shoreline of Abonnema is occasionally inundated by spilled oil from oil spillage when it occurs. An oil spill can cause not only hydrocarbon contamination but also heavy metal contamination in extremely small concentrations such as inorganic salts, metal soaps and organic metal complex compounds[12]. The building of the Abonnema- Degema bridge contributed its share of toxic heavy metals. The heavy metal contaminants may be released from the sediment into the water column; leading to the possible contamination of benthic organisms living in contact with them and finally of all the benthic food chain[18]. This study aims to determine the levels and distribution of the toxic heavy metals lead (Pb), copper (Cu), Cadmium (Cd), Chromium (Cr) and zinc (Zn) in water and sediment of Sombriero river at the shoreline of Abonnema in the Akuku- Toru Local Government Area of Rivers State, Nigeria with a view to create awareness and establish baseline data on the present status of the river.
2. Materials and Methods
2.1. Study Area
- Abonnema along whose shoreline the samples for the study were collected is an island located on the lateritic clay residual deposits in the transition or mangrove (Middle Delta) zone of the Niger Delta along the Sombriero River of Rivers State[19] (Fig. 1). This is the mangrove brackish water zone that has numerous intertidal flats and mangrove vegetation subsoil here is characterized by a typical fibrous pervious clayey mud that shows a large value of compressibility and consolidation[19]. The climate of the zone is basically that of tropical monsoon with rainfall occurring almost all through the year except the months of December, January and February, which are not completely free from rainfall in some years[19]. The zone experiences diurnal ebb and flow of the tides with maximum values obtained during the once- a-year spring tide[19]. The surface water of the Sombriero River along the shoreline of Abonnema is the sodium chloride (NaCl) subtype of the rock dominated type[20], because during the dry season a slight sparking in the river water is noticed when the water is disturbed at night by the observer in a boat. When the river water is collected and evaporated to dryness, sodium chloride (NaCl) crystals form. This salt can be used as table salt after recrystallizations to improve the purity, as practiced by most coastal communities located along the Sombriero River.
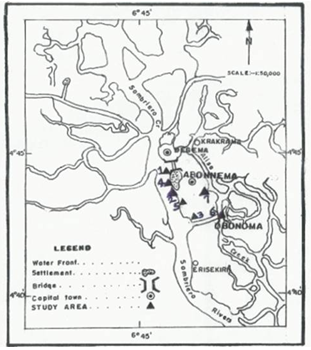 | Figure 1. Map of the study area showing sampling points |
2.2. Sampling Site Selection and Location
- The sampling site was selected based on representativeness of the site of wastes and metal components discharge and easy accessibility. The study area was divided into High (> 100 engine boats, along Sombriero river) and Low (< 20 engine boats, along Abonnema creek) activity areas depending on the type, number and frequency of engine boats, sea trucks, etc. Water and sediment samples were collected from seven stations (five high and two low) approximately 500 metres apart. Station 1 (Owusara) is situated between longitude 006° 46′ 23″ E and latitude 04° 44′ 24″ N, station 2 (Bulk oil produce, BOP, company area) is situated between longitude E006°″ 46′ 11″ E and latitude 04° 43′ 48″ N, station 3 (Alice-Okolo creek junction) is situated between longitude 006°″ 46′ 11″ E and latitude 04° 43′ 48″ N, station 4 (Quick-Penny water side in Georgewill compound) is situated between longitude 006°″ 46′ 9″ E and latitude 04° 43′ 59″ N, station 5 (Timber Poku i.e Timber water front) is situated between longitude 006° 46′ 19″ E and latitude 04° 45′ 32″ N, station 6 (Alice Okolo, Bridge Area) is situated between longitude 006° 46′ 36″ E and latitude 04° 43′ 31″ N, station 7 (Okolobio, between Jack and Georgewill compounds) is situated between longitude 006° 46′ 30″ E and latitude 04° 43′ 59″ N. The water and sediment samples were labelled (a) and (b) respectively at each station.
2.3. Sample Collection, Preparation and Analysis
- The water samples were collected after recording the pH in-situ using portable digital pH meter and temperature using thermometer. Plastic containers were used to collect the water samples. The containers were rinsed thoroughly with the water twice before collection. The sediment samples were collected with an ‘Erkman grab’ sampler. Winkler solutions I and II were added to the water samples for dissolved oxygen (DO) and kept under laboratory condition at 30℃. The sediment sample was dried, sieved and weighed.Twenty five millilitres (25ml) of water sample was measured into porcelain crucible and 1ml of concentrated nitric acid (HNO3) and 3ml of concentrated hydrochloric acid (HCl) were added. The sample was transferred to a steam bath and heated for about 30 minutes and cooled. The digest was made up to 50ml with distilled water and stored in plastic bottles for heavy metal analysis[21]. All water samples were treated similarly.Ten grams (10g) of ground and sieved sediment sample was weighed into porcelain crucible. 25ml of distilled water was added followed by 1ml of concentrated nitric acid (HNO3) and 3ml of concentrated hydrochloric acid (HCl). The sample was transferred to a steam bath, heated for about 1 hour and cooled. The digested sample was filtered and made up to 50ml with distilled water. The filtrate was stored in plastic bottles for heavy metal analysis. All sediment samples were treated similarly. The heavy metals in all the samples were determined using solar S. series Atomic Absorption Spectrophotometer (AAS).
3. Results and Discussion
3.1. Results
- The results of heavy metals in water and sediment along the shoreline of Abonnema are presented in Figs. 2-6 while Figs. 7A-E show the relationship in concentrations of the metals between sediment and water.
|
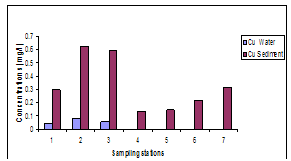 | Figure 2. Variations in concentrations of Cu in water and sediment |
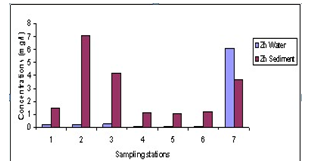 | Figure 3. Variations in concentrations of Zn in water and sediment |
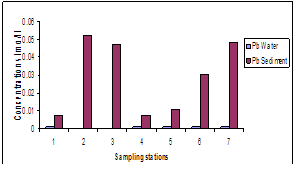 | Figure 4. Variations in concentrations of Pb in water and sediment |
 | Figure 5. Variations in concentrations of Cd in water and sediment |
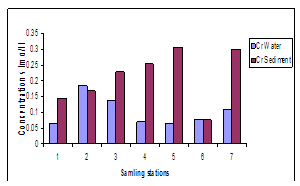 | Figure 6. Variations in concentrations of Cr in water and sediment |
|
3.2. Discussion
- The lower limits of the pH range observed at stations 7 and 5 were slightly acidic; this may be as a result of high organic carbon load oxidation in those stations which produced large volumes of carbon dioxide that dissolved in the water to produce carbonic acid which lowered the pH. The pH of the water was higher than that of the sediment. Statistical analysis showed significant difference (p<0.05) between the pH in the water and sediment. This was due to organic carbon breakdown in the sediment. On the average the pH range was within the permissible limit of 6.5 – 8.5[23].The higher concentrations of metals measured in sediment than in water indicate that lower pH favoured metal accumulation and is in agreement with report that sediments are the major depository of metals holding more than 99% of total amount of a metal present in the aquatic system[30-32].The correlation between the concentrations of metals in water and sediment fitted a linear regression equation (1) of the form:
 | (1) |
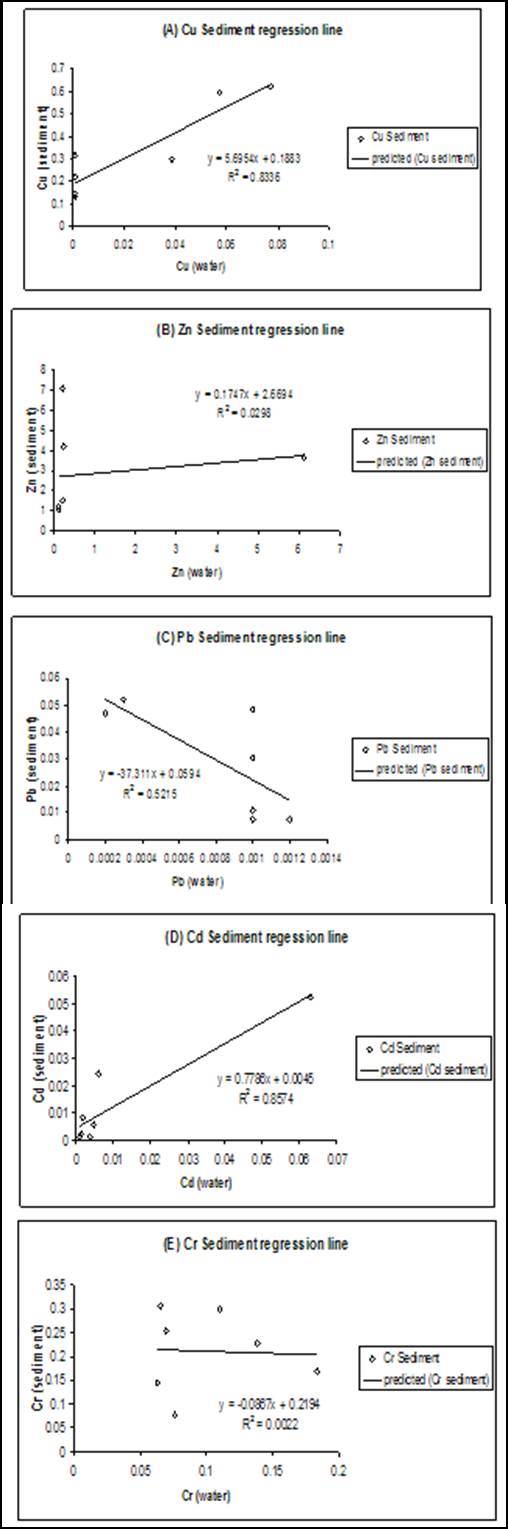 | Figure 7(A-E). Regression plots showing the relationship between metals in sediment and water |
 | (2) |
4. Conclusions
- The findings of this study showed that sediment in the ultimate sink for heavy metals in the aquatic system. The water body surrounding Abonnema island is contaminated with heavy metals especially Zn, Cr, Cu and Cd which can contaminate sea foods and hence humans. The MPI values indicate that the sediment and Zn in water from the river are critically contaminated with respect to heavy metals and therefore pose serious environmental concern. Abandoned metals parts and effluents from industrial and commercial activities such as fishing (nets, hooks, etc) shipping, timber processing and outboard engine boats influenced the levels of metals along the Sombriero River axis of Abonnema while domestic activities (such as building materials, solid wastes), run offs, tidal and wave actions influenced the metal levels along the Abonnema creek. The area is contaminated with heavy metals and requires creation of awareness, periodic monitoring and evaluation of sea foods since most communities along the Sombriero River depend on sea foods and use the water for salt production after crystallization.
References
| [1] | Shaw, D.G. (1984): Hydrocarbon in the water column. In Wolfe, DA (ed), fate and effects of proteum Hydrocarbon in marine ecosystems and organisms. New York pegamon press p 8 |
| [2] | Ozmen, H., Kulahci, F., Cukurovali, A. and Dogru, M. (2004): Concentrations of heavy metals and radioactivity in surface water and sediment of Hazar Lake (Elazig, Turkey). Chemosphere, 55: 401-408 |
| [3] | Fernandes, C., Fontainhas-fernandes, A., Cabral, D. and Salgado, M.A. (2008): Heavy metals in water, sediment and tissues of Liza Saliens from Esmoriz-paramos Lagoon, Portugal, Environ. Monitor. Assess. 136: 267-275 |
| [4] | Ozturk, M., Ozozen, G., Minaseci, O. and Minareci, E. (2008): Determination of heavy metals in tissues of fishes, water and sediment from the DemirkopruDam Lake (Tur key). J. Appl. Biol. Sci; 2: 99-104 |
| [5] | Pote, J, Haller, L., Loizeau, J.L., Bravo, A.G., Satre, V. and Wildi, W. (2008): Effects of sewage treatment plant out let pipe extension on the distribution of contaminants in the sediments of the Bay of Vidy, lake Geneva, Switzerland. Biore sour. Technol; 99:7122-7131 |
| [6] | Praveena, S.M, Radojevic, M., Adullah, M.H. and Aris, A.Z. (2008): Application of Sediment quality L guidelines in the assessment of mangrove surface sediment in mengkabong Lagoon, Sabah, Malaysia. Iranian J. Environ. Health Sci; Eng; 5:35-42 |
| [7] | Akoto, O., Bruce, T.N., Darko, G. (2008): Heavy metals pollution profiles in streams serving the Owabi reservoir. AfricanJ. Environ. Sci. Tech., 2 (11), 354-359 |
| [8] | Ahmad, M.K., Islam, S., Rahman, S., Haque, M.R., Islam, M.M. (2010): Heavy metals in water, sediment and some fishes of Buriganga River, Bangladesh. Int. J. Environ. Res., 4 (2), 321-332 |
| [9] | Forstner, U (1983): Metal concentration in River, lake and ocean waters. In Forstner U and Whitman G,T. (eds). Metal pollution in the Aquatic Environments Springer verlag. New York P 77-109 |
| [10] | NNPC and RIP (1986): Reports for the Establishment of controls and standards against petroleum related pollution in Nigeria No RPI/R/84/15-7p111A 100-103 |
| [11] | Tim, F., Jonathan, S. Ravi, I. and Jim, S. (1998): Interactions between metals and microbial communities in new Bedford Harbours, Massachuseit. Environ Health perspect 106 (sapp 14) 1033-1039 |
| [12] | http/ehpne/Nichs.Nichgov/does/1998/sappl-4/1033-1039 Ford/abstract. Htni |
| [13] | Chaerun, S.K., Tazak, K., Asada, R., Kogure, K.. (2004): Alkane degrading bacteria and heavy metals from Nakohodka oil spill polluted sea shore in the sea of Japan after five years of remediation. The science reports of Kanazawa University Vol. 49 No 1-2 |
| [14] | Luoma, S.N. (1989): Can we determine the bioavailability of sediment bound trace metals. Hydrobiology, 176, 177: 370- 376 |
| [15] | Officer, C.B., and Lynch, D.R, (1989): Bioturbation, Sedimentation and Sediment water exchange in estuarine Coastal Shelf, Sci. 28:112 |
| [16] | Gilmour, G.G., Tuttle, T.H, Means, J.C, (1985): Tin methylation in sulphide bearing sediment in marine and estuarine geochemisty. Siglo, A.C., Hatton, A., (eds) Chelsea, Michigan: Lewis publishers 239-258 |
| [17] | Censi, P., Spoto, S.E., Saiano, F., Sprovieri M. and Mazzola, S. (2006): Heavy metals in Coastal water system. A case study from North Western Gult of Thailand. Chemosphere, 64: 1167-1176 |
| [18] | Rheinhemer, G, (1991): Aquatic microbiology 4th Edition Lewis Publishers p 76-80 |
| [19] | Calmano, W and Forstner U (1996): Sediments and toxic substances. Springs Germany pp 56 – 78 |
| [20] | Teme, S.C., (2002): Rocks, soils and water, their impacts on man in space and time inaugural lecture Series No 8 p 0-53. Rivers State University of science and Technology, Nkpolu Oroworukwo, Port Harcourt |
| [21] | Meybeck, M. (1981): Pathways of major Element from land to ocean through water, in Martin, J.R., Buston, J.D and Eisma, D (eds). CRC press Bola Ration F.L p41-48 |
| [22] | APHA. (1995): Standard Methods for the Examination of water and waste, APHA-AWWA-WPCR Washington. D.C pp 4.12-4.124 |
| [23] | WHO (2003): Malathion in drinking water. Background Document for preparation of WHO Guidelines for drinking water Quality. World Health Organization (WHO/SDE/ WSH/03.04/103) |
| [24] | RSMENR, (2002): Rivers State Ministry of Environment and Natural Resources. Interim guidelines and Standards on environmental pollution control and management. Pp. 39-45 |
| [25] | WHO (2006): Guidelines for Drinking water Quality. First Addendum to the third Edition vol.1. Recommendations pp 491-493 |
| [26] | EC (1998): council directive 98/83/. EC of November 1998 on the quality of water intended for human consumption. L. 330/32, European commission. http: //vlex. Com/vid quality water intended human consumption 24517862 |
| [27] | SON, (2007): Nigerian Standards for drinking water quality. Nigerian industrial standards NIS: 554. http: // www. Unicef. Org / Nigeria / ng publications. Nigerian standard for drinking water quality. Pdf |
| [28] | FEPA (1991): Guidelines and standards for environmental pollution control in Nigeria. Federal Environmental protection Agency, pp51-100 |
| [29] | EC (2005): Commission regulation (EC) No. 78/2005 of 19 January 2005 amending regulation (EC) No. 466/2001 as regards heavy metals. Official J. Eur. Union, 43-45 |
| [30] | UNEP (1985): Reference methods for marine pollution studies. Determination of Total Hg in marine sediments and suspended solids by cold vapour AAS, vol. 26. pp. 1-28 |
| [31] | Lau, S., Mohamed, M. A., Tan, C. Y. and Sabtuyah, S. (1998): Accumulation of heavy metals in freshwater mollusks. The science of the Total Environment. 214, 113-121 |
| [32] | Chindah, A. C. and Braide, S. A. (2003): Cadmium and Lead concentrations in fish species of a brackish wetland/upper Bonny Estuary, Niger Delta. JNES. 2 (3): 5-11 |
| [33] | Ideriah, T. J. K., Briggs, O.A. and Stanley H.O. (2010): Bioaccumulation of heavy metals in periwinkle from lower Sombriero River, Nigeria. JNES, 5 (3) 207-216 |
| [34] | AMA (Agenccia de Medio Ambiente de Andacucia, Spain), (1992): Determination del contenido de pesticides en aguas de metals en organisms vivos, 55 – 67 |
| [35] | Usero, J., Regalado-Gonzalez, E., and Gracia, I., (1996): Trace metals in the bivalve mollusk and Chamelea gallina from the Atlantic coast of Southern Japan. Baseline. 32 (3), 305-310 |
| [36] | Prasad, B, and Kumari, S; (2008): Heavy metal pollution index of ground water of an abandoned open cast mine filled with fly ash: A case study. Mine water Environ., 27 (4), 265-267 |
| [37] | Reza, R. and Singh, G. (2010): Assessment of Heavy metal contamination and its indexing approach for river water. Int. J. Environ. Sci. Tech. 7(4), 785-792 |