-
Paper Information
- Previous Paper
- Paper Submission
-
Journal Information
- About This Journal
- Editorial Board
- Current Issue
- Archive
- Author Guidelines
- Contact Us
Resources and Environment
p-ISSN: 2163-2618 e-ISSN: 2163-2634
2011; 1(1): 32-41
doi: 10.5923/j.re.20110101.05
Assessing the Health of Sediment Ecosystem of Mithi River of Mumbai: Use of Physico-Chemical Measurements
 Abstract
 Reference
 Full-Text PDF
 Full-Text HTML
Pravin U. Singare 1, Ravindra M. Mishra 1, 2, Manisha P. Trivedi 1, 2
1Department of Chemistry, Bhavan’s College, Munshi Nagar, Andheri (West), Mumbai 400058, India
2Department of Chemistry, Shri. Jagdishprasad Jhabarmal Tibrewala University, Jhunjhunu, Rajasthan 333 001, India
Correspondence to: Pravin U. Singare , Department of Chemistry, Bhavan’s College, Munshi Nagar, Andheri (West), Mumbai 400058, India.
| Email: |  |
Copyright © 2012 Scientific & Academic Publishing. All Rights Reserved.
The present paper deals with assessment of physico-chemical properties of sediments samples collected along Mithi River of Mumbai. The study was carried for the period of two years i.e. 2009-10 and 2010-11 at three different sampling stations namely Jarimari near airport, CST Kalina road and Taximen’s colony at Bandra Kurla Complex (BKC). It was observed that pH values at the above three sampling stations recorded during 2009-10 were 6.75, 6.63 and 4.30 respectively, which decreases to 4.95, 4.06 and 4.02 respectively during 2010-11. The above pH values were lower than that reported by Maharashtra Pollution Control Board (MPCB) in 2004.The chloride content recorded at three sampling stations during 2009-10 were 3177 mg/L, 2849 mg/L and 1825 mg/L which increases to 3256 mg/L , 3176 mg/L and 2148 mg/L respectively during the year 2010-11. Similarly sulfate values recorded were 2204 mg/L, 3545 mg/L and 5811 mg/L during the year 2009-10 which increases to 4682 mg/L, 4266 mg/L and 5318 mg/L respectively for the three sampling stations during the year 2010-11. The above observed chloride and sulfate values were higher than that reported by MPCB in 2004. The other physico-chemical parameters like electrical conductivity, sulphide and phosphate contents were also found to be higher in 2010-11 as compared to that in 2009-10.
Keywords: Sediments, Physico-Chemical Parameters, pH, Electrical Conductivity, Sulfate, Sulfide, Chloride, Phosphate, MPCB, Mithi River, Mumbai, India
Cite this paper: Pravin U. Singare , Ravindra M. Mishra , Manisha P. Trivedi , "Assessing the Health of Sediment Ecosystem of Mithi River of Mumbai: Use of Physico-Chemical Measurements", Resources and Environment, Vol. 1 No. 1, 2011, pp. 32-41. doi: 10.5923/j.re.20110101.05.
Article Outline
1. Introduction
- Sediment is the loose sand, clay, silt and other soil particles that settle at the bottom of a body of water (United State Environmental Protection[1]. It can come from soil erosion or from the decomposition of plants and animals. Wind, water and ice help carry these particles to rivers, lakes and streams. Sediments comprise an important component of aquatic ecosystems, providing habitat for a wide range of benthic and epi-benthic organisms. Exposure to certain substances in sediments represents a potentially significant hazard to the health of these organisms. Effective assessment of this hazard requires an understanding of the relationships between concentrations of sediment associated chemicals and the occurrence of adverse biological effects. Sediment quality guidelines are scientific tools that synthesize information regarding the relationships between the sediment concentrations of chemicals and any adverse biological effects resulting from exposure to these chemicals. Bottom sediments consist of particles that have been transported by water, air or glaciers from the sites of their origin in a terrestrial environment and have been deposited on the floor of a river, lake, or ocean. In addition to these particles, bottom sediments will contain materials precipitated from chemical and biological processes. Natural processes responsible for the formation of bottom sediments can be altered by anthropogenic activities. Many man-made materials have entered bodies of water through atmospheric deposition, runoff from land, or direct discharge into the water. Most hydrophobic organic contaminants, metal compounds, and nutrients, which enter the water, become associated with particulate matter. This particulate matter then settles and accumulates in the bottom sediments. Under certain conditions the contaminants in the bottom sediments may be released back into water or enter the food chain. Consequently, bottom sediments are a sink as well as a source of contaminants in the aquatic environment[2]. These contaminants may pose a high risk to the environment on a large scale and hence need to be monitored at regular intervals. Extensive research work is carried out previously to study the water pollution arising due to discharge of industrial effluents[3-13], however relatively less attention has been given to understand the relationship between pollution load and physico-chemical properties of sediments[14-19].The present study to understand the physico-chemical properties of sediments is therefore carried out to understand the pollution load on Mithi River of Mumbai. The Mithi River (aka Mahim River) is a river in Salsette Island, the island of the city of Mumbai. It is a confluence of tail water discharges of Powai and Vihar lakes. It flows for a total of 15 km before it meets the Arabian Sea at Mahim Creek flowing through residential and industrial complexes of Powai, Saki Naka, Kurla, Kalina, Vakola, Bandra-Kurla complex, Dharavi and Mahim. This river is treated like an open drain by the citizens who discharge raw sewage, industrial waste and garbage unchecked. Besides this, illegal activities of washing of oily drums, discharge of unauthorized hazardous waste are also carried out along the course of this river. It is estimated that the Mithi River receives approximately 5 MLD domestic wastewater from areas like Sakinaka to Kurla, Chunabhatti, Mahim, nearby hutments through various drainages. The organic waste, sludge and garbage dumping has reduced carrying capacity of the Mithi river. The water with mixture of sewage and industrial waste is a threat to marine life and the river is showing sign of total loss of such support system. Preliminary short term survey conducted in 2004 indicates that the pollution levels have reached an alarming stage[20]. A survey on Mithi River was undertaken jointly by Central Pollution Control Board and Maharashtra Pollution Control Board, Mumbai as per the direction of Honorable Court to assess the various activities undergoing on the banks of Mithi river, which is ultimately contributing the pollution load in the river and also to suggest preventive measures to be adopted to revive the river from this precarious situation. The report suggest the presence of cyanide, one of the most poisonous substances at places like Jarimari, near Saki Naka and the airport; this is an indicator of the illegal industries functioning in these regions. Sulfates and chlorides were also noticed near Mahim Creek and farther upstream. When the river was not as polluted as it is today, it was used to serve as an important storm water drain for Mumbai but as it has been used as a sewer over the years, its importance as a storm water drain has reduced and on the contrary, it poses as a hazard during high tide bringing polluted water into the city.Previous pollution load data based on short term survey conducted by Maharashtra Pollution Control Board (MPCB) along the Mithi river in 2004[20] points out to the need of systematic and regular monitoring of pollution level for further improvement in the waste water treatment methods. Understanding the existing status, in the present investigation an attempt has been made to study the physico-chemical properties of water samples collected at three sampling stations namely Airport, CST Kalina road, and Taximen’s Colony BKC along the Mithi River of Mumbai.
2. Materials and Methods
2.1. Area of Study
- Airport site near Jari Mari area from where Mithi River flows is thickly populated and has many small scale industries including scrap dealers. Previous short term study conducted by Maharashtra Pollution Control Board shows the presence of cyanide, consistent high COD, oil and grease found at this station indicating some chemical activity in that area. Development of Bandra-Kurla Complex has resulted in diversion and unnatural turn along the Mithi River at few places thereby affecting natural flow of the river and seriously affected the drainage. This part of the river is a dumping ground for garbage and it is reflected in higher values of suspended solids. Unauthorized encroachments by illegal industrial units, scrap dealers and oil mixing business at CST road near Kalina, have further resulted in discharge of solid waste, organic waste, industrial waste, heavy metals, oils and tar in the river. This sampling point is surrounded by many small scale industries including recyclers, barrel cleaners, workshops and other units. This area has thick density of population. Illegal activities like washing of oily drums have resulted in discharge of unauthorized hazardous waste which is carried out along the bank of this river. The organic waste, sludge and garbage dumping has reduced the carrying capacity of the Mithi River. The above solid wastes which is discharged in to the Mithi river from the surrounding illegal industries and the slums has resulted in sever water logging during 26/7 deluge in Mumbai. The map showing flow of Mithi River is shown in Figure 1.
2.2. Climatic Conditions
- The area is located along western Arabian cost of India from 18 deg. 53’ north to 19 deg. 16’ north latitude and from 72 deg. east to 72 deg. 59’ longitude. The area experiences tropical savanna climate. It receives heavy south west monsoon rainfall, measuring 2166 mm on an average every year. The temperature ranges from 16 deg. centigrade to 39 deg. centigrade with marginal changes between summer and winter months. Whereas relative humidity ranges between 54.5 to 85.5%.
2.3. Requirements
- The chemicals and reagent were used for analysis were of AR grade. The procedure for calculating the different parameters were conducted in the laboratory. The laboratory apparatus were acid soaked (nitric acid) before the analysis. After acid soaked, it is rinsed thoroughly with tap water and de-ionised distilled water to ensure any traces of cleaning reagents were removed. Finally, it is dried and stored in a clean place[21]. The pipettes and burette were rinsed with solution before final use.
2.4. Sediment Sampling, Preparation and Analyses
- The sediment samples were collected randomly four times in a month in morning, afternoon and evening session from three different sampling stations namely Airport near Jarimari (S-1), CST Kalina road (S-2), and Taximen’s Colony BKC (S-3) along the Mithi River of Mumbai (Figure 1). The samples were collected and subsequently analysed for a span of two years starting from October 2009 to September 2011. The sampling was done in three shifts i.e. morning shift between 07:00 a.m. to 09:00 a.m., afternoon shift between 02:00 p.m. to 04:00 p.m. and evening shift between 07:00 p.m. to 09:00 p.m. Sediment samples were collected by hand-pushing plastic core tubes (7 cm diameter) as far as possible into the sediment. The sediment cores retrieved in the field were sliced on arrival at the lab at 1-cm depth intervals for the first 15 cm, 2-cm depth intervals from 15–25 cm, and then every 5 cm for the deeper sections of the cores. The sediments were kept cool in icebox during the transportation to the laboratory[22, 23]. They were then ground manually to a fine powder in an alumina mortar; it is passed through a 2-mm mesh screen and stored in polyethylene bags based on method used by for further analysis.
2.5. Physico-chemical Study
- The present study provides a detailed description of the physico-chemical criteria of sediment samples collected from Airport, CST Kalina road, and Taximen’s Colony BKC along the Mithi River of Mumbai. The physico-chemical parameters assessed were pH, electrical conductivity, chloride, sulfate, sulfide and phosphate. The standard techniques and methods were followed for physical and chemical analysis of sediment samples[24, 25].
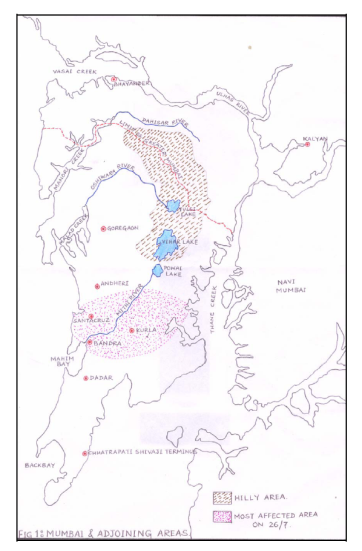 | Figure 1. Map showing flow of Mithi River in Mumbai |
2.6. Quality Control/Assurance
- Sediment samples were collected with plastic-made implements to avoid contamination. Samples were kept in polythene bags that were free from heavy metals and organics and well covered while transporting from field to the laboratory to avoid contamination from the environment. Analytical grade reagents were used for all analyses. All reagents were standardised against primary standards to determine their actual concentrations. All instruments used were calibrated before use. Tools and work surfaces were carefully cleaned for each sample during grinding to avoid cross contamination. Duplicate samples were analysed to check precision of the analytical method and instrument.
 | Figure 2. Variation in pH values of sediment samples collected at different sampling stations along Mithi River of Mumbai |
 | Figure 3. Variation in electrical conductivity values of sediment samples collected at different sampling stations along Mithi River of Mumbai |
 | Figure 4. Variation in chloride content of sediment samples collected at different sampling stations along Mithi River of Mumbai |
 | Figure 5. Variation in sulfate content of sediment samples collected at different sampling stations along Mithi River of Mumbai |
 | Figure 6. Variation in sulfide content of sediment samples collected |
 | Figure 7. Variation in Phosphate content of sediment samples collected at different sampling stations along Mithi River of Mumbai |
3. Results and Discussion
- The experimental data on physico-chemical properties of water samples collected at three different sampling stations along the Mithi River of Mumbai is presented in Tables 1-3.Acid mine drainage, industrial effluent, and atmospheric emissions of sulphur and nitrogen oxides are largely responsible for the acidification of surface waters and sediments. pH of the sediments is a measure of their acidity or alkalinity and is one of the stable measurements. Fish, shellfish and aquatic insects have different tolerances to acidic medium and species diversity will decrease along with increased acidification. Young organisms tend to be more sensitive to acidic medium: for example, at a pH of 5, most fish eggs cannot hatch, while only some adult fish will be affected. The toxicity of heavy metals also gets enhanced at particular pH. Acidic sediments also mobilize metals that can be toxic to aquatic species (e.g., aluminium). Metal toxicity can cause reduced survivorship in fish through chronic stress, which impairs health and decreases the affected individuals’ ability to secure food; shelter, or reproductive partners[26].Thus, pH is having primary importance in deciding the quality of sediments. In the present investigation, the biyearly average pH values of sediment samples collected from different sampling stations vary between minimum 4.16 to maximum of 5.85 at S-3 and S-1 sampling stations respectively (Tables 1 and 3).
- It was observed that for the assessment years 2009-10 the pH values recorded were higher as compared to that recorded during 2010-11. The pH values recorded for the two assessment years were below that reported in the survey conducted by MPCB in 2004[20] (Figure 2).It is well known that electrical conductivity is a good measure of dissolved solids. Conductivity is a measurement used to determine mineralization and determining amounts of chemical reagents or treatment chemicals to be added to the water. In the present investigation, the biyearly average conductivity values of the sediment samples varies from minimum of 253 µmhos/cm at S-2 sampling station to maximum of 307 µmhos/cm at S-3 sampling stations (Tables 2 and 3). It was also observed that the average conductivity values increases for the two assessment years (Figure 3), indicating increase in deposition of dissolved salts.
|
|
4. Conclusions
- Environmental problems concerning coastal & aquatic bodies cannot be addressed in isolation. They are intricately interwoven with each other. The environments of land and water bodies are interdependent, linked by complex atmospheric, geological, physical, chemical and biological interactions. The human activities that effect, and arise from this environment also depend on economic and social factors. The problem is beyond the limits of physical and institutional bodies, and therefore, there is a need to set common objectives and implement compatitable policies and programmes. Today it is realised that solution to environmental problem can only be achieved through a comprehensive, systematic and sustained approach. During the past few years, attempts were made by various groups to develop strategies directed towards more integrated approach in coastal environments. The present data on pollution in sediments at Mithi River also points out to the need of regular monitoring of water resources and further improvement in the industrial waste water treatment methods. What is more fundamentally lacking is a consistent, internationally recognised and data driven strategy to assess the quality of aquatic bodies and generation of international standards for evaluation of levels of contaminants. The existing situation if mishandled can cause irreparable ecological harm in the long-term well masked by short term economic prosperity.
ACKNOWLEDGEMENTS
- The authors are extremely thankful to SAP Productions for developing and maintaining the manuscript template.
References
| [1] | United States Environmental Protection Agency (USEPA) (2002). Water quality monitoring for Coffee Creek (Porter County, Indiana). Retrieved Sept. 29,2006, from, http://www.USEPA/Research/Research.htm.modecode=62-28-00-00. |
| [2] | Mucha, A.P., Vasconcelos, M.T.S.D., and Bordalo, A.A., 2003, Macrobenthic community in the Douuro Estuary: relation with trace metals and natural sediment characteristics, Environmental Pollution 121(2), 169 –180. |
| [3] | Lokhande, R.S., Singare, P.U., and Pimple, D.S., 2011, Toxicity Study of Heavy Metals Pollutants in Waste Water Effluent Samples Collected From Taloja Industrial Estate of Mumbai, India, Resources and Environment (In Press). |
| [4] | Lokhande, R.S., Singare, P.U., and Pimple, D.S., 2011, Study on Physico-Chemical Parameters of Waste Water Effluents from Taloja Industrial Area of Mumbai, India., International Journal of Ecology (In Press). |
| [5] | Lokhande, R.S., Singare, P.U., and Pimple, D.S., 2011, Pollution in Water of Kasardi River Flowing Along Taloja Industrial Area of Mumbai, India., World Environment (In Press). |
| [6] | Modak, D.M., Singh, K.P., Ahmed, S. and Ray, P.K., 1990, Trace metal ion in Ganga water system, Chemosphere, 21(1-2), 275-287. |
| [7] | Moundiotiya, C., Sisodia, R., Kulshreshtha, M. and Bhatia, A.L., 2004, A case study of the Jamwa Ramgarh wetland with special reference to physico-chemical properties of water and its environs., J. Environmental Hydrology, 12, Paper 24, 1–7. |
| [8] | Prabha, S. and Selvapathy, P., 1997, Heavy metal pollution in Indian Rivers., Indian J.Environ. Prot., 17(6), 641-649. |
| [9] | Rajaram, T., and Das, A., 2008, Water pollution by industrial effluents in India: Discharge scenarios and case for participatory ecosystem specific local regulation, Futures, 40(1), 56-69. |
| [10] | Sasamal, S.K., Rao, K.H. and Suryavansi, U.M., 2007, Sewage and Industrial pollution in and around Thane Creek, Mumbai using high resolution IRS data, International J. Remote Sensing, 28(19),4391-4395. |
| [11] | Sharma, S.D., Pande, K.S., 1998, Pollution studies Ramganga river at Moradabad. Physico-Chemical characteristics and toxic metals, Pollut.Res.,17(2), 201-209. |
| [12] | Singare, P.U., Lokhande, R.S. and Jagtap, A.G., 2010, Study of Physico- chemical quality of the Industrial Waste Water Effluent from Gove Industrial Area of Bhiwandi City of Maharashtra, India, Interdisciplinary Environmental Review, 11(4), 263-273. |
| [13] | Singare, P.U., Lokhande, R.S. and Jagtap, A.G., 2011, Water pollution by discharge effluents from Gove Industrial Area of Maharashtra, India: Dispersion of heavy metals and their Toxic effects, International Journal of Global Environmental Issues, 11(1), 28–36. |
| [14] | Lokhande, R.S., Singare, P.U., and Pimple, D.S., 2011, Quantification Study of Toxic Heavy Metals Pollutants in Sediment Samples Collected from Kasardi River Flowing along the Taloja Industrial Area of Mumbai, India., The New York Science Journal, 4(9), 66-71. |
| [15] | Singare, P.U., 2011, Distribution Behaviour of Trace and Toxic Metals in Soil and Sediment along the Thane Creek Near Mumbai, India., Interdisciplinary Environmental Review, 12(4), 298–312. |
| [16] | Singare, P.U., Lokhande, R.S., and Bhattacharjee, S.S., 2011, Physico-Chemical Analysis of the Sediment Samples collected from Thane Creek of Maharashtra, India., Interdisciplinary Environmental Review, 12(02), 95-107. |
| [17] | Menounou, N., Presley, B.J., 2003, Mercury and Other Trace Elements in Sediment Cores from Central Texas Lakes, Arch. Environ. Contam. Toxicol. 45(1), 11–29. |
| [18] | Spooner, D.R., Maher, W., and Otway, N., 2003, Trace Metal Concentrations in Sediments and Oysters of Botany Bay, NSW,Australia., Arch. Environ. Contam. Toxicol. 45(1), 92–101. |
| [19] | Sahu, S.K., Ajmal, P.Y., Pandit, G.G., and Puranik, V.D., 2009, Vertical distribution of polychlorinated biphenyl congeners in sediment core from Thane Creek area of Mumbai, India., Journal of hazardous materials, 164(2-3), 1573-1579. |
| [20] | Klean Environmental Consultants Pvt. Ltd., Mumbai, Survey Report on Mithi River Water Pollution and Recommendations for its Control’, Report Submitted To Maharashtra Pollution Control Board (MPCB), Mumbai. Ref.No.0407/Mpcb Mithi River Survey/ 109, July 10, 2004. |
| [21] | M. Radojevic, and V.N. Bashkin, Practical Environmental Analysis, New York, Royal Society of Chemistry, Cambridge, 1999. |
| [22] | Al-Shiwafi, N., Rushdi, A. I., and Ba-Issa, A., 2005, Trace Metals in Surface Seawaters and Sediments from Various Habitats of the Red Sea Coast of Yemen., Environmental Geology, 48(4-5), 590-598. |
| [23] | Jung, H., Yun, S., Mayer, B., Kim, S., Park S., and Lee, P., 2005, Transport and Sediment-Water Partitioning Of Trace Metals in Acid Mine Drainage: An Example from the Abandoned Kwangyang Au-Ag Mine Area, South Korea,. Environmental Geology, 48(4-5), 437-449. |
| [24] | APHA, AWWA and WEF, 1998, Standard methods for the examination of water and wastewater, 20th edition, Clesceri, L.S. Greenberg, A.E. and Eaton, A.D. (Eds.), American Public Health Association, American Water Work Association, Water Environment Federation, Washington DC. |
| [25] | M.L. Jackson, Soil Chemical Analysis, New Delhi, Prentice-Hall of India Private Limited, 1973. |
| [26] | Mohan, M., and Kumar, S., 1998, Review of acid rain potential in India: future threats and remedial measures., Current Science, 75(6), 579-593. |
| [27] | Hattersley, J.G., 2000, The Negative Health Effects of Chlorine., The Journal of Orthomolecular Medicine, 15(2), 89-95. |
| [28] | The Environment (Protection) Rules 1986[online] Available on Internet: cpcb.nic.in/GeneralStandards.pdf |
| [29] | Brook, J.R., Samson, P. J., and Sillman, S., 1993, The relationship between upwind SO2 emissions and SO4 concentrations in precipitation at six sites in the eastern U.S.A., Atmospheric Environment. Part A. General Topics, 27(11), 1765-1779. |
| [30] | Larson, T.E., Corrosion phenomena causes and cures. In: Water quality and treatment’, A handbook of public water supplies. 3rd edition. New York, McGraw-Hill Publishing Co. 1971. |
| [31] | Swarzenski, C., Doyle, T., Fry, B., and Hargis, T., 2008, Biogeochemical response of organic-rich freshwater marshes in the Louisiana delta plain to chronic Creek water influx., Biogeochemistry, 90(1), 49–63. |
| [32] | Erskine, J.M., and Koch, M.S., 2000, Sulfide effects on Thalassia testudinum carbon balance and adenylate energy charge., Aquatic Botany, 67(4), 275- 285. |
| [33] | Azzoni, R., Giordani, C., Bartoli, M., Welsh, D.T., and Viaroli, P., 2001, Iron, sulphur and phosphorus cycling in the rhizosphere sediments of a eutrophic Ruppia cirrhosa meadow (Valle Smarlacca, Italy)., Journal of Sea Research 45(1), 15–26. |
| [34] | Geurts, J.J.M., Sarneel, J.M., Willers, B.J.C., Roelofs, J.G.M., Verhoeven, J.T.A., and Lamers, L.P.M., 2009, Interacting effects of sulfate pollution, sulfide toxicity and eutrophication on vegetation development in fens: A mesocosm experiment., Environmental Pollution 157(7), 2072–2081 |