-
Paper Information
- Next Paper
- Previous Paper
- Paper Submission
-
Journal Information
- About This Journal
- Editorial Board
- Current Issue
- Archive
- Author Guidelines
- Contact Us
Resources and Environment
p-ISSN: 2163-2618 e-ISSN: 2163-2634
2011; 1(1): 13-19
doi: 10.5923/j.re.20110101.02
Toxicity Study of Heavy Metals Pollutants in Waste Water Effluent Samples Collected from Taloja Industrial Estate of Mumbai, India
 Abstract
 Reference
 Full-Text PDF
 Full-Text HTML
Ram S. Lokhande 1, Pravin U. Singare 2, Deepali S. Pimple 3
1Department of Chemistry, University of Mumbai, Santacruz, Vidyanagari, Mumbai, 400 098, India
2Department of Chemistry, Bhavan’s College, Munshi Nagar, Andheri (West), Mumbai, 400058, India
3Department of Chemistry, R.J. College, Ghatkopar, Mumbai, 400 086, India
Correspondence to: Pravin U. Singare , Department of Chemistry, Bhavan’s College, Munshi Nagar, Andheri (West), Mumbai, 400058, India.
| Email: |  |
Copyright © 2012 Scientific & Academic Publishing. All Rights Reserved.
The present research work deals with the assessment of pollution due to toxic heavy metals in the industrial waste water effluents collected from Taloja industrial belt of Mumbai. The study reveals that dyes, paints, pharmaceutical and textile industries are some of the major industries contributing to the heavy metal pollutants in the surrounding aquatic environment. It was observed that paint manufacturing industries are the major contributors of toxic Cr, Zn and Pb amounting to 35.2, 33.1, and 31.4 mg/L respectively. It was also observed that major contribution of Cu (33.3 mg/L) was from dyes manufacturing units, while maximum Fe concentration of 12.8 mg/L was found in effluent samples released from textile industries. The concentration of Cd and Ni was found maximum in effluent samples collected from pharmaceutical industries amounting to 35.8 and 33.6 mg/L respectively. The overall results point out high concentration of toxic heavy metals in the effluent samples collected from different industries. These industrial effluents will pollute the near by water bodies affecting the growth of vegetation and aquatic life. These toxic heavy metals when released in aquatic environment will enter the food chain through bio-magnification causing various health problems in humans. The results of the present investigation point out the need to implement common objectives, compatible policies and programmes for improvement in the industrial waste water treatment methods.Keywords Industrial Effluent; Industrial Pollution; Toxic Heavy Metals; Quantification; AAS; Health Hazards; Water Pollution; Taloja Industrial Area; Mumbai
Keywords:
Cite this paper: Ram S. Lokhande , Pravin U. Singare , Deepali S. Pimple , "Toxicity Study of Heavy Metals Pollutants in Waste Water Effluent Samples Collected from Taloja Industrial Estate of Mumbai, India", Resources and Environment, Vol. 1 No. 1, 2011, pp. 13-19. doi: 10.5923/j.re.20110101.02.
Article Outline
1. Introduction
- During the past few decades Indian industries have registered a quantum jump, which has contributed to high economic growth but simultaneously it has also given rise to severe environmental pollution. Consequently, the water quality is seriously affected which is far lower in comparison to the international standards. Waste water from manufacturing or chemical processing industries contributes to water pollution. Industrial waste water usually contains specific and readily identifiable chemical compounds. It is found that one-third of the total water pollution comes in the form of effluent discharge, solid wastes and other hazardous wastes. Out of this a large portion can be traced to the processing of industrial chemicals and to the food products industry. The surface water is the main source of industries for waste disposal. Untreated or allegedly treated effluents have increase the level of surface water pollution up to 20 times the safe level in 22 critically polluted areas of the country. It is found that almost all rivers are polluted in most of the stretches by some industry or the other[1-3]. Although all industries in India function under the strict guidelines of the Central Pollution Control Board (CPCB) but still the environmental situation is far from satisfactory. Different norms and guidelines are given for all the industries depending upon their pollution potentials. Most major industries have treatment facilities for industrial effluents. But this is not the case with small scale industries, which cannot afford enormous investments in pollution control equipment as their profit margin is very slender. As a result in India there are sufficient evidences available related with the mismanagement of industrial wastes[4-8]. Most of these defaulting industries are petrochemical industries, sugar mills, distilleries, leather processing industries, paper mill, agrochemicals and pesticides manufacturing industries and pharmaceutical industries. Consequently, at the end of each time period the pollution problem takes menacing concern. The problem of water pollution has become still worse due to toxic heavy metals[9,10]. The increasing trend in concentration of heavy metals in the environment has attracted considerable attention amongst ecologists globally during the last decades and has also begun to cause concern in most of the major metropolitan cities. Untreated or allegedly treated industrial effluents and sewage water contains variable amounts of heavy metals such as arsenic, lead, nickel, cadmium, copper, mercury, zinc and chromium[11, 12], which have the potential to contaminate crops growing under such irrigation. These heavy metals have a marked effect on the aquatic flora and fauna which through bio-magnification enter the food chain and ultimately affect the human beings as well. Heavy metal pollution is an ever increasing problem of our oceans, lakes and rivers. Incidence of heavy metal accumulation in fish, oysters, sediments and other components of aquatic ecosystems have been reported globally[13-23]. These toxic heavy metals entering in aquatic environment are adsorbed onto particulate matter, although they can form free metal ions and soluble complexes that are available for uptake by biological organisms[23]. The metals associated with particulate material are also available for biological uptake[24], and are deposited in estuarine sediments[25]. Once deposited, bind- ing by sulfides and/or iron hydroxides immobilizes trace metals until a change in redox or pH occurs[18,19]. Thus, surfical sediments, particularly the fine fraction, accumulate trace metals and provide a means for evaluating the long term accumulation of contaminants[20, 21].The problem of environmental pollution due to heavy metals has begun to cause concern now in most of the major metropolitan cities in India and Mumbai is not an exception to it. The present day by day increasing tremendous industrial pollution[13-23] has prompted us to carry the systematic and detail study of pollution due to toxic heavy metals in soil samples collected from Taloja Industrial estate which is considered as one of the fastest developing industrial belt of Mumbai.
2. Materials and Methods
2.1. Area of Study
- The study was carried at the Taloja industrial area which is one of the most rapidly developing and heavily polluted industrial belts of Mumbai. The industrial area is spread over 863.18 hectares of land consisting of about 600 large and medium scale industries like engineering units, steel processing industries, chemical units, paints, pharmaceutical units, textile industries etc. The study area lies between latitude 19°3'39"N longitudes 73°6'57"E. The main water source for the industrial consumption is Maharashtra Industrial Development Corporation. The industrial area utilizes about 45,000 m3/day of fresh water. The effluent discharge, treated and untreated amounts to 28,750 m3/day i.e., 64% of the total industrial effluents. This has created health hazards not only for local population but also resulted in disturbances of aquatic life of the Kasardi River flowing near the industrial area[3].
2.2. Climatic Conditions
- The weather of the study area is typical coastal sultry and humid. The average rainfall records from 1,500 mm to 2,000 mm. The place experiences the onset of the monsoon in the month of June and experiences monsoon till the end of September. The average temperature recorded varies from 25 to 42 degrees.
2.3. Requirements
- All the glassware, casserole and other pipettes were first cleaned with tape water thoroughly and finally with de-ionized distilled water. The pipettes and burette were rinsed with solution before final use. The chemicals and reagent were used for analysis were of analytical reagent grade. The procedure for calculating the different parameters were conducted in the laboratory.
2.4. Sampling of Industrial Waste Water Effluent and Sample Preparation
- The industrial waste water effluent samples were collected randomly twice in a month in morning, afternoon and evening session from different industries like engineering industries, paper mills, fine chemical manufacturing industries, dyes industries, paint industries, pharmaceutical industries, petrochemical industries and textile industries of Taloja Industrial belt. For each type of industry three representative units was selected. The samples were collected every alternate month from February 1999 to November 2000. The sampling was done in three shifts i.e. morning shift between 07:00 a.m. to 09:00 a.m., afternoon shift between 02:00 p.m. to 04:00 p.m. and evening shift between 07:00 p.m. to 09:00 p.m. Polythene bottles of 2.5 L and 2.0 L were used to collect the grab water samples (number of samples collected, n = 19). The bottles were thoroughly cleaned with hydrochloric acid, washed with tape water to render free of acid, washed with distilled water twice, again rinsed with the water sample to be collected and then filled up the bottle with the sample leaving only a small air gap at the top. The sample bottles were stoppard and sealed with paraffin wax. Water samples (500 mL) were filtered using Whatman No. 41 (0.45 μm pore size) filter paper for estimation of dissolved metal content. Filtrate (500 mL) was preserved with 2 mL nitric acid to prevent the precipitation of metals. The samples were concentrated to tenfold on a water bath and subjected to nitric acid digestion using the microwave-assisted technique, setting pressure at 30 bars and power at 700 Watts[26,27].
2.5. Heavy Metal Analysis by AAS Technique
- The analysis for the majority of the trace metals like chromium (Cr), cadmium (Cd), nickel (Ni), zinc (Zn), copper (Cu), lead (Pb) and iron (Fe) was done by Perkin- Elmer ASS-280 Flame Atomic Absorption Spectroph-otometer. The calibration curves were prepared separately for all the metals by running different concentrations of standard solutions. A reagent blank sample was analyzed and subtracted from the samples to correct for reagent impurities and other sources of errors from the environment. Average values of three replicates were taken for each determination.
3. Results and Discussion
- The experimental data on heavy metal content in waste water effluent samples collected from different industries of Taloja industrial estate of Mumbai for the assessment years 1999 and 2000 is presented in Tables 1 and 2. The two years (biyearly) average values of heavy metal content in mg/L for different industries are graphically represented in Figure 1.A number of elements are normally present in relatively low concentrations, usually less than a few mg/L, in conventional irrigation waters and are called trace elements. Heavy metals are a special group of trace elements which have been shown to create definite health hazards when taken up by plants. Under this group are included, Cr, Cd, Ni, Zn, Cu, Pb and Fe. These are called heavy metals because in their metallic form, their densities are greater than 4 g/cc. The biyearly average Cr content in waste water samples was found to be minimum of 16.9 mg/L in effluent samples collected from dyes industries and maximum of 35.2 mg/L in effluent samples collected from paint industries (Figure 1), which was very much higher than the permissible limit of 0.05 mg/L set by WHO[28]. Cr compounds are used as pigments, mordents and dyes in the textiles and as a tanning agent in the leather. The experimental data indicates that paint manufacturing industries are the major source for release of toxic Cr metal in surrounding aquatic environment. Acute toxicity of Cr to invertebrates is highly variable, depending upon species[29]. For invertebrates and fishes, its toxicity is not much acute. Cr is generally more toxic at higher temperatures and its compounds are known to cause cancer in humans[30]. The toxic effect of Cr on plants indicate that the roots remain small and the leaves narrow, exhibit reddish brown discoloration with small necrotic blotches[31].Cd is contributed to the surface waters through paints, pigments, glass enamel, deterioration of the galvanized pipes etc. The biyearly average Cd content in water samples was found to be minimum of 23.3 mg/L and 23.8 mg/L in the effluent samples collected from dyes and paper mill industries respectively, while maximum Cd content was found to be 35.8 mg/L in the effluent samples collected from pharmaceutical industries. The second largest contribution (32.8 mg/L) of Cd metal was due to the effluent from paint manufacturing industries (Figure 1). The experimental values indicate that pharmaceutical and paint manufacturing industries are the major source for release of toxic Cd in the surrounding water bodies. The values obtained were found to be extremely higher than the permissible limit of 0.01 mg/L set by WHO[32] and also according to USPH standards. There are a few recorded instances of Cd poisoning in human beings following consumption of contaminated fishes. It is less toxic to plants than Cu, similar in toxicity to Pb and Cr. It is equally toxic to invertebrates and fishes[29].
| |||||||||||||||||||||||||||||||||||||||||||||||||||||||||||||||||||||||||||||||||||||||||||||||||||||||||||||||||||||||||||||||||||||||||||||||||||||||||||||||||||||||||||||||||||||||||||||||||||||||||||||||||||||||||||||||||||||||||||||||||||||||||||||||||||||||||||||||||||||||||||||||||||||||||||||||||||||||||||||||||||||||||||||||||||||||||||||||||||||||||||||||||||||||||||||||||||||||||||||||||||||||||||||||||||||||||||||||||||||||||||||||||||||||||
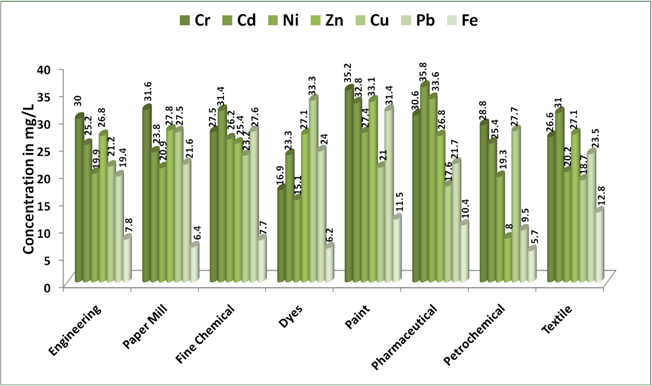 | Figure 1. Average variation in Heavy metal content in the waste water effluents released from different industries of Taloja Industrial Estate of Mumbai for the Assessment years 1999-2000. |
4. Conclusions
- Around the world as countries are struggling to arrive at an effective regulatory regime to control the discharge of industrial effluents into their ecosystems, Indian economy holds a double edged sword of economic growth and ecosystem collapse. The present experimental data indicates high level of pollution along Taloja Industrial estate of Mumbai, India. The experimental data suggests a need to implement common objectives, compatible policies and programmes for improvement in the industrial waste water treatment methods. It also suggests a need of consistent, internationally recognized data driven strategy to assess the quality of waste water effluent and generation of international standards for evaluation of contamination levels. The existing situation if mishandled can cause irreparable ecological harm in the long-term well masked by short term economic prosperity.
ACKNOWLEDGEMENTS
- The authors are extremely thankful to SAP Productions for developing and maintaining the manuscript template.
References
| [1] | Modak, D.M., Singh, K.P., Ahmed, S., and Ray, P.K., 1990, Trace metal ion in Ganga water system, Chemosphere, 21(1-2), 275-287 |
| [2] | M.D. Zingde, K. Govindan, Health status of coastal waters of Mumbai and regions around. In: Environmental Problems of Coastal Areas in India (ed. V.K.Sharma), Bookwell Publishers., New Delhi, pp. 119–132 (2001) |
| [3] | Lokhande, R.S., Singare, P.U., and Pimple, D.S., 2011, Quantification Study of Toxic Heavy Metals Pollutants in Sediment Samples Collected from Kasardi River Flowing along the Taloja Industrial Area of Mumbai, India, The New York Science Journal 4(9), 66-71 |
| [4] | Rajaram, T., and Das, A., 2008, Water pollution by industrial effluents in India: discharge scenarios and case for participatory ecosystem specific local regulation, Futures, 40(1), 56-69 |
| [5] | Khurshid, S., Abdul, B., Zaheeruddin, A., and Usman, S.M., 1998, Effect of waste disposal on water quality in parts of Cochin, Kerala, Indian J.Environ.Health, 40(1), 45-50 |
| [6] | Pachpande, B.G., and Ingle, S.T., 2004, Recovery of the Chromium by chemical precipitation from tannery effluent, Orient J. Chem.20 (1), 117-123 |
| [7] | Prabha, S., and Selvapathy, P., 1997, Heavy metal pollution in Indian Rivers., Indian J. Environ. Prot., 17(6), 641-649 |
| [8] | Singare, P.U., Lokhande, R.S., and Pathak, P.P., (2010), Study on Physico-Chemical properties and Heavy Metal Content of the Soil Samples from Thane Creek of Maharashtra, India, Interdisciplinary Environmental Review, 11(1), 38-56 |
| [9] | Lokhande, R.S., and Kelkar, N., 1999, Studies on heavy metals in water of Vasai Creek, Maharashtra, Indian J. Environ. Protect, 19(9), 664-668 |
| [10] | Pokhrel, D., Bhandari, B.S., and Viraraghavan, T., 2009, Arsenic contamination of groundwater in the Terai region of Nepal: an overview of health concerns and treatment options, Environment International, 35(1), 157-161 |
| [11] | Sharma, R.K., Agrawal, M., and Marshall, F.M., 2004, Effects of waste water irrigation on heavy metal accumulation in soil and plants., Paper presented at a National Seminar, Bangalore University, Bangalore, Abst. no. 7, pp. 8 |
| [12] | Singare, P.U., Lokhande, R.S. and Naik, K.U., 2010, A Case Study of Some Lakes Located at and Around Thane City of Maharashtra, India, with Special Reference to Physico-Chemical Properties and Heavy Metal content of Lake Water., Interdisciplinary EnvironmentalReview, 11(1), 90-107. |
| [13] | A. Aghor. Chemicals make Thane creek the worst pollutedwaterbody. Daily DNA. August 14, 2007. Mumbai, India |
| [14] | [online]Available:http://www.dnaindia.com/mumbai/report_chemicals-make-thane-creek-the-worst-polluted-waterbody_1115439 |
| [15] | D. Patil, ‘A lot's fishy about our creek and lake fish’. DailyTimes of India. March 22, 2009. Mumbai, India. [Online].Available:http://timesofindia.indiatimes.com/city/thane/A-lots-fishy-about-our-creek-and-lake-fish/articleshow/4298566.cms |
| [16] | Singare, P.U., Lokhande, R.S., and Jagtap, A.G., 2011, Water pollution by discharge effluents from Gove Industrial Area of Maharashtra, India: Dispersion of heavy metals and their Toxic effects, International Journal of Global Environmental Issues, 11(01), 28-36 |
| [17] | P.U.Singare, Heavy metal -- in and around the lakes- Pollution due to toxic heavy metals at the Jail Talav and Kalwa Lakes of Thane City, EurekAlert!-Atmospheric Science – Sunday, August7,2011 |
| [18] | [Online].Available:http://www.worldweatherpost.com/2011/08/07/india-heavy-metal-in-and-around-the-lakes/ |
| [19] | P.U.Singare, Thane lakes high on metal content: Study, Daily Times of India. August 10, 2011. Mumbai, India. [Online].Available:http://timesofindia.indiatimes.com/city/mumbai/Thane-lakes-high-on-metal-contentStudy/articleshow/9547159.cms |
| [20] | Adams, W.J., Kimerle, R.A., and Barnett J.W., Jr, 1992, Sediment quality: and aquatic life assessment, Environ. Sci. Technol., 26(10), 1864-1875 |
| [21] | Maher, W., Batley, G.E., and Lawrence,I., 1999, Assessing The health of sediment ecosystems: use of chemical measurements., Freshw Biol., 41(2), 361-372 |
| [22] | Kennicutt, M.C., Wade, T.L., Presley, B.J., Requejo, A.G., Brooks, J.M., and Denoux, G.J., 1994, Sediment contaminants in Casci Bay, Maine: inventories, sources and potential for biological impacts, Environ. Sci. Technol. 28(1), 1-15 |
| [23] | Singare, P.U., Lokhande, R.S., and Pathak, P.P., 2010, Soil Pollution along Kalwa Bridge at Thane Creek of Maharashtra, India., J. Environmental Protection, 1(1), 121-128 |
| [24] | Johansson, J., and Rasmussen, L., 1977, Retrospective study (1944–1976) of heavy metals in the epiphyte Pterogonium gracile collected from one phorophyte., Bryologist, 80(3), 625-629 |
| [25] | W. Salomons, U. Forstner, ‘Metals in the Hydrocycle’, Springer-Verlag, New York (1984) |
| [26] | Lee, B.G., Griscom, S.B., Lee, J.S., Choi, H.J., Koh, C.H, Luoma, S.N., and Fisher, N.S., 2000, Influence of dietary uptake and reactive sulfides on metal availability from aquatic sediments, Science, 287(5451), 282-284 |
| [27] | Weston, D.P., and Maraya, K.A., 2002, Predicting bioavailability and bioaccumulation with in vitro digestive fluid extraction, Environ Toxicol. Chem., 21(5), 962-967 |
| [28] | L.S. Clesceri, ‘Standard methods for the examination of Water and waste water’, in E. Arnold, Greenbergy, A.D.Eaton,(Eds.): Collection and Preservation of Samples And Metals, pp.1–27, pp.1–35, pp.3–1, pp.3–21, APHA, AWWA, WEF, Washington DC (1998) |
| [29] | A. Paar, ‘Microwave Sample Preparation System’ –Instruction Handbook, p.128, Anton Paar GmbH, Austria (1998) |
| [30] | A.K. De, Environmental Chemistry, pp.232–272, 4th ed., New Age International (P)Ltd., New Delhi, India (2002) |
| [31] | J.W. Moore, S. Ramamoorthy, Heavy Metals in Natural Waters: Applied Monitoring and Impact Assessment, pp.28–246, Springer-Verlag, New York (1984) |
| [32] | Ember, L., 1975, the spectra of cancer, Environ. Sci.Tech., 9(13), 1116-1121 |
| [33] | Centre for Ecological Sciences, IISc Environmental Hand Book – Documentation on Monitoring and Evaluating Environmental Impacts, Compendium of Environmental Standards, Vol. 3, Indian Institute of Science, Bangalore, (2001).Available:http://wgbis.ces.iisc.ernet.in/energy/HC 270799/HDL/ENV/START.HTM |
| [34] | P.S. Sindhu, Environmental Chemistry, pp.75–243, 1st ed.,New Age International (P) Ltd.,New Delhi (2002) |
| [35] | N.S. Tiwana, N. Jerath, G. Singh, M. Ravleen, (Eds.) ‘Heavy metal pollution in Punjab rivers’, in Newsletter Environmental Information System (ENVIS), Vol. 3, No. 1, pp.3–7, Punjab State Council for Science and Technology, India (2005) |
| [36] | Sunderman, F.W., 1959, Nickel poisoining carcinogenesis in rats exposed to nickel carbonyl, Arch. Ind., 20(1), 36-41 |
| [37] | American Public Health Association (APHA) Standard Methods for Estimation of Water and Wastewater, 19th ed., American Water Works Association, Water environment Federation, Washington (1995) |