Ibidunni S. Adetiloye1, Omolayo J. Ariyo2, Olabisi Alamu1, Sunday O. Osewa1
1National Centre for Genetic Resources and Biotechnology (NACGRAB), Moor Plantation, Ibadan, Nigeria
2Department of Plant Breeding and Seed Technology, Federal University of Agriculture (FUNAAB), Alabata Road, Abeokuta, Nigeria
Correspondence to: Ibidunni S. Adetiloye, National Centre for Genetic Resources and Biotechnology (NACGRAB), Moor Plantation, Ibadan, Nigeria.
| Email: |  |
Copyright © 2020 The Author(s). Published by Scientific & Academic Publishing.
This work is licensed under the Creative Commons Attribution International License (CC BY).
http://creativecommons.org/licenses/by/4.0/

Abstract
Nigeria is the largest producer of soya bean in sub-Sahara Africa, there is however paucity of information on genetic diversity available for the crop's improvement. Forty-three accessions of soya bean were evaluated to assess diversity. Variation among the accessions were analyzed from thirteen agro-morphological characters using Principal Component Analysis (PCA) during the late cropping season of 2015. The experiment was conducted at the Research Farm of the National Center for Genetic Resources and Biotechnology, Ibadan. The first four principal components (PC) accounted for 70% of the total variation, while the first and second PC contributed 27% and 22% respectively. Characters found in PC1 accounted for most of the observed variation. High heritability and genetic advance estimates were recorded for most of the traits and the 43 accessions were assigned to nine distinct clusters by FASTCLUS indicative of wide genetic diversity. Configuration of PC1 and PC2 indicated that TGm-868 and TGm-863 were most distinct and can be utilized as parents for hybridization.
Keywords:
Diversity, Hybridisation, Variation, Soyabean, Improvement
Cite this paper: Ibidunni S. Adetiloye, Omolayo J. Ariyo, Olabisi Alamu, Sunday O. Osewa, Agronomic Potential and Genetic Diversity of 43 Accession of Tropical Soybean (Glycine max (L) Merrill), International Journal of Plant Research, Vol. 10 No. 2, 2020, pp. 33-39. doi: 10.5923/j.plant.20201002.02.
1. Introduction
Soya bean (Glycine max) belongs to genus Glycine in the family Fabaceae, a member of the tribe Phaseoleae. It originated in China as a food crop over 3000 years ago [8]. The crop has been described as a “miracle bean” while others call it “golden bean” because it is a cheap protein-rich grain. Nutritionally, it contains about 20% edible oil and 40% crude protein with a good balance of essential amino acids. The success or failure of any crop breeding programme depends largely on the amount of genetic variability present in the breeding materials. It is essential to properly characterize and evaluate the available germplasm. Diversity in germplasms is an important prerequisite for hybridization program. [13] suggested that evaluation of genetic diversity would promote the efficient use of genetic variations in the breeding program. Numerous studies have explored the significance of phenotypic characterisation in estimating diversity in soya bean [6] Also, using 52 morphological and agronomic characters, [3] found variability for the traits studied in soya bean. In another study involving phenotypic characterisation of 139 soya bean genotypes [9], revealed significant differences among all the assessed traits. Therefore, the main objectives of this study was to determine genetic diversity among 43 soya bean accessions collected from some parts of the world.
2. Materials and Methods
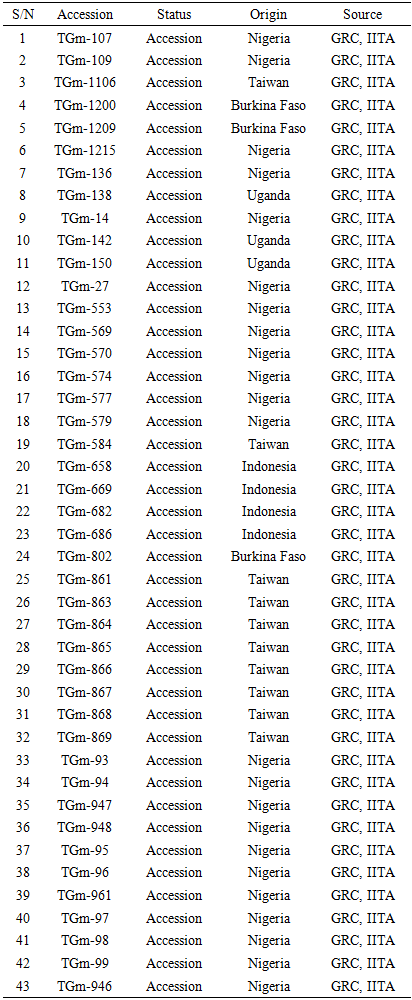
The field trial was conducted at National Center for Genetic Resources and Biotechnology (NACGRAB), Moor Plantation, Ibadan, Nigeria. The experimental field was disc ploughed and harrowed. All the 43 accessions were planted in the 2nd week of August, 2015 using randomized complete block design. Single row plot measuring 2 meters (2m) long with inter row spacing of 0.6m and intra row spacing of 5cm with three replications were used. The blocks were separated with one meter (1m) alley. Two seeds were planted per hole and later thinned to one plant per hole at 2 weeks after planting (WAP) with each row now containing 40 plants. Weeds were controlled manually at 3 and 6 weeks after planting. NPK 15-15-15 at the rate of 30kg/ha was applied as basal fertilizer.Data on agronomic and morphological characters were collected from 10 randomly selected inner competitive plants within each plot and their means were recorded for data analysis.The following thirteen (13) agronomic/morphological characters were observed according to the descriptors of Bioversity International for soya bean. X50.DF:-Number of days to 50% flowering, PHTMAT:- Plant height at maturity, NDPLTM:-Number of days to plant maturity, NPD.PLT:- Number of pods per plant, NS.PD:- Number of seeds per pod, X100SW:- Weight of 100 seeds, SDLGT:- Seed Length, SDWIDTH:- Seed width, SDTHICK:- Seed thickness, NPB.PLT, Number of primary branches, NPD.ND:- Number of pods per node, PDLGT: Pod length, and YIELD.PLT: Yield per plant.Table 1. The source and origin of 43 germplasm of soya bean used in this study
 |
| |
|
Data from the 13 traits from the 43 accessions were subjected to Variance and Ccovariance analysis using SAS/PC version 9.1 [15]. The principal component analysis (PCA) was applied to catalogue the variation in the 43 accessions of soya bean. The accessions were also sorted into distinct clusters by the FASTCLUS procedure. The relationships among the accessions were used to draw a dendogram of the genetic variation by single linkage cluster analysis (SLCA) procedure. The variance of components were used to compute the genotypic coefficient of variation (GCV), phenotypic coefficients of variation (PCV), heritability and genetic advance [5] and [11].
3. Results and Discussions
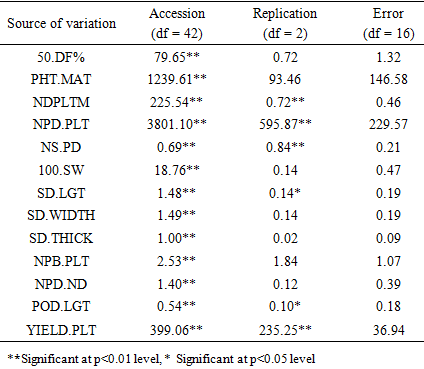
There was significant differences (p<0.01) for all the 13 quantitative characters studied in terms of genotypic effect (Table 2). This reveals evidence of differences among the genotypes studied, therefore, there is possibility of genetic gains in selection.Table 2. Mean squares from performances of 43 soya bean accessions in 2015 planting season
 |
| |
|
As genotypic coefficient of variation (GCV) represents the heritable genetic component of the total variation, it would be more appropriate to use this parameter for comparing variability of different characters. There was narrow differences between phenotypic and genotypic coefficient of variations (PCV and GCV) indicating that these traits might have low interaction with the environments (Table 3). This result was in line with the views of [16] that little differences between values at genotypic and phenotypic levels suggest low environmental effects. The high magnitude of both coefficients (PCV AND GCV) recorded for plant height at maturity and number of pods per plant indicated the presence of substantial amount of genetic variability for the traits and indicated that selection based on the concerned characters may be a good approach for enhancing seed yield in soya bean. In agreement with the present findings were the results of [14] and [17].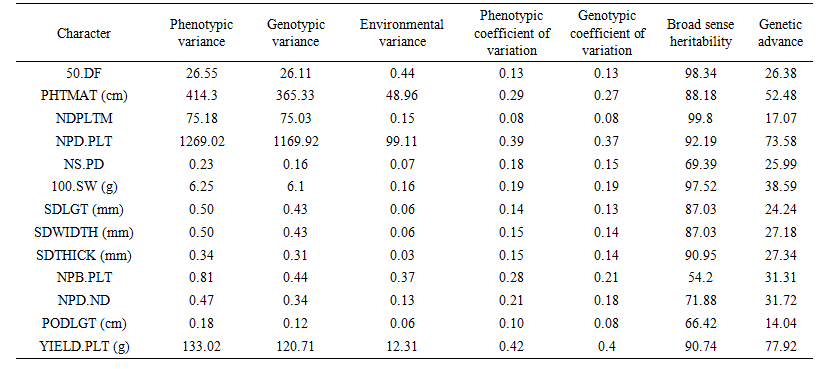 | Table 3. Phenotypic, genotypic and environmental variances; phenotypic and genotypic coefficient of variability; heritability and genetic advance for thirteen soya bean traits in 2015 growing season |
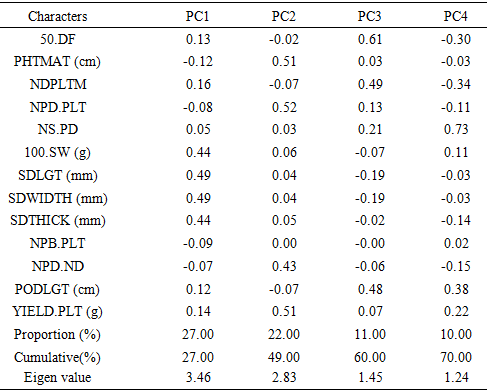
In predicting the effective genetic gain and selection for the improvement of yield traits, considering heritability and genetic advance simultaneously has been found more helpful. Heritability estimates have been broadly classified into low (below 50%), medium (50% and 70%) and high (above 70%) and genetic advance estimates classified into low (below 20%); medium (20-30%) and high (above 30%) in order to draw conclusions about these parameters [1]. High heritability with high genetic advance recorded for plant height at maturity, number of days to maturity, hundred seed weight, number of pods per node and seed yield per plant might be attributed to additive gene action responsible for their expression and thereby indicating that selection for these characters would be effective and can be improved through simple selection procedures. These findings are in agreement with the results of [7] who reported high heritability and genetic advance for these traits in soya bean. The first four PCA's extracted had eigen values higher than one and accounted for about 70% of the total variation (Table 4). Each principal component (PC) is separately loaded with various yield and yield attributing traits under study. Similar results were obtained by [9] who reported that first three components accounted for 69.77% in soya bean. In a similar regard, [2] observed 66.1% of the total variance coming from three principal components. The result observed in each PC indicated that maximum variation was found in the first PC, therefore selection for characters under first PCA would be more beneficial. Table 4. Principal Component Analysis (PCA) of characters associated with 43 soya bean accessions and the first four PC axes
 |
| |
|
Principal component analysis was also used to visualize the dispersion of accessions based on the seed yield and origin of the accessions as presented in Figure 1. The configuration of the 43 soya bean accessions on principal axes 1 and 2 revealed that accession TGm-868 from Taiwan was the most distant from other accession followed by TGm-863 and and TGm-574 from Nigeria. All other accession clustered into three distinct groups. The widespread distribution shown by scatter plot clearly demonstrated wide diversity among the accessions. 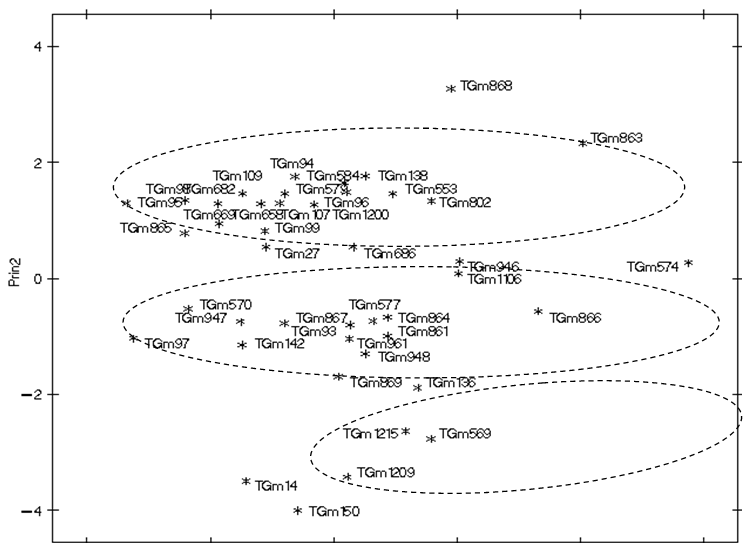 | Figure 1. Configuration of the 43 soya bean accessions under PCA1 and PCA2 |
The 43 accessions were assigned to nine distinct clusters by FASTCLUS, indicative of wide genetic diversity. These findings are in agreement with the reports given by [12] and [6] who found six cluster groups among 45 genotypes of soya bean and [10] who reported nine distinct clusters in 43 accessions of soya bean. Cluster I contained the largest number of accessions (10) followed by cluster V with nine accessions implying high genetic resemblance among the members of these cluster groups consequently reduced variability. Among the various clusters observed, clusters III consisted only one accession symbolising that this accession is dissimilar to other accessions. These grouping patterns present an excellent opportunity for breeders to make better choices when making selection. In a similar manner, [4] reported that crosses made between two divergent clusters maximize variability for subsequent selection relative to within cluster mattings.The dendogram differentiated the high yielding and low yielding accessions into groups and sub-groups. The dendogram based on seed yield and other studied traits resulted into four main groups (A, B, C and D) that can be clearly seen at 40% level of similarity (Figure 2). Group A comprised of thirty seven accessions. However, there was one accession in group B (TGm-868), Group C had two accessions (TGm-136 and TGm-569) while Group D contained three accessions (TGm-1209, TGm-150 and TGm-14). 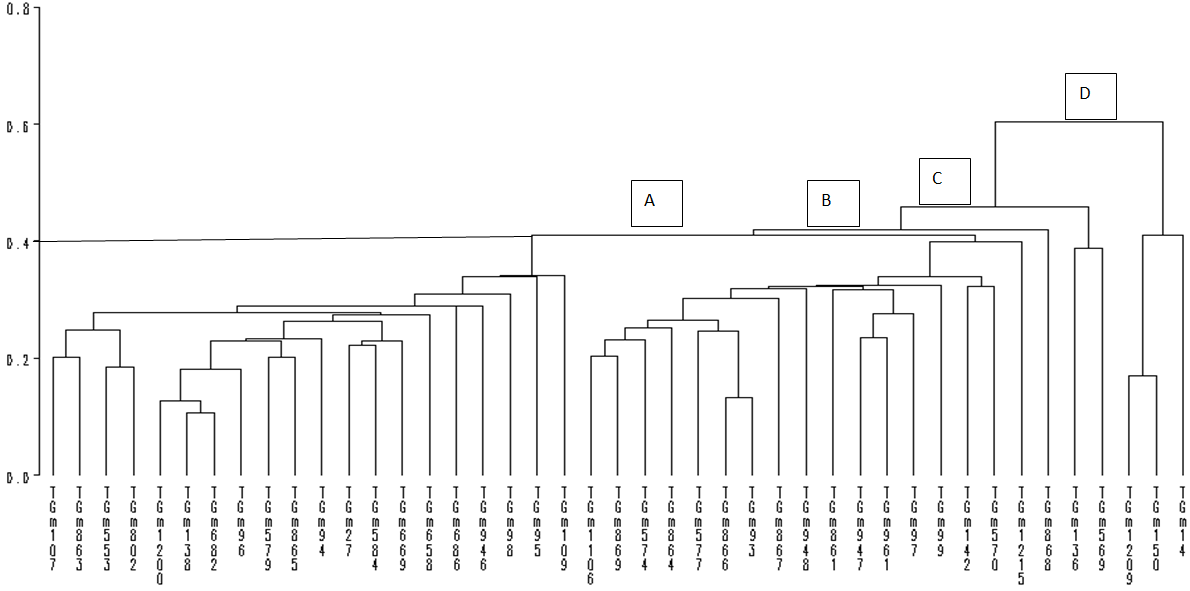 | Figure 2. Dendrogram from single linkage cluster analysis (SLCA) of the 43 soya bean accessions evaluated during 2015 growing season |
The clustering pattern revealed that genetic diversity was not necessarily associated with geographical diversity in soya bean. 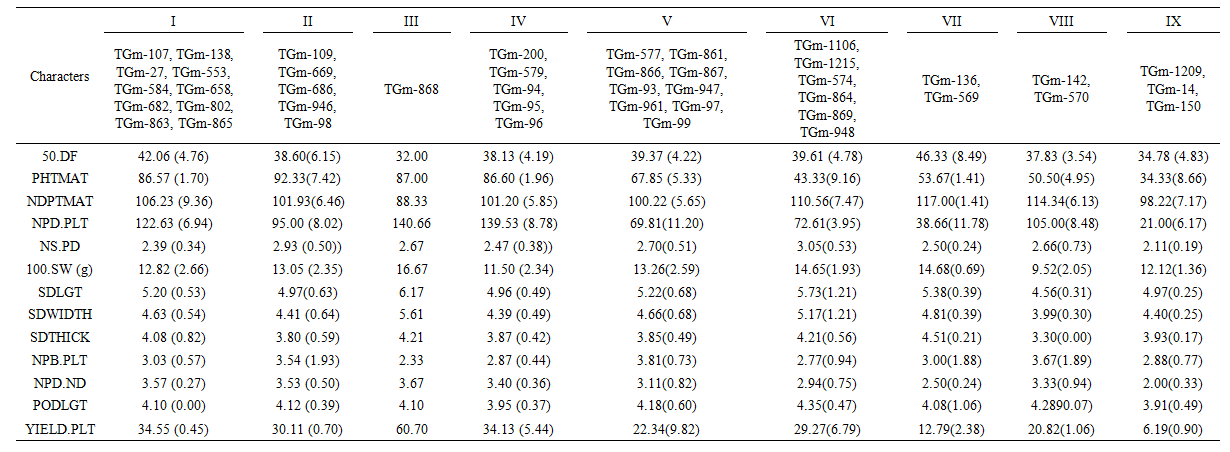 | Table 5. The nine clusters of 43 Soya bean accessions with their means and standard deviation in parenthesis |
4. Conclusions
Sufficient genetic variability was obtained for all the traits studied in this work and this suggested that hybridization involving diverse parents is possible in soya bean.
ACKNOWLEDGEMENTS
The authors are grateful to the Genetic Resources Center, International Institute of Tropical Agriculture, Ibadan for providing germplasm for the study.
References
| [1] | Aditya J. P., Bhartiya P. and Bhartiya A. 2011. Genetic variability, heritability and character association for yield and component characters in soya bean [G. max (L.) Merrill]. Journal of Central European Agriculture 12:27-34. |
| [2] | Anna durai A. 2005. Genetic diversity, diallel analysis and induced mutagenesis in soya bean [Glycine max (l.) Merrill] M.Sc (Agri) Thesis. Tamilnadu Agricultural University. Coimbatore. |
| [3] | Antalikova G., Zakova M. and Benedikova D. 2008. Characterisation of soya bean traits variability by cluster analysis. Agriculture 54:45-53. |
| [4] | Benesi I. R. M., 2005. Characterization of Malawian cassava germplasm for diversity, starch extraction and its native and modified properties. Ph.D. Thesis, University of the Free State, Bloemfontein, South Africa. |
| [5] | Burton G. W. 1952. Quantitative inheritance in pearl millet (Pennisetum glaucum). Agro. J. 43: 409-417. |
| [6] | Dayaman V., Senthil N., Raveendran M., Nadarajan N., Shanmugasundaram P. and Balasubramanian P. 2009. Diversity analysis in selected indian soya bean [Glycine max (L.) Merrill] using morphological and SSR markers. International Journal of Intergrative Biology 5:125-129. |
| [7] | Ghatge R. D. and Kadu R. N. 1993. Genetic diversity in soya bean. Annal Agric. Res., 14: 143-148. |
| [8] | Hymowitz T. and Singh R. J. 1987. Taxonomy and Speciation .In J. R. Wilcox (ed), soya beans: Improvement, Production and uses, 2nd edn. Agronomy monograph 16: 23–48. |
| [9] | Iqbal Z., Arshad M., Ashraf M., Mahmood T. and Waheed A. 2008. Evaluation of soya bean [Glycine max (L.) Merrill] germplasm for some important morphological traits using multivariate analysis. Pakistan Journal of Botany 40: 2323-2328. |
| [10] | Mehetre S. S., Mahajan C. R., Patil P. A., and Gohatage R. D. 1994. Genotypic and phenotypic variability and heritability of some quantitative characters in soya bean (Glycine max L.). Annals of Agricultural Research. 15 (1), 41-44. |
| [11] | Miller P. A., Williams J. C., Robinson H. F. and Comstock R. E. 1958. Estimates of genotypic and environmental variances and covariances in upland cotton and their implication in selection. Agron. J. Hort. 50: 124-131. |
| [12] | Ojo D. K., Ajayi A. O. and Oduwaye. O. A. 2012. Genetic Relationships among soya bean accessions based on morphological and RAPDs techniques. Pertanika Journal of Tropical Agricultural Science. 35:237-248. |
| [13] | Paterson A. H., Tanksley S. D. and Sorrells S. M. 1991. DNA markers in plant improvement. Advances in Agronomy 46: 39-90. |
| [14] | Ramgiry S. R. 1998. Genetic divergence in soya bean. Madras Agricultural Journal, 85(3/4): 167-170. |
| [15] | SAS Institute Inc. 2002. Statistic Analysis System. Version 9.1 SAS Institute Inc. Cary. NC, USA. |
| [16] | Shivakumar M., Basavaraja G. T., Salimath P. M., Patil P. V. and Talukdar A. 2011. Identification of rust resistant lines and their genetic variability and character association studies in soya bean [Glycine max (L.) Merr.]. Indian Journal of Genetics 71(3): 235-40. |
| [17] | Sirohi S. P. S., Sanjai M., Singh S. P. and Ramasharya Y. 2007. Genetic variability, correlation and path coefficient analysis for seed yield and its components in soya bean [Glycine max (L.) Merrill]. Progressive Agriculture 7:119-123. |

 Abstract
 Reference
 Full-Text PDF
 Full-text HTML