-
Paper Information
- Paper Submission
-
Journal Information
- About This Journal
- Editorial Board
- Current Issue
- Archive
- Author Guidelines
- Contact Us
International Journal of Plant Research
p-ISSN: 2163-2596 e-ISSN: 2163-260X
2017; 7(2): 48-57
doi:10.5923/j.plant.20170702.04

Estimates of Genetic Variation among Drought Tolerant Traits of Cowpea at Seedling Stage
 Abstract
 Reference
 Full-Text PDF
 Full-text HTML
Abiola Toyin Ajayi1, Victor Olugbenga Olumekun1, Alaba Emmanuel Gbadamosi2
1Department of Plant Science and Biotechnology, Adekunle Ajasin University, Akungba-Akoko, Nigeria
2Department of Forestry, Faculty of Agriculture, Adekunle Ajasin University, Akungba-Akoko, Nigeria
Correspondence to: Abiola Toyin Ajayi, Department of Plant Science and Biotechnology, Adekunle Ajasin University, Akungba-Akoko, Nigeria.
| Email: |  |
Copyright © 2017 Scientific & Academic Publishing. All Rights Reserved.
This work is licensed under the Creative Commons Attribution International License (CC BY).
http://creativecommons.org/licenses/by/4.0/

This study was conducted to estimate the genetic variability, heritability and genetic advance as percent of means among the traits conferring drought tolerance in cowpea at seedling stage and to examine the relationships among these traits for effective selection of drought tolerant cowpea. Ten (10) accessions of cowpea received from the International Institute of Tropical Agriculture (IITA), Nigeria were screened for drought tolerance at the seedling stage in the screen house between February and April, 2016. Drought was imposed on seedlings at 16th day after sowing for 21 days. Data recorded were wilting parameters [which included drought susceptibility score (DSS) using wilting scales and percentage permanent wilting (PPW)], morphological parameters, stomata conductance and recovery parameters [stem re-growth (STR), stem greenness (STG) and percentage recovery (PREC) after commencement of watering for 14 days]. Almost all traits exhibited moderate to high heritability among the accessions studied under drought stress. Wilting parameters like DSS7, stomata conductance and morphological traits (PH7) showing high heritability coupled with high GAM under drought stress suggest that direct selection for drought tolerance could be made based on these traits. All significantly correlated characters to the wilting and recovery parameters will also make selection under drought stress effective.
Keywords: Cowpea, Drought tolerance, Genotypic and phenotypic correlations, Heritability
Cite this paper: Abiola Toyin Ajayi, Victor Olugbenga Olumekun, Alaba Emmanuel Gbadamosi, Estimates of Genetic Variation among Drought Tolerant Traits of Cowpea at Seedling Stage, International Journal of Plant Research, Vol. 7 No. 2, 2017, pp. 48-57. doi: 10.5923/j.plant.20170702.04.
Article Outline
1. Introduction
- Cowpea is as an essential grain legume in the tropical and subtropical regions of the world [1]. Cowpea is high in protein content (20 - 25%) and has a great capacity at fixing atmospheric nitrogen in soil [2, 3]. For these reasons, it is very popular among the poor of both rural and urban people of the tropics and subtropics. One of the major challenges limiting the production of the crop is drought, which has been shown to reduce yield significantly in cowpea [4]. Drought, a multilateral stress affecting plants at various stages of growth and metabolic process [5], has been a major concern to breeders and plant scientists. Duration, degree and developmental stage of drought occurrence in plant reveal the severity of drought on growth and yield of such plant [6, 5]. Drought has been found to affect several quantitative traits in plants [7-10] with its effect more damaging when coincides with germination, seedling shoot growth, root elongation and flowering [11, 12]. In cowpea, information is limited on the genetic variability and heritability of traits expressed under drought stress. Therefore, for successful breeding of cowpea varieties tolerant to drought, adequate information concerning the amount of genetic variability existing among genotypes as regards drought stress must be made available to breeders. Thus, genetic variation for drought tolerance is an essential prerequisite for the development of more tolerant varieties [13]. Success for breeding under drought stress condition is limited, but an identification and analysis of plant traits with sound and positive association with drought is necessary [14]. Breeding improved genotypes by solely selecting for seed yield under drought is difficult [15] because of the variations in amount and temporal distribution of available moisture from year to year, and also, genotypic variations in yield are low and slow [16] under this condition. Better drought tolerant varieties could be bred if traits that confer yield under drought conditions could be identified and used as selection criteria at the early stages of breeding programmes [15]. Several traits that contribute to yield under drought conditions have been exploited in cowpea [17-28]. A thorough knowledge regarding the amount of genetic variability existing in cowpea for these traits is very important. In crop species, phenotypes are controlled mainly by genetic makeup of such crops coupled with the kinds of environment where they exist as well as the interactions between the genotypes and environment [29]. It is therefore necessary to partition the observed phenotypic variability into heritable and non-heritable components based on suitable parameters, such as phenotypic and genotypic coefficient of variation, heritability and genetic advance. These parameters are in fact very important in improving traits [29]. Several workers have calculated genotypic, phenotypic components of variance and heritability for different traits in several crops under drought stress. These traits include plant height and stem diameter in maize [5]; relative water content, stomata conductance and flowering in cowpea [26]; leaf and root parameters in peanut [30]; root architecture in maize [31]; shoot and yield parameters in lupin [32]; growth and physiological traits in wheat [33]. They have all revealed that selection was effective for population with broad genetic variability and traits with high heritability. Correlation of traits under drought condition will also help to simultaneously select for more than one trait of importance at a time. Since there is need for a method to understand the genetics and evolution of groups of traits simultaneously, breeders use phenotypic, genotypic and environmental correlations among traits. Phenotypic correlation measures the degree to which two traits covary among individuals in a population; variance in one is related to variance in the other if two traits covary. The phenotypic correlation is made up of genetic correlation and environmental correlations. Genetic correlation estimates the degree to which two traits are affected by a gene or group of genes while environmental correlation deals with the effect of the environment on traits. Genetic correlation is of great significance and could be effectively utilized in formulating an effective selection scheme [34]. Several workers have also correlated traits under drought stress, and these traits include plant height, relative water content, leaf parameters and yield parameters in spring wheat [35]; leaf and root parameters in peanut [30]; leaf traits and physiological parameters in sorghum [14]; grain yield and drought selection indices in cowpea [36]; wilting parameters, recovery parameters and yield traits in common bean [37]; days to flower and yield parameters in cowpea [38].Screening of accessions in pots at seedling stage is a viable and effective means of identifying drought tolerant varieties as confirmed by Watanabe et al. [19] who asserted that the phenomenon conferring seedling drought tolerance is also manifested at the flowering stage. The setup is easy under a controlled environment; and adaptable for screening a large number of genotypes [23].Hence, this study was conducted with the following objectives:i. To estimate the genetic variability, heritability and genetic advance as percent of means among the traits conferring drought tolerance in cowpea at seedling stageii. To examine the relationships among these traits for effective selection of drought tolerant cowpea
2. Materials and Methods
- Ten (10) cowpea accessions (TVu-199, TVu-207, TVu-218, TVu-235, TVu-236, TVu-241, IT98K-205-8, IT98K-555-1, TVu-4886 and TVu-9256) used in this study were collected from International Institute of Tropical Agriculture (IITA) Ibadan. The ten (10) accessions were screened for drought tolerance at the seedling stage in the screen house of the Department of Plant Science and Biotechnology, Adekunle Ajasin University, Akungba-Akoko (latitude 7.2 N, longitude 5.44’ E, Altitude 423M above sea level), Ondo State, Nigeria, between February and April, 2016. Seeds were planted in plastic bags filled with 3.5kg of sandy loam sieved soil without fertilizer in the screen house. After emergence, plants were thinned to two fairly uniform plants per pot with 10 pots per treatment and three replications for each accession in a Completely Randomized Design (CRD); total number of plants in the screen house was 600. Each pot was watered with 250ml of water per day until day 16, after which watering was stopped. Data recorded were wilting parameters [which included drought susceptibility score (DSS) using wilting scales and percentage permanent wilting (PPW)], morphological parameters, stomata conductance and recovery parameters [stem re-growth (STR), stem greenness (STG) and percentage recovery (PREC)] after commencement of watering for 14 days.Susceptibility was scored for plant using the International Board for Plant Genetic Resources [39] descriptors for cowpea. They were scored on a 1 to 7 scale, where 1 to 3.9 = low susceptibility (plant alive with green leaves); 4 to 5.9 = medium susceptibility (plant alive with most of the leaves yellow / or wilting); 6 to 7= high susceptibility (plant dead and dry). The score of two plants in each pot was averaged, after which the mean scores of the three replicates of each accession was determined. This was recorded for 7days, 14 days and 21 days of imposition of drought stress. Percentage permanent wilting was recorded at various intervals (14 days and 21 days) for each accession.Morphological data recorded include plant height, number of leaves and stem girth. Plant height was measured at the commencement of the drought stress (initial), 7 days, 14 days and 21 days of imposition of drought stress. Height was measured with a plastic meter rule from the base of each plant in each polyethylene pot to the tip. The values of two plants in each pot were averaged, after which the mean values of the three replicates of each accession was calculated. Number of leaves was counted for each accession at the commencement of drought stress (initial), 7 days, and 14 days of drought stress. Then the average number was determined for each accession per replicate and the mean values for the three replicates determined. The stem girth of each accession was measured with a digital caliper at 2 cm above soil surface to the nearest millimeter. The measurement was taken at the commencement of drought stress (initial); 7 days and 14 days of imposition of drought stress. Then the average girth was determined for each accession per replicate and the mean values for the three replicates determined.Stomata conductance was done on the 14th day of imposition of drought stress employing a steady state leaf porometer Model SC – 1, Decagon Devices, Inc. This was done between 11.30 am and 5.00 pm on just three plants per accession per replicate. Average value of each parameter was determined for each accession per replicate and the mean values for the three replicates determined.For recovery parameters; twenty one (21) days after imposition of drought stress, watering then resumed, and 14 days after, percentage plant recovery in each accession was recorded. Stem greenness and re-growth were scored as recovery parameters. Stem greenness was scored using a scale of 1-5, where 1 was yellow (plant recovered) and 5 was completely green. Re-growth was scored using three categories: 1 with no re-growth (plant recovered); 3 with re-growth from auxiliary buds; and 5 with re-growth from the apical meristems.
2.1. Data Collection and Analysis
- Data were subjected to Analysis of Variance (ANOVA) using the Generalized Linear Model (GLM) procedure of the Statistical Package for Social Science (SPSS) version 20 (SPSS Inc., Chicago IL). Means were separated using Duncan Multiple Range Test (DMRT) at P ≤ 0.01 level of significance. Genotypic (VG) and phenotypic (VP) variances were estimated according to ([40]; [41]). The phenotypic coefficient of variation (PCV %) and Genotypic coefficient of variation (GCV %) were estimated by method of Burton ([42]) and Johnson et al. ([43]) and were classified according to Sivasubramanian [44] as 0 – 10% = low; 10 – 20% = moderate; > 20% = high.Broad sense heritability (H2B) was expressed as the percentage of the ratio of VG to VP as described by Allard et al. (1960) and was categorized according Robinson et al. (1949) as 0 – 30% = low; 30 – 60% = moderate; > 60% = high. Genetic advance (GA) was estimated by the method given by Fehr et al. ([45]). GA was also calculated as percentage of the mean (GAM) according to the formula of Johnson et al. ([43]) and categorized as 0 – 10% = low; 10 – 20% = moderate; > 20% = high. Genotypic and Phenotypic correlations were estimated with Plant Breeding Tools (PB-Tools) version 1.4 (Biometrics and Breeding informatics, International Rice Research Institute) [46]. Phenotypic correlation coefficients were compared against table r (n-2) degrees of freedom at the probability levels of 0.05 and 0.01 to test their significance.
3. Results
- Results from analysis of variance (ANOVA) revealed high significant differences among accessions for all traits measured. Based on measured parameters, TVu-218, IT98K-555-1 and TVu-9256 were classified as highly susceptible; TVu-236, IT98K-205-8 and TVu-4886 were susceptible, while TVu-199, TVu-207, TVu-235 and TVu-241 were moderately susceptible.
3.1. Genotypic and Phenotypic Coefficients of Variation (GCV and PCV) for Wilting and Recovery Parameters
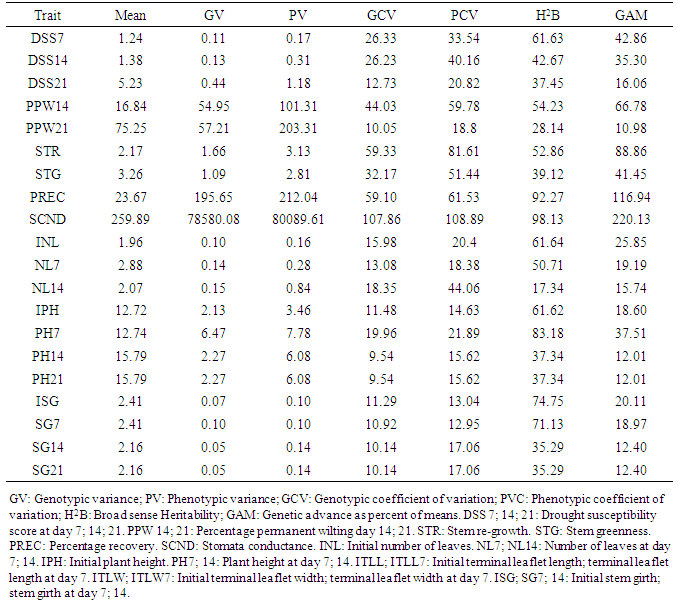
- Genotypic coefficient of variation (GCV) and phenotypic coefficient of variation (PCV) were high for most wilting traits except in DSS21 and PPW21 where GCVs were moderate while PCV was moderate for only PPW21. GCV and PCV were lowest (10.05 and 18.80%) in PPW21 while the highest GCV (26.33%) and PCV (40.16%) were observed in DSS7 and DSS14 respectively. All recovery parameters had high GCV and PCV; with the lowest GCV and PCV (32.17 and 51.44%) observed in STG while the highest GCV and PCV (59.33 and 81.61%) observed in STR. GCV reduced generally among wilting parameters as duration of drought stress increased, with the last day of drought stress having the least values for DSS21 and PPW21. PCV had increased value at day 14 of drought and later reduced to the lowest value at the last day of drought stress for both DSS21 and PPW21 (Table 1).
3.2. Genotypic and Phenotypic Coefficients of Variation (GCV and PCV) for Morphological Traits and Stomata Conductance
- All morphological traits had moderate GCV except in PH14, where low GCV was observed. The highest GCV (19.96%) among morphological traits was observed in PH7 while the lowest GCV (9.54%) was observed in PH14. PCV was high in INL, NL14 and PH7 while others had moderate PCV. The highest PCV (44.06%) was observed in NL14 while the lowest (12.95%) was observed in SG7. GCV (107.86%) and PCV (108.89%) were high in stomata conductance. Both GCV and PCV did not show a regular pattern of increments or decrease as duration of drought increased (Table 1).
3.3. Heritability and Genetic Advance as Percent of Mean (GAM) for Wilting and Recovery Parameters
- Heritability was moderate for most of the wilting parameters except in DSS7 which had high heritability and PPW21 which had low heritability. The lowest heritability (28.14%) was observed PPW21 and the highest (61.63%) was observed in DSS7. Heritability reduced as the duration of drought increased in all measured wilting parameters. Genetic advance as percent of mean (GAM) was high for traits like DSS7, DSS14 and PPW14 while it was moderate in DSS21 and PPW21. The highest GAM (66.78%) was observed in PPW14 while the least GAM (10.98%) was observed in PPW21. GAM also reduced in DSS and PPW as duration of drought increased with day 21 of drought stress having the lowest values for both parameters. Moderate heritability was observed among the recovery parameters in STR and STG; while PREC had a high heritability. GAM was also high for all recovery parameters; with the highest heritability and GAM observed in PREC (92.27 and 116.94%) while the lowest heritability and GAM (39.12 and 41.45%) observed in STG (Table 1).
|
3.4. Heritability and Genetic Advance as Percent of Mean (GAM) for Morphological Traits and Stomata Conductance
- Heritability was high for all initial morphological traits (INL, IPH and ISG), high for two morphological traits at day 7 of drought stress (PH7 and SG7), moderate for NL7, PH14 and SG14 and low for NL14. The highest heritability (83.18%) was observed in PH7 while the least (17.34%) was observed in NL14. Heritability generally decreased in number of leaves and stem girth as duration of drought increased with the least heritability observed at day 14 for both traits. Heritability increased in plant height at day 7 but later dropped in value to the least by day 14 of drought stress. GAM was found to be high among the morphological traits in INL, ISG and PH7 while GAM was moderate for the rest of the traits. The highest GAM (37.51%) was also observed in PH7 while the least (12.01%) was observed in PH14. GAM was generally reduced in traits like number of leaves and stem girth as duration of drought increased with the least value recorded for day 14 of drought stress for these traits. GAM also followed the same trend observed for heritability in plant height as the drought stress progressed. Stomata conductance was found to have both high heritability (98.13%) and high GAM (220.13%) during the drought stress (Table 1).
3.5. Estimates of Correlation (Genotypic and Phenotypic) among Wilting and Recovery Parameters
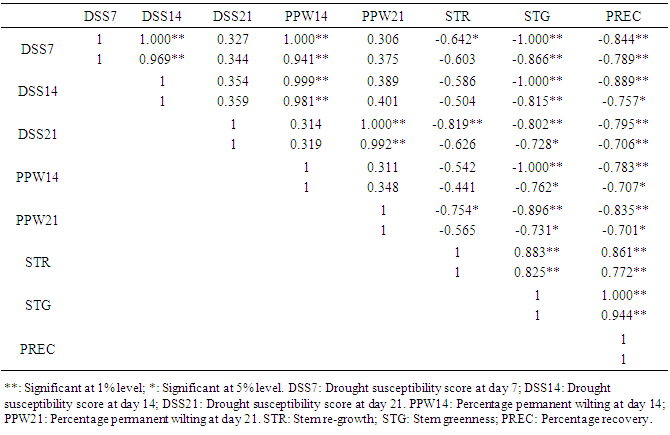
- Genotypic and phenotypic correlations among all traits showed both positive and negative correlations among most of the traits. For wilting and recovery parameters, DSS7 was highly positively correlated with DSS14 (1.000 and 0.969) and PPW14 (1.000 and 0.941). DSS14 was highly positively correlated with PPW14 (0.999 and 0.981) while DSS21 was highly positively correlated with PPW21 (1.000 and 0.992). DSS7 was highly negatively correlated with STG (-1.000 and -0.866) and PREC (-0.844 and -0.789). DSS7 had a significant negative correlation with STR (-0.642) only at genotypic level. DSS14 was also highly negatively correlated with STG (-1.000 and -0.815) and PREC (-0.889) at genotypic level, with just a significant negative correlation with PREC (-0.757) and phenotypic level. DSS21 was highly negatively correlated with STR (-0.819), STG (-0.802) and PREC (-0.795) at genotypic level while it maintained significant negative correlations with STG (-0.728) and PREC (-0.706) at phenotypic level. PPW14 and PPW21 had highly significant negative correlations with STG (-1.000, -0.896) respectively and PREC (-0.783, -0.835) respectively at genotypic levels while they also maintained significant negative correlations with STG (-0.728, -0.762) respectively and PREC (-0.706, -0.701) respectively at the phenotypic level. PPW21 had a significant negative correlation with STR (-0.754) only at the genotypic level. STR was highly positively correlated with STG (0.883 and 0.825) and PREC (0.861 and 0.772). STG was highly positively correlated with PREC (1.000 and 0.944). No significant correlations existed between STR and all wilting parameters at the phenotypic level, while most of the wilting parameters were negatively correlated with recovery parameters. Most wilting parameters that were positively correlated had parameters evaluated on the same day highly positively correlated among one another at both genotypic and phenotypic level. All recovery parameters were highly positively correlated among one another at both genotypic and phenotypic level (Table 2).
|
3.6. Estimates of Correlation (Genotypic and Phenotypic) among Morphological Traits and Stomata Conductance
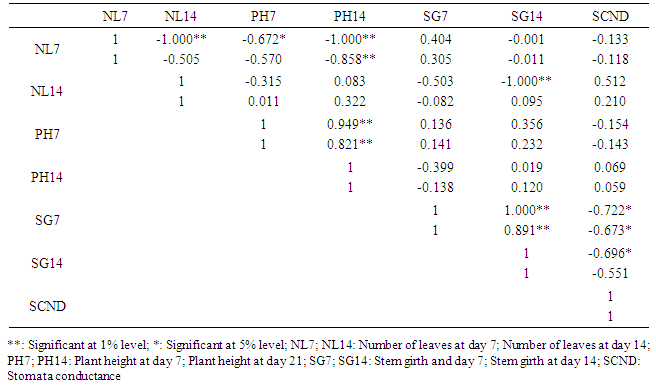
- Correlations among morphological traits and stomata conductance revealed significant positive and negative correlations among correlated traits at both genotypic and phenotypic level. NL7 was highly negatively correlated with PH14 (-1.000 and -0.858), highly negatively correlated with NL14 (-1.000) at genotypic level and negatively correlated with PH7 (-0.672) at genotypic level. NL14 was highly negatively correlated with SG14 (1.000) at the genotypic level. PH7 was highly positively correlated with PH14 (0.949 and 0.821). SG7 was highly positively correlated with SG14 (1.000 and 0.891) and negatively correlated with SCND (-0.722 and -0.673). SG14 was negatively correlated with SCND (-0.696) only at the genotypic level (Table 3).
|
3.7. Estimates of Correlation (Genotypic and Phenotypic) between Morphological Traits and Wilting Parameter
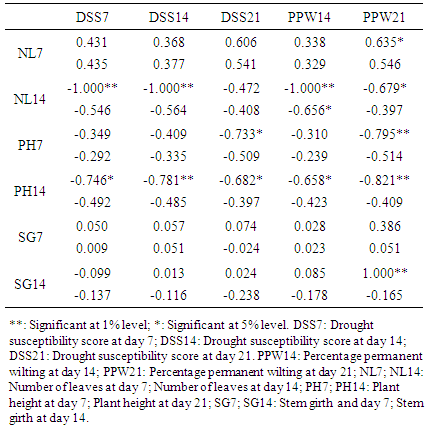
- Correlations between morphological traits and wilting parameters revealed positive and negative association mostly at genotypic levels while only one association was found at the phenotypic levels among correlated parameters. NL7 was positively correlated with PPW21 (0.635) only at genotypic level. NL14 was highly negatively correlated with DSS7 (-1.000), DSS14 (-1.000) and PPW14 (-1.000), and negatively correlated with PPW21 (-0.676) at the genotypic levels, but negatively correlated with PPW14 (-0.656) at the phenotypic level. PH7 was highly negatively correlated with PPW21 (-0.795) and negatively correlated with DSS21 (-0.733) at genotypic levels. PH14 was highly negatively correlated with DSS14 (-0.781) and PPW21 (-0.821), and negatively correlated with DSS7 (-0.746), DSS21 (-0.682) and PPW14 (-0.658) all at the genotypic levels. SG14 was highly positively correlated with PPW21 (1.000) at the genotypic level. Many traits evaluated on the same days were also significantly correlated (Table 4).
|
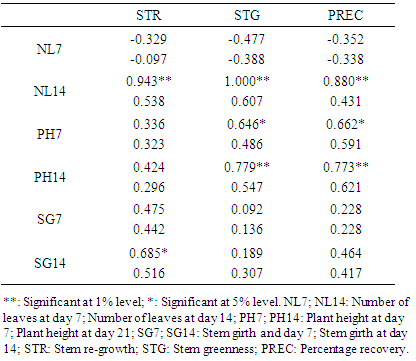
3.8. Estimates of Correlation (Genotypic and Phenotypic) between Morphological Traits and Recovery Parameters
- Positive genotypic associations were obtained among correlated parameters of morphological traits and recovery parameters. NL14 had high positive genotypic correlations with STR (0.943), STG (1.000) and PREC (0.880). PH7 had positive genotypic correlations with STG (0.646) and PREC (0.662); PH14 had highly significant positive genotypic correlations with STG (0.779) and PREC (0.773) while SG14 only had a significant positive correlation with STR (0.685) (Table 5).
|
4. Discussions
- Variation in mean values among individuals across traits under a particular environment reveals the level of phenotypic variability among them. This must be partitioned into heritable and non-heritable components based on suitable parameters, such as phenotypic and genotypic coefficient of variation, heritability and genetic advance. These parameters are in fact very important in improving traits and effective selection [29]. Heritability is much more effective for proper selection if considered with genetic advance [34]. High heritability accompanied with high genetic advance as percent of mean (GAM) indicates additive genetic effects hence, selection is effective. High heritability accompanied by low GAM suggests non-additive genetic action; low heritability with high GAM also indicates additive gene actions and low heritability with low GAM shows that traits are highly controlled by the environmental factors which lead to ineffective selection. It was revealed in this study that GCV was lower than PCV for all studied traits; and that both GCV and PCV reduced as duration of drought stress extended until day 21 of drought stress among the wilting parameters and morphological traits. This is due to the influence of environment on these traits, as environmental influence becomes more pronounced as stress lingers. GCV and PCV reduced as duration of drought increased among plant height and stem girth in maize [5], suggesting that performance of these varieties to be better under normal growing condition, but Hefny [32] had GCV and PCV to be higher in morphological traits of lupin under drought stress condition than normal growing condition. The little differences between the values of GCV and PCV for most morphological traits and stomata conductance also suggested that these traits were mostly contributed to by the genes and less influenced by environment factors. Wilting parameters (DSS7, DSS14 and PPW14), recovery parameters and stomata conductance showing high GCV and PCV; wilting parameters (DSS21) and morphological traits (INL, NL14 and PH7) showing high PCV suggested that the accessions involved had broad genetic base for these traits under drought stress. These results are in accordance with the findings of Hefny [32], Sabiel et al. [5] and Naeem et al. [33] who obtained higher PCV than the corresponding GCV values for all studied traits under drought stress in various crop species. Traits showing moderate GCV (DSS21, PPW21, INL, NL7 NL14, IPH, PH7, ISG, SG7 and SG14) and PCV (PPW21, NL7, IPH, PH14, ISG, SG7 and SG14) suggested the existence of moderate variability among the genotypes studied under the drought condition. The low GCV found only in PH14 suggested that as stress increase, selection based on this trait may not be reliable. Moderate and low PCV were observed in stem diameter of maize and also, low GCV was recorded for maize evaluated under drought stress for 60 days [5]. Almost all traits exhibited moderate to high heritability among the accessions studied under drought stress. Wilting parameters like DSS7, stomata conductance, morphological trait (PH7) showing high heritability coupled with high GAM under drought stress suggested that direct selection for drought tolerance could be made based on these traits. This is also true for traits like DSS14, PPW14, STR and STG which exhibited moderate heritability and high GAM. High heritability of stomata conductance experienced in this study is supported by the findings of Agbicodo et al. [26] in cowpea genotypes exposed to drought stress. This is also similar to the findings of Sabiel et al. [5] who recorded high heritability for plant height at day 30 and day 60 of drought stress in maize. Shoot length and root length also exhibited high heritability in cotton under drought stress [47]. Heritability was also high for morphological parameters like root weight and total weight of wheat plants under drought stress [33]. Selection based on traits showing moderate heritability and GAM under drought stress would also be effective as found in traits like DSS21, NL7, PH14 and SG14; and also for traits showing high heritability and moderate GAM as found in IPH and SG7. Heritability in broad sense was found to be moderate in root characters and leaf parameters in peanuts [30], among most root characters in maize and lupin genotypes [31, 32], in plant height and stem diameter in maize [5] under drought stress. Knowledge of association of various traits conferring drought tolerance is necessary for making direct selection for improvement under drought stress. Phenotypic correlations provide information on the extent of observed relationships between two traits and influenced by the environmental factors. Whereas genotypic variations provide information on the inherent association between genes controlling any two traits, hence its greater significance at initiating an effective selection scheme [34]. Genotypic correlation was higher generally than phenotypic correlations among positively correlated traits while phenotypic correlation was generally higher than genotypic correlations among negatively correlated traits in this study. In this regard, genotypic correlation is deemed to be more important since effect of the environmental factors seemed to be minimal among these traits. Strong associations among some wilting and recovery parameters at both genotypic and phenotypic levels were experienced in this study. Positive genotypic and phenotypic correlations existing between DSS7 and DSS14 suggested that seedlings of accessions most susceptible at day 7 of drought stress were also more susceptible at day 14 of drought stress. Strong positive genotypic and phenotypic correlations between DSS7 and PPW14, DSS14 and PPW14, DSS21 and PPW21 suggested that the more the susceptibility of seedlings to drought the more the number of wilted and dead seedlings across accessions. Wilting parameters were highly negatively correlated with recovery parameters like STG and PREC mostly at genotypic and phenotypic levels. These results suggested that cowpea seedlings especially the most susceptible ones will find it difficult to re-grow and recover. They also indicated that seedlings must maintain stem greenness to be able to recover from drought and resume growth. Similar conclusion has been reached by Muchero et al. [25] by maintaining that stem greenness is a trait of importance in screening for drought tolerance in cowpea. Combining drought susceptibility scores, percentage permanent wilting and stem greenness would enhance the level of information concerning genotypic differences as regards drought tolerance in cowpea [37, 28]. Negative correlations among some morphological traits like NL7 and PH7 at genotypic level and PH14 at both genotypic and phenotypic levels suggested that, under drought stress, the taller the seedlings the fewer the number of leaves. Negative correlations between stem girth (SG7 and SG14) and stomata conductance at both genotypic and phenotypic levels also suggested that seedlings with higher stem girth values had lesser stomata conductance under drought; whereas positive genotypic correlation existed between SG14 and PPW21 which suggested that seedlings with bigger stem girth had more wilted or dead plants. It can be concluded that the effect of drought on seedlings with bigger stem girth actually reduced the stomata pores on their leaves and this led to the reduction of their conductance. Negative correlation between NL14 and SG14 at the genotypic level suggested that seedlings with fewer leaves will be able to maintain higher stem girth under drought stress. Negative correlations among NL14 and wilting parameters (DSS7, DSS14, PPW14 and PPW21) at genotypic level suggested that seedlings with more leaves were less susceptible to drought stress, and therefore had fewer number of wilted or dead plants as stress lingered. Negative correlation among PH14 and wilting parameters also suggest that taller seedlings were able to withstand drought more leading to the fewer number of wilted or dead plants among them. Positive genotypic correlations among correlated morphological and recovery parameters suggested that seedlings with more leaves during drought stress will recover faster through regrowth and stem greenness. Taller seedlings will also become greener after re-watering and recover faster. The ones with bigger stems may have the tendency to regrow faster. The strong correlations between wilting parameters and all other traits suggest the possibility of using this as an easy measure of traits associated with drought tolerance in cowpea and other related crops.
5. Conclusions
- In conclusion, heritability estimates and correlation of traits provide information leading to effective selection of genotypes under drought stress. Based on heritability and GAM, selections for traits like wilting parameters, recovery parameters, stomata conductance and all morphological traits with moderate to high heritability and GAM would be more effective. All significantly correlated characters to the wilting and recovery parameters will also make selection under drought stress effective. Based on these parameters, TVu-218, IT98K-555-1 and TVu-9256 were classified as highly susceptible; TVu-236, IT98K-205-8 and TVu-4886 were susceptible, while TVu-199, TVu-207, TVu-235 and TVu-241 were moderately susceptible.
ACKNOWLEDGEMENTS
- The authors acknowledge the contribution of the Genetic Resources Center, International Institute of Tropical Agriculture (IITA), Ibadan, for providing the cowpea accessions used for this study. Our profound gratitude goes to the management of Adekunle Ajasin University, Akungba-Akoko, Nigeria for sponsoring the Ph.D. programme from which this research is part of. Our profound gratitude also goes to Dr. Omotuyi, of the Molecular and Biocomputing Laboratory, Adekunle Ajasin University, Akungba-Akoko, Ondo State, Nigeria for making his laboratory available during the course of this research.