-
Paper Information
- Paper Submission
-
Journal Information
- About This Journal
- Editorial Board
- Current Issue
- Archive
- Author Guidelines
- Contact Us
International Journal of Plant Research
p-ISSN: 2163-2596 e-ISSN: 2163-260X
2017; 7(1): 1-4
doi:10.5923/j.plant.20170701.01

Response to Selection and Decline in Variability, Heritabilty and Genetic Advance from F2 to F3 Generation of Tomato (Solanum Lycopercicum)
 Abstract
 Reference
 Full-Text PDF
 Full-text HTML
Mehboob Ahmad1, Mazhar Iqbal1, Bilal Ahmed Khan1, Zaheer Ullah Khan1, Kehkashan Akbar2, Ihsan Ullah1, Muhammad Shahid3, Adil Rehman3
1Hazara Agricultural Research Staion, Abbottabad, Pakistan
2Hazara University, Mansehra, Pakistan
3Agricultural Research Station, Baffa, Mansehra Pakistan
Correspondence to: Mehboob Ahmad, Hazara Agricultural Research Staion, Abbottabad, Pakistan.
| Email: |  |
Copyright © 2017 Scientific & Academic Publishing. All Rights Reserved.
This work is licensed under the Creative Commons Attribution International License (CC BY).
http://creativecommons.org/licenses/by/4.0/

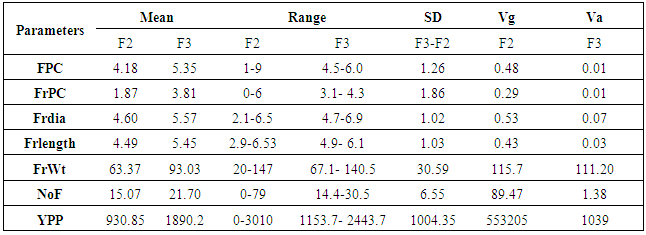
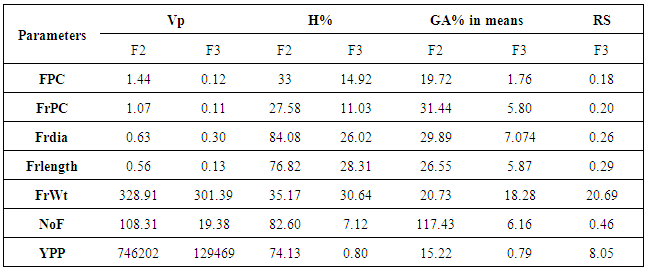
Success of breeding programme depends upon response to selection, heritability and genetic advance so, assessment of these parameters is important. In our research the data on F2 and F3 generations of SolanumLycopersicum were collected in 2015 and 2016, respectively and the values of mean, range, selection differential, heritability, genetic advance and response to selection were calculated for both the generations. The phenotypic variance, genotypic variance, heritability and genetic advance % was found to be higher in F2 generation than in F3 for all the parameters. Highest value of heritability% was observed for fruit diameter while lowest value was estimated for flowers/cluster in F2 generation. In F3 generation highest value of heritability was found for fruit weight and the lowest value was calculated for yield/plant. Highest and lowest genetic advance % was calculated for number of fruits/plant and yield/plant in F2 and for fruit weight and yield/plant in F3, respectively. The maximum and minimum range in F2 was observed to be wider than in F3.Selection differential and response to selection were found to be positive for all the parameters. The study reveals that judicious selection leads to improvement in next generation.
Keywords: Tomato, F2, F3, Range, Mean, Selection response, Heritability, Variability, Genetic advance
Cite this paper: Mehboob Ahmad, Mazhar Iqbal, Bilal Ahmed Khan, Zaheer Ullah Khan, Kehkashan Akbar, Ihsan Ullah, Muhammad Shahid, Adil Rehman, Response to Selection and Decline in Variability, Heritabilty and Genetic Advance from F2 to F3 Generation of Tomato (Solanum Lycopercicum), International Journal of Plant Research, Vol. 7 No. 1, 2017, pp. 1-4. doi: 10.5923/j.plant.20170701.01.
1. Introduction
- Tomato (Solanum Lycopersicum) is a self pollinated diploid plant species with chromosomes number 2n=24. It has diversity in various morphological features which are helpful in genetic study at any population level. Like other self pollinated crops, breeders apply selection, testing and screening in early generation according to desirable goals. Early generation testing helps them increase the breeding efficiency by choosing superior genotypes and eliminating inferior lines from heterozygous population [1]. Early generation selection is successful for fissure resistance in rice [2]. Selection at F2 and F3 stages is useful and delayed selection does not bear any fruitful result. Ignoring the selection in early generations may lead to drifting of superior genotypes [3]. Segregation is maximum for selection in F2 generation [4]. Heterozygosity, which is highest at F2 stage decreases in F3 generation, as with every advance in generation, it decreases by 50% in a population [5].Therefore, in F2 generation selection is applied on individual plant while at F3 stage it is applied within the F3 line. Selection increases the population genotypic mean for a particular trait [6]. The increase in means results in positive value of selection differential and selection response in next generation. Selection is effective from F2 to F3 generation of tomato for late blight resistance [7].Some time a breeder may face the problem of low performance of F3 or F2 selected lines in next generation. Low efficiency of selection in F2 and F3 generation may be due to environmental factors which mask the expression of genes; consequently high and low yielding lines cannot be discriminated [8]. Therefore, It is essential in breeding programme to study heritability and genetic advance as well as selection response and selection differential. The concept of heritability has enabled breeders to find the efficacy of selection as well as determines the environmental effects and hence selection efficiency can be measured [9]. The estimate of heritability and genetic advance in early generation selection are useful in finding response to selection for yield and yield components. Selection differential measures the intensity of artificial selection. Response to selection gives us information about the change in mean from previous generation to next generation; hence it is the product of selection differential and narrow-sense heritability [10].The purpose of our study is to find the efficiency of lines selected from F2 generation at F3 stage by finding the heritability, genetic advance and selection response. The study will also make comparison between F2 and F3 population regarding variation, heritability and selection differential, mean and range.
2. Materials and Methods
- Field practices and data collection: Two varieties of tomato, Nagina and Bushbeef steak having distinct characteristics were sown as nursery and after 45 days of sowing mature plantlets were transplanted in the field at Hazara agricultural research station Abbottabad during June 2013. NPK fertilizer was applied to plants at flowering stage. Weeds were eradicated by manual practice. The flowering started in July 2013 and Nagina was used as line and Bush beefsteak was used as tester. The flowers of Nagina variety were emasculated and pollens from bush beefsteak were used for pollination. After pollination, tagging and bagging of the cross pollinated flower was done in a proper way. After the ripening of fruit, seeds were collected as F1. The collected seeds were grown as nursery and transplanted in the field in March 2014. The fertilizer and other practices were applied as mentioned above. F2 seeds were collected from F1 plants on maturity. The seeds along with parental varieties were sown as nursery in January 2015 and 45 days old nursery was transplanted in the field. The data on F2 population and parental varieties were collected on the parameters: Flowers/cluster, fruits/cluster, fruit diameter, fruit length, fruit weight, No of fruits/plant and yield/plant. The plants according to desirable traits were selected from F2 generation and seeds were collected. F3 seeds along with parental varieties were sown in nursery in January 2016. 45 days old plants were transplanted in the field and data were collected on the parameters mentioned above.Statistical data analysisData collected from F2 and F3 lines were subjected to statistical analysis whose detail is given as following.Mean, range, Variance of environment (Ve) and Variance of phenotype (Vp) were found by using the statistix 8.1 software.Ve=Vp1+Vp2/2Where P1 is first parent in crossing and P2 is second parent in crossingVg (Variance of geneotype) was found by the following formula As Vp=Vg+Ve so Vg=Vp-VeVa (additive variance) in F3 generation was found by applying the formula suggested by [11] as following.The Vg between means of F3 lines =Va + 1/4VdWhere Va= Variance due to additive gene action and Vd=Variance due to dominant gene actionThe value of Vd is very small, if we ignore it it will not make any differenceTherefore Vg between means of F3 line =VaResponse to selection (RS) was found by using the following method applied by [12]RS=ih ƠPWhere i: selection intensity with value of 1.76 at 10%, h: heritability and ƠP: phenotypic coefficient of variation.Heritability% in F2 and Genetic advance % in F2 and F3 were calculated according to following formulas used by [13] in their study.Hb = {VF2 – [1/3 (VP1 + VP2 + VF1)]}/VF2Where Ve=Vp1 +Vp2+Vf1/3 and Vp=VF2 Vg=Vp-Ve So, Hb=Vg/Vp Hb%=Hb x 100GA%=GA/x × 100Where Hb%: broad sense heritabilty %, Vp: Phenotypic variance, Vg: genotypic variance, Ve: variance of error, GA:genetic advance and GA%: genetic advance % in percentage of means. Heritabilty in F3 was calculated according to following method:H%=Va/Vp ×100Va in the F3 population has already been discussed above.Selection differential was found by subtracting means of F2 population from means of F3 population SD=F3-F2.
3. Results and Discussion
- Mean values of all the parameters like flowers/cluster, Fruits/cluster, Fruit diameter, fruit length, fruit weight, number of fruits/plant and yield/plant are higher in F3 population than in F2 (Table 1). The selection practice generation after generation leads to increase in mean of the population [14]. While proceeding from F2 to F3 generation, dominant gene action decreases and additive gene action increases [15] so, the increase in means values in F3 generation may be attributed to additive gene action.
|
4. Conclusions
- Selection from previous F generations to next F generation in breeding prorgramme may lead to decrease in variability and heritability. However, on the other hand judicious selection causes increase in mean of the population for certain traits. Since, breeder is concerned with the enhancing of means for the traits; he may get an improved population at the onset of homozygosity at F8 and onward stages.
References
| [1] | Percy, R.G., 2003, Comparison of bulk f2 performance testing and pedigree selection in thirty pima cotton populations, J. Cott. Sc., 7, 170–178. |
| [2] | Pinson, S. R. M., Jia, Y., Gibbons, J., 2012, Response to early generation selection for resistance to rice kernel fissuring. Cr. Sc., 52(4):1482-1492. |
| [3] | Jamago, J. M., 2007, Breeding for high yield and high protein in Soyabean and the potential use of new flower color genes. PhD dissertation. university of Illinois ,Urbana Chamaign. |
| [4] | Savitha, P., kumara, R. U., 2015,Genetic Variability Studies in F2 and F3 Segregating Generations for Yield and its Components in Rice (Oryza sativa L.), Ind. J.Sci. Tech., 8(17), 1-7. DOI: 10.17485/ijst/2015/v8i17/61899, August 2015. |
| [5] | Acquaah, G., 2012, Principles of plant breeding and genetics, Wiley Blackwell. John Wiley and sons Ltd, Sussex, UK. |
| [6] | Bautista, H. A., Lobato-Ortiz, R.., García-Zavala, J.J., Parra-Gómez, M. A., Cadeza-Espinosa, M., Canela-Doñan, D., Cruz-Izquierdo, S., Chávez-Servia, J.L., 2016, Implications of genomic selection for obtaining F2:3 families of tomato, Sci. Hort., 207, 7–13. http://dx.doi.org/10.1016/j.scienta.2016.05.005. |
| [7] | Horneburg, B and Becker, H. C., 2011, Selection for Phytophthora field resistance in the F2 generation of organic outdoor tomatoes, Euph, 180: 357–367. DOI 10.1007/s10681-011-0384-3. |
| [8] | Khush, G.S., 1987, Rice farming systems New directions. International Rice Research Institute, Phillipines. |
| [9] | Peirce, L.C., 1991. Genetic Improvement of Tomato, Springer verlag, Berlin. |
| [10] | Snustad, D.P., Simmons, M. J., 2014, Priciples of genetics. John Wiley and sons, Hoboken, NJ. |
| [11] | Wrike, G., Weber, W. E., 1986, Quantitative genetics and selection in plant breeding, Walter de Gruyter, Newyork. |
| [12] | Ameen T. E., Hossain A., Jaime A., Silva, T. da., 2013, Genetic analysis and selection for bread wheat (Triticum aestivum L) Yield and agronomic traits under drought conditions, Int. J Plant breed, 7(1), 61-68. |
| [13] | Ahmad, M., Iqbal, M., Gul, Z., Khan, B.A., Shahid, M., saleem M., Khan, N.I., 2016,Genetic analysis of F2 population of tomato for studying quantitative traits in the cross between Bushbeef x Nagina, J. Res. Bio, 6(1), 1922-1927. |
| [14] | Snustad, D.P., Simmons, M.J., 2014, Priciples of genetics. John Wiley and sons, Hoboken, NJ. |
| [15] | Tibelius, A.C., Klinck, H.R., 1985, Inheritence of primary, seconadary seed weight ratios and secondary seed weight in oats. Proceeding of second international oats conference. The university college of wales, Aberystwyth. Martinus Nijhoff publishers, Boston. |
| [16] | Ajay, B.C., Byregowda, M., Prashanth Babu, H, Veera, Kumar, G.N., Reena, M.,2014, Variability and transgressive segregation for yield and yield contributing traits in pigeonpea crosses, E. J. Plant .bred, 5(4), 786-791. |
| [17] | Wallace, D. H., Ozbun, J.L., Munger, H.M., 1972, Advances in agronomy. American society of agronomy, Academic press, Newyork. |
| [18] | Mohamed, G.I.A, Abd-El-Haleem., 2011, Pedigree selection in two segregating populations of faba bean (Vicia Faba L) I-agro-morphological traits, W. J. Agr. Sc, 7(6), 785-791. |
| [19] | Anonymous, Introduction to quantitative genetics, Chapter 8. Anonymous. |
| [20] | Mauseth, J.D., 2009, Botany: An introduction to plant biology. Jones and Bartlett publisher, Barb House, Barb Mews, London, UK. |
| [21] | Suwarto, U.S., Nurchasanah, S., 2015, Performance of selected plants in F2 and F3 generation for yield and yield component characters of new plant type rice genotypes at aerobic rice. Res. J.Pharma. Bio.Chem.Sci., 6(1), 1165-1170. |
| [22] | Roumen, E.C., 1994, Selection in early generation of breeding cycle. In: Rice blast diseases. CAB international, International Rice research institute, Philippines. |