-
Paper Information
- Paper Submission
-
Journal Information
- About This Journal
- Editorial Board
- Current Issue
- Archive
- Author Guidelines
- Contact Us
International Journal of Plant Research
p-ISSN: 2163-2596 e-ISSN: 2163-260X
2015; 5(2): 34-41
doi:10.5923/j.plant.20150502.02
Changes in Free Phenolics Contents during Tuber Development, Dormancy and Sprouting in White Yam (Dioscorea rotundata Poir.)
 Abstract
 Reference
 Full-Text PDF
 Full-text HTML
Elsie I. Hamadina1, Peter Q. Craufurd2
1Department of Crop & Soil Science, University of Port Harcourt, Port Harcourt, Nigeria
2Global Conservation Agriculture Program, CIMMYT, Nairobi. Kenya
Correspondence to: Elsie I. Hamadina, Department of Crop & Soil Science, University of Port Harcourt, Port Harcourt, Nigeria.
| Email: |  |
Copyright © 2015 Scientific & Academic Publishing. All Rights Reserved.
The objectives of this study were 1) to determine the changes in free phenolics in yam tubers during development, dormancy and sprouting, and 2) evaluate the relationship between concentration of phenolics and, start and end of dormancy. Tubers were harvested at 127 DAP (Days after planting), while the plants was still green, and at 176 DAP (at vine senescence). During tuber storage, samples were collected at 246 DAP and 303 DAP (start of sprouting). Tuber tissue samples were collected from seven tubers at each of these harvest dates, freeze-dried and analysed for total free phenolics, using High Performance Liquid Chromatography (HPLC). Highest mean total free phenolics content occurred at 127 DAP (2.46 AU units/g dry wt.), while the lowest was recorded at vine senescence (1.79 AU units/g dry wt). Individual phenolic compounds did not have lower concentrations prior to vine senescence (i.e., 176 DAP). After vine senescence, the mean total free phenolics declined, but individual phenolic compounds did not exhibity any discernible decline in concentration over time. The decline in total free phenolics between harvests at 176 DAP and sprouting indicate that free phenolics may have a role in the release of D.rotundata tuber dormancy.
Keywords: Dioscorearotundata, Free Phenolics, Dormancy, Sprouting
Cite this paper: Elsie I. Hamadina, Peter Q. Craufurd, Changes in Free Phenolics Contents during Tuber Development, Dormancy and Sprouting in White Yam (Dioscorea rotundata Poir.), International Journal of Plant Research, Vol. 5 No. 2, 2015, pp. 34-41. doi: 10.5923/j.plant.20150502.02.
Article Outline
1. Introduction
- The cessation of yam tuber growth (bulking) occurs just before the start of vine senescence ([1], [2], [3]) and this is accompanied by the slowing down of physiological activity. The onset of these events is generally considered to mark the start of tuber dormancy, which coincides with the start of the dry season in yam growing areas ([4] [5], [6], [7], [8]). However, the control of the onset of dormancy and its release is still not clear [9].Many plant growth inhibitions, including dormancy, are thought to be under the influence of endogenous plant growth regulators (PGRs) with growth inhibitory characteristics ([3], [10], [11]). Several of these compounds are phenolics, and belong mostly to the stilbenoids group of phenolics [12]; and they have been isolated in healthy D. alata, D. esculenta, D. opposita and D. floribunda tubers ([3], [10], [13], [14]). In a study, the growth inhibitors were not found in healthy D. rotundata [13]. Nevertheless, Coxon et al., 1982 [15] suggested the need for further investigations as small amounts of batatasin 1 (a member of the phenanthrene class of stilbenoids) might be present in even healthy tubers.Since endogenous phenolic compounds are generally known to inhibit plant growth directly or indirectly ([15], [16], [17]), studies that measure changes in free phenolic compounds during dormancy may provide useful information on the role of phenolics in yam tuber dormancy. In addition, it is important to identify the phase(s) of yam tuber dormancy that may be under the control of phenolic growth inhibitors. In the study reported by Hashimoto et al., 1972 [10] and Coxon et al., 1982 [15] the period of dormancy that is inhibited by exogenously applied batatasins, is the progress towards sprouting, which may be related to the phases 2-3 of dormancy described by Ile at al., 2006 [18]. Hashimoto et al., 1972 [10] and Coxon et al., 1982 [15], measured the concentration of specific phenolic compounds in dormant tubers (at harvested after vine senescence through to commencement of sprouting) and found higher concentrations in dormant tubers than in sprouting tubers. With D. alata, Ireland and Passam, 1984 [3] have shown that the concentration of batatasins is low during tuber development and high at vine senescence. To understand the role of phenolics in the initiation of dormancy in D. rotundata, investigations must cover the complete circle of dormancy, i.e., from some point after tuber initiation to sprouting).Therefore, the objectives of this study were: 1) to examine the changes in free phenolic compounds in white yam tubers between harvest (before and after vine senescence) and sprouting (i.e. Appearance of shoot bud on the surface of tubers; ASB), and 2) to determine the relationship between the concentration of phenolics, and the start and end of dormancy.
2. Materials and Methods
2.1. Experiment to assess the Presence of Phenolics in Young D. rotundata Tuber Tissues and D. alata
- In this experiment, D. rotundata tubers weighing between 2 and 10 g were harvested at 76 DAP from plants that were just tuberising. The tubers were collected from selected plants grown under the conditions described in Section 2.2. Due to the small size of the tubers and thin peel, tubers weighing a total of 45 g fresh weight were shredded together. Extraction was done using 100% hot methanol + ethyl acetate, separating compounds in the crude extract on TLC plates developed in CHCl3 -MeOH (96:4) as well as in CHCl3 – HOAc (95:5), based on protocol described by Harborne, 1989 [20], as modified by Ile, 2004 [19].Because phenolic dormancy promoting compounds are known to occur naturally in D. alata, the UV spectra and retention times (Rt), and retention factor (Rf) of compounds eluted from D. alata tubers were compared with those from D. rotundata tubers. Tubers of D. alata were peeled and separated into peel and pulp. Extraction was done in 100 % hot methanol + ethyl acetate, and TLC plates developed in CHCl3–MeOH (96: 4) and CHCl3 – HOAc (95:5), and the extract was also analysed by HPLC as described in Section 2.2.5.
2.2. Experiment to Determine Changes in Free Phenolics in D. rotundata Tubers during Tuber Development, Dormancy and Sprouting
- Healthy, sprouting tubers of D. rotundata TDr 131 were planted in 25 cm pots containing a soil mixture of sterile sand: gravel: vermiculite and loam-less compost in a ratio of 4:2:4:1 (v/v) as well as 3 g/l Osmocote-plus fertilizer. Osmocote-plus is a slow release (90-120 d) fertilizer containing N+P2O5+K2O+MgO at 15 + 11 + 13 + 2 + all essential trace elements (B, Cu, Fe, Mn, Mo, Zn) (Monro Horticulture, Goodwood, West Sussex UK). These tubers were themselves produced from tissue culture plantlets grown in pots. Planting was done in the month of May. Plants were grown under photoperiod and temperature conditions that simulated a June sowing date at Ibadan, Oyo State, Nigeria. Air temperature in the glasshouse was maintained at 32℃ during the day and 22℃ at night. Pots were watered regularly as required.
2.2.1. Tuber Harvest, Storage Conditions and Sampling
- Harvesting was done twice: at 127 DAP, when leaves and vine were still green, and at 176 DAP (main harvest), when leaf senescence had began. The weight of the tubers ranged from 4 to 245 g in the first harvest and 13 to 173 g in the second harvest. After harvest, tubers were kept in Saxcel growth cabinet until sprouting (i.e., appearance of shoot bud on the surface of tubers). The growth cabinet was maintained at 12-hr photoperiod, photon flux density of 0.017° mmol m2 s-1, constant air temperature and relative humidity of 28℃ and 80%, respectively. Tubers were sampled at four dates for chemical analysis of phenolics:● 127 DAP (during early tuber filling);● 176 DAP (at vine senescence, tuber maturity);● 246 DAP (during tuber storage); and● 303 DAP (at first external sign of sprouting).
2.2.2. Dehydration of Tissue Samples
- At each sampling time, seven tubers were sampled. Each tuber was divided transversely into two parts forming proximal (head) and distal (tail) regions. Tuber portions weighing 50 g were sampled from each tuber region. The tuber portions were cut into small pieces and frozen in liquid nitrogen. Frozen samples were then freeze-dried in 50 ml Falcon tubes, for 48 h using a Birchover F.D (7.5 L capacity) freeze drier. After freeze-drying, samples were stored at –80℃ until tissue chemical analysis.
2.2.3. Extraction of Phenolics in Freeze-dried Samples
- The freeze-dried samples were first weighed for the determination of dry matter content and then samples were ground (in a laboratory mill A-10) for one to two minutes. Powder samples weighing 9g was used for the extraction of phenolics. Extraction was done with 100 ml 70% methanol that was brought to boil and allowed to stand for 3h. The extract was filtered through glass wool to remove debris. Samples were rinsed two to three times with 50ml methanol or until the extract was colourless. The methanol was evaporated under vacuum at 40℃. The aqueous extract was transferred to a separating funnel to separate the free phenolic fraction from those of other dissolved compounds. The extract was partitioned using ethyl acetate. Free phenolics were extracted into the upper ethyl acetate layer [20], which was collected in a conical flask. This procedure was repeated until no colour was observed in the ethyl acetate layer. The combined ethyl acetate fractions were reduced to dryness by rotary evaporation at 40℃. The residue was dissolved in 2 ml absolute methanol with the help of sonication. The extract was then collected into a 5ml glass tube and stopped tightly to prevent evaporation. The process was repeated, to rinse the flask, using another 2ml absolute methanol and combined with the first 2 ml.
2.2.4. Qualitative Analysis of Phenolics
- Fifteen spot applications of crude extract were applied on Merck silica gel TLC sheets. A preliminary experiment showed that 15 spot applications was better than 5 or 10. The silica gel sheets were developed in CHCl3-MeOH (96: 4), based on results from the experiments reported in 2.3.2. Colour reagents (vanillin in 2-tetraoxosulphate-6 acid, folin and ciocaleau (F+C), and F+C + ammonia) were used to confirm that the compounds separated from the extract were phenolic [20]. Two standards were run alongside the extracts; a stilbene (i.e. resveratrol) and a phenolic acid (i.e. ferulic acid). The standards were denoted as Std 1 and Std 2 respectively.
2.2.5. Quantification of Phenolic Compounds
- The HPLC procedure used in this experiment is as described in section 2.1. Seventy (70) μl of crude extract (from the 4 ml crude extract) was filtered through a Gelman Acrodisc 13 nylon membrane filter of pore size 0.45 μm (HPLC certified). An injection volume of 40 μl of the filtered extract was used for the HPLC analysis.The HPLC instrument used was a Watters 600 multi-solvent delivery system fitted with a Watter 994 photodiode array detector. The column was a Watter Bondapak Phenyl C18 of dimension 4 mm internal diameter (ID) x 30 cm. Solvent A was 2% acetic acid and solvent B was methanol: acetic acid: water in the ratio of 18:1:1. The flow rate was 1 ml/min and the temperature 25℃. The slow eluting, more polar programme started with a mixture of 75% A: 25% B changing to 100% B over 35 mins in a linear mode. The faster eluting slightly less polar programme started with 65% A: 35% B changing to 100% B over 35 mins in a linear mode. In both cases, the UV detection was at 264 and 272 nm, which are the peak absorbance reported for the phenanthrenes [15] of which batatasins I is one, and the diode array scan was over the range of 200 to 400 nm.
2.2.6. Experimental Design and Data Analysis
- There were four sampling times with seven replications (number of tubers sampled) per sampling time. Total free phenolics per sample was estimated as the summation of the peak heights of all the compounds [20] detected per 40 μl crude extract. The result was expressed as absorbance units/g of dry weight. Mean total free phenolics per sampling date (in Abs. units/g dry wt.) was the mean of seven replicates. The significance of the differences over sampling dates was determined using the SAS GLM procedure. To determination the duration from planting to sprouting, tubers were arranged in a growth cabinet following a completely randomised design (CRD) with three replications and 10 tubers per replicate. The SAS, product limit procedure was used to determine the 50th percentile duration from planting to sprouting. However, because there were no censored data, i.e. all tubers sprouted within the experimental period, the mean and standard error values are presented.
3. Results and Discussion
3.1. Assessment of Phenolics in Crude Extracts of Young, Developing D. rotundata and D. alata Tuber Tissues
- Using TLC, three major fluorescent bands were observed at Rf 0.15, 0.44 and 0.91 respectively in crude extract of young D. rotundata tuber tissue. These Rf were similar to the Rf values obtained by Hashimoto et al., 1974 [10]; Hashimoto and Tajima, 1978 [21]; Ireland et al., 1981, 1984 ([13, 22]) for batatasins. Using HPLC, the concentration of phenolic compounds per 40 µl crude extract was generally low, ranging from 0.005 to 0.12 AU, and lower than that obtained in sprouting D. rotundata tuber tissue. The UV spectrum of some compounds with minor peaks were detected this study. They were eluted at about 19.64, 20.95, 21.77, and 22.63 mins and at wavelengths between 300 and up to 350 nm. The results showed that young (bulking) tubers contain phenolic compounds similar to those found in mature sprouting D. rotundata tubers.In D. alata, peak heights were mostly high, ranging from 0.2 to 2.11 AU per 40 µl crude extract. The peaks that were marked as potential batatasins in the sprouting and young D. rotundata tuber tissues were also present in D. alata, and were eluted at similar retention times (Rt) (Figure 1). The relative consistency in their retention times further suggests that the protocol was satisfactory for determining the presence and changes in specific phenolic compound in D. rotundata. The spectrum absorbance of some other peaks and their Rt, i.e. 10.85, 12.59, 14.01, and 16.78 mins, suggest the presence of stilbenoids. Although the retention times with which these comparisons were made were mostly derived from analysis using gas-liquid chromatography, GLC ([12], [23]), the presence of similarities between them suggested a need for further investigation.
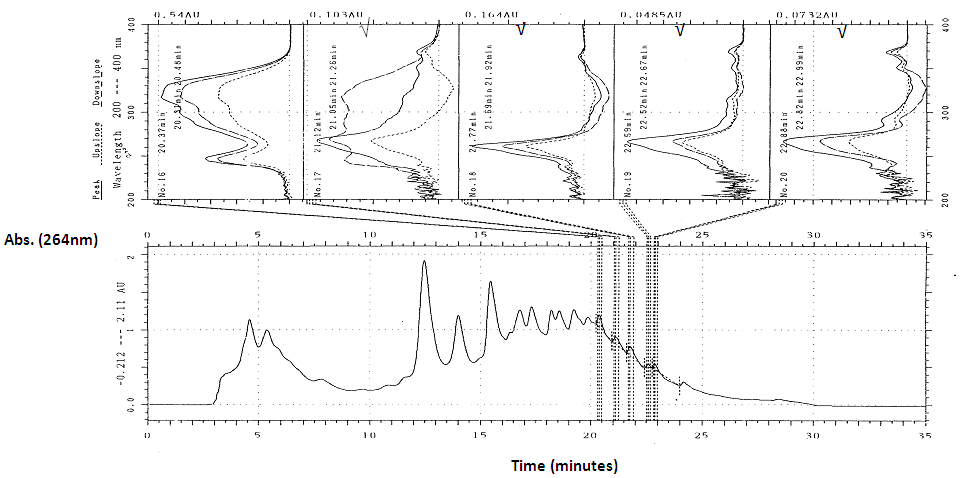 | Figure 1. HPLC scan of some compounds detected in D. alata crude extract with ‘in flight’ UV spectrum. (Ticked (√) spectrum refer to compounds that appear to be in the phenanthrenes, such as batatasin 1) |
3.2. Determination of Changes in Free Phenolics in D. rotundata Tubers through Dormancy and Sprouting
3.2.1. Weight of Tubers at Harvest and Duration from Planting to Sprouting in the Control
- The mean weight (±SE) of tubers harvested at 127 DAP was lower (53.6 g ± 8.39) than those at 176 DAP (165.5 g ± 14.3). The first external sign of sprouting was observed by 295 DAP, corresponding to the month of February. The mean duration from planting to sprouting was 313 ± 3.3 DAP and 310 ± 1.58 DAP for tubers harvested at 127 and 176 DAP respectively. Therefore, irrespective of date of harvest or tuber weight at harvest, tubers were observed to sprout at about the same time.
3.2.2. Colour Reaction Test for the Presence of Phenolic Compounds in Crude Extract
- All bands on TLC sheet, including those for Std. 1 and Std. 2, turned blue upon spraying with F+C reagent (Figure 2a) and the colour intensified when fumed with NH3 (Figure 2b). This suggests that the extracts in the bands were phenolic compounds [20]. The colour reaction with vanillin in H2SO4, was mostly pink. However, a number of other coloured bands ranging from blue, yellow to greyish blue were observed, and the quantity of some of these compounds varied with sampling date (Figure 3). The presence of the various colour bands indicate that the compounds in crude extract belong to different classes of phenolics [20].
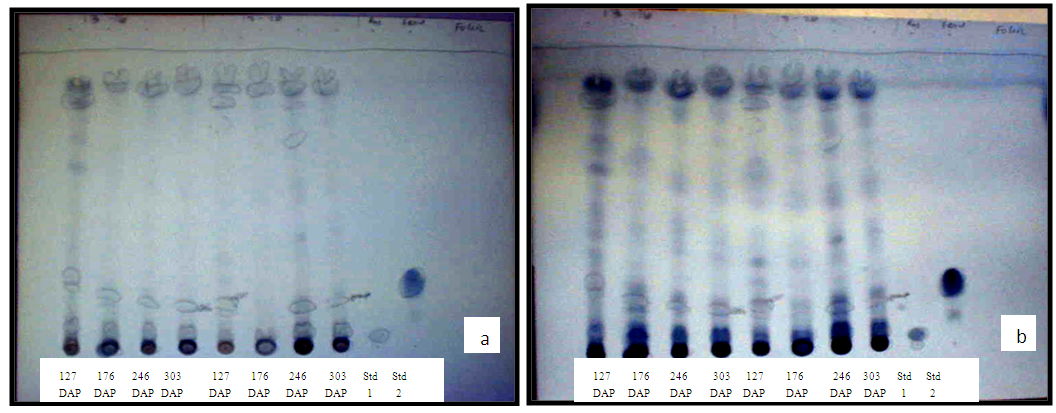 | Figure 2. Colour reaction test for the presence of phenolic compounds in bands separated on TLC. (a), blue upon spraying with F+C and (b), intensified colour upon fuming with NH3 |
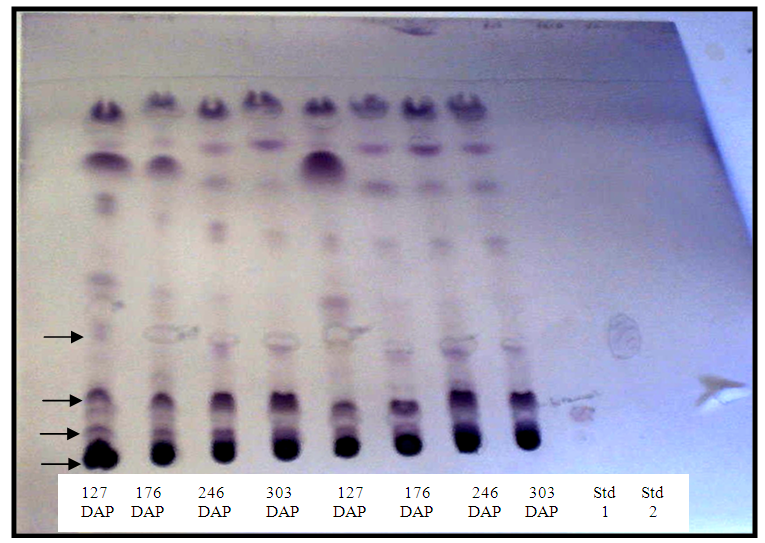 | Figure 3. Colour reaction test with vanillin/ H2SO4 reagent for the presence of various classes of phenolics in crude extract. Arrows point to some blue, yellow or greyish colour bands |
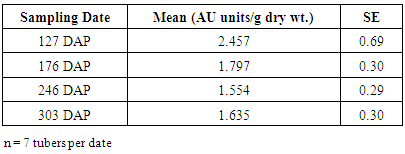
3.2.3. Changes in Tuber Dry Matter and Total Free Phenolics during Dormancy and Sprouting
- Dry matter content of freeze-dried samples varied significantly (p=0.003) with sampling date; increasing linearly from 127 to 246 DAP, and then declined by 303 DAP (Figure 4), when sprouting loci were seen on several tubers. The reverse was the case for mean free phenolics content (AU/g dry wt.). Tubers that were harvested prior to leaf senescence (127 DAP) contained about twice as much free phenolics as compared to those at 246 or 303 DAP (Table 1).
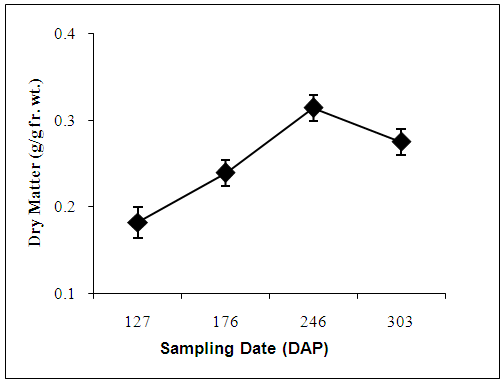 | Figure 4. Changes in mean dry matter content of freeze dried tuber tissue during dormancy (before sprouting) |
|
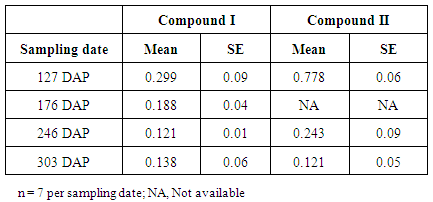
3.2.4. Changes in Individual Phenolic Compounds in Crude Extract
- The UV absorbance presented are those monitored at 264nm. The number of compounds eluted per sample varied from 15 to 23, and the peaks exhibited could be classified as either major or minor (Figure 5). Compounds were differentiated based on retention time (Rt) and UV absorbance spectrum. The change in concentration of individual compounds over sampling date was traced to determine any systematic changes.
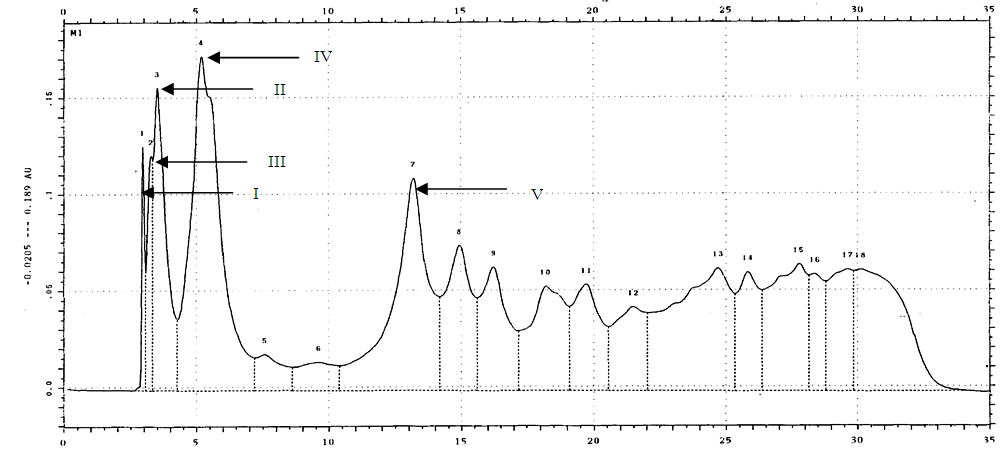 | Figure 5. Peak absorbance and retention times for phenolic compounds in D. rotundata crude extract. (Arrows point to peaks for Compounds I to V) |
|
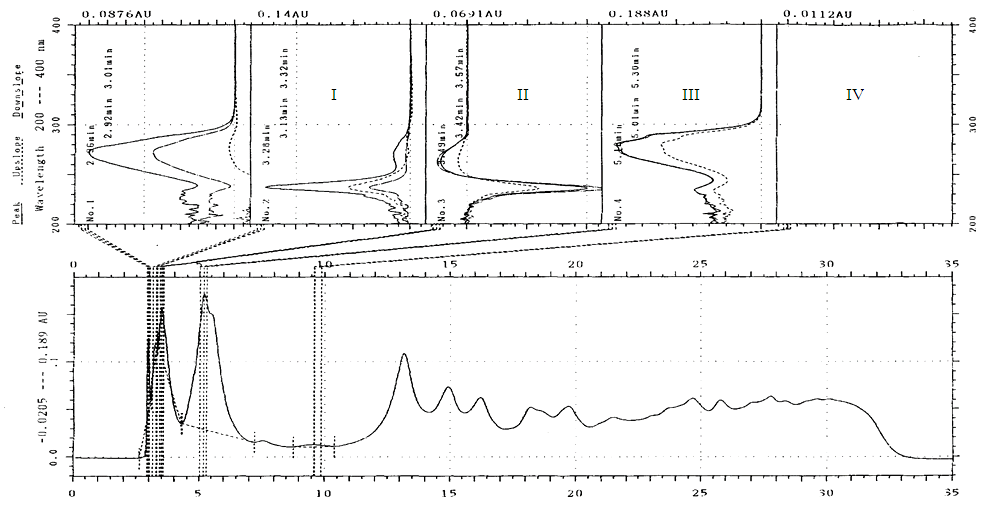 | Figure 6. UV spectrum scan for compounds I to IV with peak absorbance at 270 nm after 2.96 mins, 262 nm after 3.49 mins, 240 and 270 nm after 3.28 mins, and 272, 280, 288sh nm after 5.18 mins respectively |
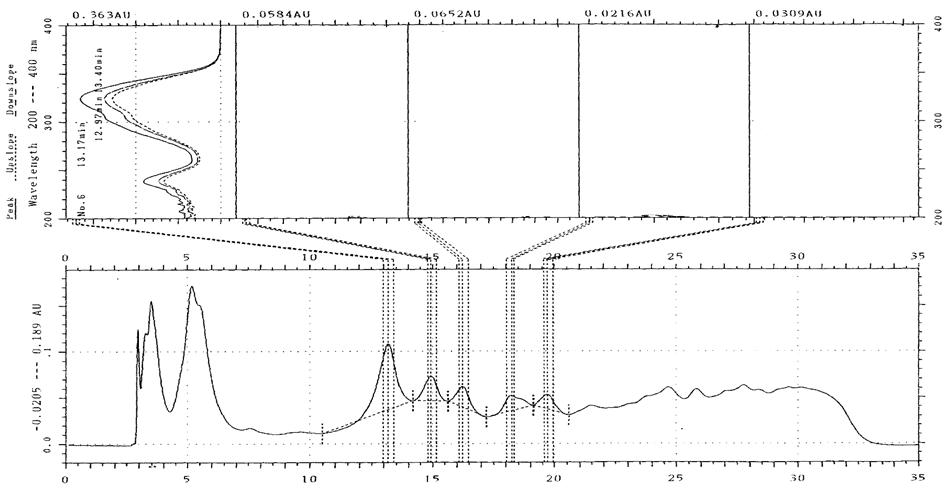 | Figure 7. UV spectrum scan for compound V. Peak absorbance was at 304, 324 nm after 13.17 mins |
4. Conclusions
- In summary, the level of phenolic compounds in D. rotundata is higher in developing tubers than at tuber maturity/ vine senescence. This suggests that developing tubers are already dormant. Whether they are involved in the initiation of dormancy, which begins at tuber formation or during tuber development rather than at that at vine senescence remains to be investigated. After harvest, the concentration of phenolics decline but no individual phenolic compound declined in any clear pattern in this study. It is therefore suggested that phenolics may be involved in the release of dormancy.
ACKNOWLEDGEMENTS
- The authors wish to acknowledge Prof. Nick H. Battey, Mrs. J. Greenham, and staff of Phytochemistry Laboratory, Department of Plant Science, University of Reading, UK.