-
Paper Information
- Paper Submission
-
Journal Information
- About This Journal
- Editorial Board
- Current Issue
- Archive
- Author Guidelines
- Contact Us
International Journal of Plant Research
p-ISSN: 2163-2596 e-ISSN: 2163-260X
2015; 5(1): 19-26
doi:10.5923/j.plant.20150501.04
Variability in Egusi-Melon Genotypes (Citrullus lanatus (Thumb) Matsum and Nakai) in Derived Savannah Environment in South-Eastern Nigeria
 Abstract
 Reference
 Full-Text PDF
 Full-text HTML
Ndukauba J., G. E. Nwofia, P. I. Okocha, E. E. Ene-Obong
Micheal Okpara University of Agriculture, Umudike, Nigeria
Correspondence to: G. E. Nwofia, Micheal Okpara University of Agriculture, Umudike, Nigeria.
| Email: |  |
Copyright © 2015 Scientific & Academic Publishing. All Rights Reserved.
Twenty-eight genotypes of egusi-melon collected from five ecological zones of Nigeria were evaluated to estimate the magnitude of genetic variability, relationship of some seed yield traits and contribution of seed yield components to seed yield. The results obtained showed a highly significant difference (P>0.01) among the genotypes for most of the traits studied. Seed weight (C.V=86.36%), pod weight (C.V=60.96%), number of pods (C.V=54.00%), and seed weight/pod weight ratio (C.V=57.09%) per plant were the more variable traits. Relatively high broad sense heritability (h2bs) was associated with seed weight (h2bs = 50.86%), number of pods (h2bs = 57.14%) and pod weight (h2bs = 51.46%) per plant. Highly significant (P>0.01) and positive correlation was obtained between seed weight and number of pods (r = 0.58) and pod weight (r = 0.57) and seed weight/pod weight ratio (r = 0.46) per plant indicating that seed weight per plant increased simultaneously with number of pods, pod weight and seed weight/pod weight ratio per plant. Pod weight, number of pods and seed weight/pod weight ratio perweight per plant. Pod number, pod weight and seed weight/pod weight ratio should be given adequate consideration in egusi-melon improvement programs.
Keywords: Variability, Egusimelon, Heritability, Genetic advance
Cite this paper: Ndukauba J., G. E. Nwofia, P. I. Okocha, E. E. Ene-Obong, Variability in Egusi-Melon Genotypes (Citrullus lanatus (Thumb) Matsum and Nakai) in Derived Savannah Environment in South-Eastern Nigeria, International Journal of Plant Research, Vol. 5 No. 1, 2015, pp. 19-26. doi: 10.5923/j.plant.20150501.04.
Article Outline
1. Introduction
- Egusi-melon [Citrullus lanatus (Thumb) Matsum and Nakai] is a crop that is widely cultivated in Nigeria (Anuebunwa, 2000). The seeds provide a well relished condiment for soup. The seeds are rich in vegetable protein, fat and vitamins (Adewusi et al., 2000). The seeds contain up to 50% oil and 35% protein and have both nutritional and cosmetic importance (Jack, 1972). Egusi-melon is an important income earner in the food economics of most farmers especially women (DSC., 2006). The crop provides excellent ground cover (Lal, 1995), reduces surface runoff, controls erosion and highly effective for weed suppression (Adewusi et al., 2000; Wang et al., 2006). The yield of the crop is unstable especially when planted late (Echebiri et al., 1990). It is important to improve the productivity of the crop per unit area so as to satisfy the demands of dietary needs and raw materials for industrial processing to edible oil and livestock feedstuff through vigorous breeding programs. The success of increasing the productivity of any crop through breeding largely depends on the presence of variability among the breeding materials (Adeyemo and Ojo, 1991). The choice of breeding programs depends on knowledge of the nature and magnitude of variations in the available materials, magnitude of association of characters with yield, extent to which these characters are heritable as well as extent of environmental influence on them (Srivastava and Saacham, 1973; Aruah et al., 2012).Various morphological and physiological characters contribute to yield. Each of these component characters has its own genetic systems. Further, these yield components are influenced by environmental fluctuations. Therefore, it is necessary to separate the total variations into heritable and non-heritable components with the help of genetic parameters such as genotypic and phenotypic coefficients of variation, heritability and genetic gain (Maniee et. al., 2009). Furthermore, knowledge of the association between yield and its components can improve the efficiency of selection in plant breeding (Izge et al., 2001). Traits that are specifically associated with yield may be used as indirect selection criteria to improve yield (Adeyemo and Ojo, 1991). Step-wise regression has been used by many researchers to access the relative contributions of yield traits to yield (Ogunbodede, 1989). The present study was undertaken to estimate the genetic variability, heritability, character association and the contribution of some yield characters towards seed yield in egusi-melon genotypes.
2. Material and Methods
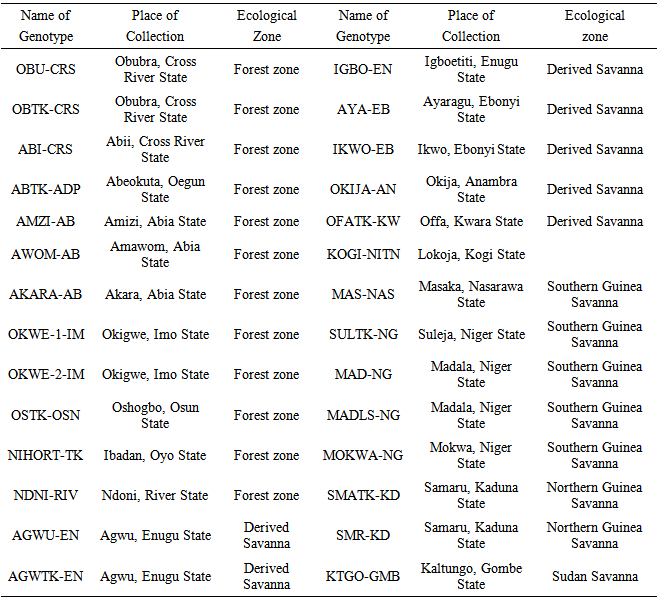
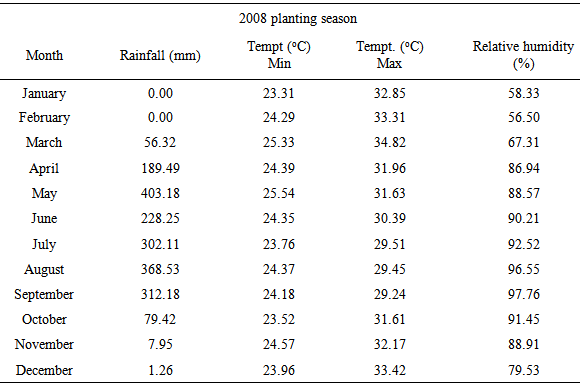
- The experimental material consisted of 28 genotypes of egusi-melon (Table 1) collected from different indigenous sources in five ecological zones of Nigeria. They were evaluated in early (March) and late (August) rainy seasons of 2008 in the research farm of Federal College of Agriculture, Ishiagu which is in the Derived Savanna Zone. Monthly rainfall distribution, relative humidity and temperature are presented in Table 2. The experimental design used was a randomized complete block design (RCBD) with four replications. Each block had twenty-eight plots measuring 4x5 m each. Planting was done at a spacing of 1m x 1m on the flat. Each plot had twelve plants of one genotype. Inorganic compound fertilizer, N. P. K 15: 15: 15 was applied at the rate of 400 kg per hectare two weeks after planting and weeding. Insecticide was applied twice to curtail insect (Pododrika spp.) attack of the young leaves. Weeding was done manually before flowering followed by rouging which was done during flowering to keep weed pressure low. The data collected comprised: number of primary branches, leading vine length, pod circumference, number of pods, pod weight, seed weight/pod weight ratio and seed weight. Seed weight/pod weight ratio expressed as percentage (proportion of dry seed to fresh fruit) is an important parameter that gives an idea of the amount of seed in a pod of egusi-melon. The ratio refers to the seed production of efficiency of egusi-melon. The higher the value, the more seed the pod is assumed to contain. Philips, 1964 reported that the proportion of dry seed to fresh fruit of egusi-melon was 2.0 – 2.75%. The values for the agronomic characters were taken as the mean value of the plants in a plot.
|
3. Data Analysis
- The data obtained were subjected to analysis of variance (ANOVA) to establish the level of variability among the egusi-melon genotypes using the MEAN, CORR and GLM procedures of SAS-STAT (1990) statistical software package (SAS Institute, Cary, NC). The phenotypic variation for each trait was partitioned into genetic and non-genetic factors and estimated according to (Sharma, 1988). Ve = MSe ; Vg = (MSg – MSe)/r ; Vp = Vg + VeWhere Vp, Vg and Ve are phenotypic variance, genotypic variance and environmental variance, respectively, and MSg, MSe and r are the mean squares of genotypes, mean squares of error and number of replications respectively. To compare the variations among traits, coefficient of variation (CV), phenotypic coefficient of variation (PCV), genotypic coefficient of variation (GCV) and environmental coefficient of variation (ECV) were computed according to Sharma, 1988; Allard (1960); Burton (1952):
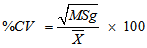
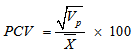
 Where
Where  is the grand mean for each of the traits measured. Broad sense heritability (h2bs) expressed as the percentage of the ratio of the genotypic variance (Vg) to the phenotypic variance (Vp) was estimated as described by Burton and De Vane (1953), Allard, (1960). Genetic advance (GA) was estimated by the methods of Fehr (1987) as GA = K(Sp)h2bs where K is a constant (2.06) at 5% selection intensity, Sp is the phenotypic standard deviation
  , h2bs is the heritability ratio. GA was also calculated as percentage of mean. Correlations and stepwise multiple regression analysis were done to examine inter-relationship among the traits as well as the contribution of each traits under study to seed weight respectively using the MEAN, CORR and GLM procedures of SAS-STAT (1990) statistical software package (SAS Institute, Cary, NC).
4. Results and Discussion
4.1. Genetic Variability
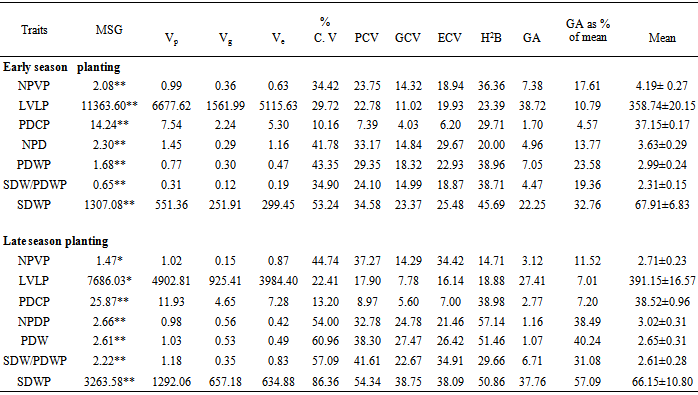
- Variability plays an important role in crop breeding. An insight into the magnitude of variability present in crop species is of utmost importance as it provides the basis for selection. The mean squares and genetic parameters of 28 genotypes of egusi-melon planted in the early and late rainy season of 2008 are presented in Table 3. The analysis of variance showed that the mean squares for the genotypes were highly significant (P<0.01) for all the traits under study in the early rainy season experiment. Similar results obtained in the late rainy season planting indicated that number of primary vines per plant and leading vine length per plant were found to be marginally significant (P<0.05) while pod circumference per plant, number of pods per plant, pod weight per plant, seed weight/pod weight ratio per plant and seed weight per plant were highly significant (P<0.01). The significant differences observed among the genotypes for all the traits in both early and late rainy season plantings suggest the existence of inherent genetic variability among the genotypes. Kehinde et al., (2008); Olaniyi et al., (2011) have earlier reported the existence of genetic variation among egusi-melon genotypes (Citrullus lanatus (Thumb.) Matsum and Nakai in respect to number of branches per plant, vine length per plant, number of pods per plant and seed yield per plant. Significant differences among crop genotypes have also been reported for crops like Cucumber (Afangiden and Uyoh, 2007) and Pumpkin (Aruah et al., 2011). Genetic variation in populations of crop species is important for successful selection and yield improvement programs (Idahosa et al., 2010).Presence of genetic variability in the breeding materials is essential for a successful plant breeding program. Coefficient of variation (%CV) compares the relative amount of variability between traits of crop plants (Sharma, 1988). In the early rainy season experiment, seed weight per plant obtained the highest (54.24%) coefficient of variation followed by pod weight per plant (43.35%) and number of pod weight per plant (41.78%) (Table 2). The results for the late plantings followed similar trend. The highest coefficient of variation was recorded for seed weight per plant (86.36%) followed by pod weight per plant (43.35%) and number of pods per plant (41.78%) (Table 2). These results suggest that seed weight per plant, pod weight per plant and number of pods per plant in that order had higher amounts of exploitable genetic variability among the attributes of egusi-melon studied. It also signifies that there is greater potential for favorable advance in selection in these attributes compared to others (Eid, 2009). Olaniyi et al., 2011 obtained similar result for seed yield per plant for egusi-melon genotypes planted early and late. Conversely, the least %CV was recorded for pod circumference per plant in both early (10.16%) and late (13.18%) plantings respectively which is indicative of low exploitable genetic variability as a result there is less potential for favorable advance in selection in this trait when compared to others. Similar result was also reported by Olaniyi et al., 2011 for pod circumference per plant. The phenotypic variances of the traits under study were partitioned into heritable (genotypic variance) and non-heritable (environmental variance) components in both early and late rainy season plantings (Table 2). The magnitude of environmental variances was higher than their corresponding genotypic variances for most of the traits. This is an indication that the environmental component of variation was the major contributor to total variation in the traits under study. The highest phenotypic coefficient of variation (PCV) was obtained by seed weight per plant (34.54%) followed by number of pods per plant (33.17%), pod weight per plant (29.35%) and seed weight/pod weight per plant while the least PCV was recorded by pod circumference per plant (7.39%) in the early season planting. Similar results obtained for late season planting showed that seed weight per plant (54.34%) obtained the highest PCV followed by seed weight/pod weight ratio per plant (41.62%), pod weight per plant (38.99%), number of primary vines per plant (37.27%) and number of pods per plant (32.78%) while the least value for PCV was recorded by pod circumference per plant (8.95%). High PCV is an indication of the existence of greater scope for selection of the trait under consideration which is dependent on the amount of variability present (Knan et al., 2009). Thus a greater potential is expected in the selection for seed weight per plant, number of pods per plant, pod weight per plant and seed weight/pod weight ratio per plant among the egusi-melon genotypes under study while there is a narrow scope for selection for pod circumference on account of low amount of variability among the egusi-melon genotypes studied. Genotypic coefficient of variation (GCV) provides a measure of genetic variability present in various quantitative traits. The highest amount of GCV was obtained by seed weight per plant (23.37%) followed by pod weight per plant (13.32%), seed weight/pod weight ratio per plant (14.99%) and number of pods per plant (14.84%) in the early season planting. Similarly, the results obtained in the late season planting showed that seed weight per plant (38.09) recorded the highest GCV seed weight/pod weight ratio per plant (22.67%) while the least GCV was recorded for pod circumference per plant (5.59%). High GCV indicates the presence of exploitable genetic variability for these traits which may facilitate selection (Yandav, 2009). The environmental coefficient of variation (ECV) ranged from 6.99% obtained for pod circumference per plant in the late season planting to 38.75% recorded for seed weight in the late planting. Polygenic variation may be phenotypic, genotypic or environmental and the relative values of these three coefficients for a trait will give an idea about the magnitude of its variability (Nausherwan et al., 2008).
4.2. Heritability
- Heritability provides an idea of the extent of genetic control for the expression of a particular trait and the reliability of phenotype in predicting its breeding value (Chopra, 2000). High heritability indicates less environmental influence in the observed variation (Mohanty, 2003; Eid, 2009). Heritability in the broad sense (h2bs) indicates only whether there is sufficient genetic variation present in a population or not, which implies whether a population will respond to selection pressure or not (Milatovic et al., 2010). In the early season planting experiment, relatively high broad sense heritability (h2bs) was recorded for seed weight per plant (45.69%) while a relatively moderate value was obtained by pod weight per plant (38.96%), seed weight/pod weight ratio per plant (38.71%) and number of primary vines per plant (36.36%) (Table 2). The results recorded for late season planting experiment followed similar trend with number of pods per plant (57.14%) having the highest value for broad sense heritability which was followed by and pod weight per plant (51.46%) while pod circumference per plant (38.98%) was associated with a moderate value. These results indicate that there is considerable genetic variation present in these traits to warrant selection for better genotypes. These traits can therefore be accorded special attention in selections aimed at egusi-melon improvement. In other to access the selection effect on a trait more effectively, heritability accompanied with genetic advance is more useful than heritability alone (Johnson et al., 1955). In the present study, even though high to moderate broad sense heritability (h2bs) estimates were recorded for most of the traits in both early and late season plantings, they were however associated with low genetic advance (GA) (Table 2). The high to moderate heritability observed might be due to the favorable influence of the environment rather than the genotype, and simple selection will not be rewarding. However, these traits could be improved by the development of hybrid varieties or the isolation of transgressive segregants in heterosis. High heritability and high genetic advance for a given trait indicates that it is governed by additive gene action and, therefore provides the most effective condition for selection (Tazeen et al., 2009). Leading vine length (GA = 38.72%) and seed weight per plant (GA = 37.76%) were not only associated with a relatively high broad sense heritability, they also obtained a relatively high genetic advance (Table 2). This result suggests that the variation in leading vine length and seed weight per plant was mainly genetic with less environmental influence playing a role in the expression of the traits coupled with the prevalence of additive gene action in their inheritance (Panse, 1957).
|
|
4.3. Correlation and Stepwise Regression
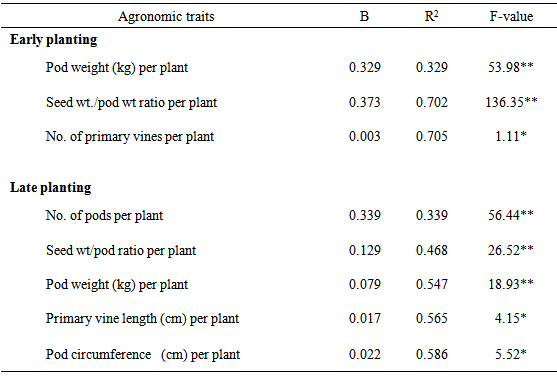
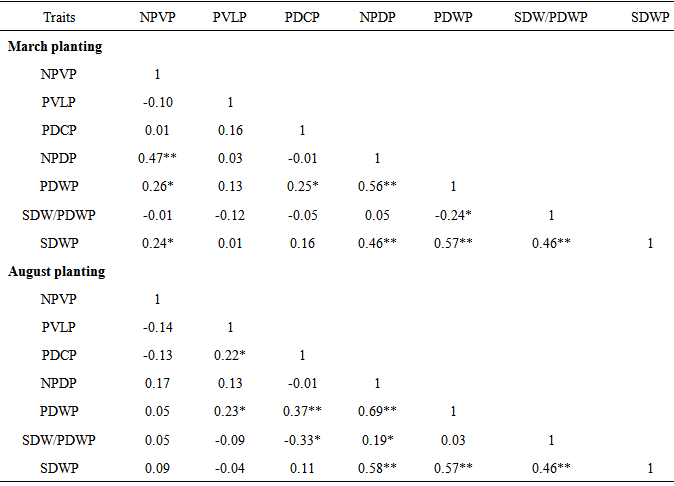
- Yield in crop plants is quantitative in nature and is polygenetically controlled (Singh et al., 1977) and greatly influence by the environment (Lawrence, 1968). Correlation of particular traits with other traits and with yield is important in indirect selection of genotypes for yield improvement (Machikowa and Laosuwan, 2011). Significant and positive correlation between two characters suggests that these characters can be improved simultaneously in a selection programme (Hayes et al., 1955). This is because it shows mutual relationship among characters and selection for one will translate to selection and improvement of the other (Fayeun et al., 2012). The results of the correlation coefficient among some agronomic traits of egusi-melon are shown in Table 4. In the early season planting experiment, number of primary vines per plant was positively and highly significantly (P<0.01) correlated with number of number of pods per plants (r = 0.47**) and pod weight per plant (r = 0.56**). The significant positive correlation between number of primary vines per plant and number of pods per plant suggests that plants with more number of primary vines will produce more pods. The result for early season planting experiment further showed that number of pods per plant (r = 0.58**), pod weight per plant (r = 0.57**) and seed weight/pod weight ratio per plant (r = 0.46**) was positively and highly significantly (P< 0.01) correlated with seed weight per plant. These results suggest that plant with more pods, high pod weight and high seed weight/pod weight ratio will produce plants with an equally high seed weight. The results obtained for the late planting followed similar trend (Table 4). Number of pods per plant was positively and highly significantly (P<0.01) correlated with pod weight per plant (r = 0.69**). Number of pods per plant (r = 0.58**), pod weight per plant (r = 0.57**) and seed weight /pod weight ratio per plant (r = 0.46**) were positively and highly significantly (P < 0.01) correlated with seed weight per plant. Kehinde and Idehen (2008) obtained similar results between seed yield per plant and number of fruits per plant in egusi-melon. Correlation analysis measures mutual association with no regard to their relative importance. Stepwise regression analysis identifies the best subset of predictors and the order in which variables were included in the regression equation. The order tells us the relative importance of the predictors, which is best predictor, second best etc. Stepwise regression is therefore designed to find the most parsimonious set of predictors that are most effective in predicting the dependent variables. The results of the stepwise regression analysis for early and late plantings are in Table 5. The results for early season planting experiment show that pod weight per plant followed by seed weight/pod weight ratio per plant are the best predictors of seed weight per plant. Similarly, the results obtained for late season planting experiment show that number of pods per plant followed by seed weight/pod weight ratio per plant and pod weight per plant in that order are the best predictors of seed weight per plant. These results suggest that number of pods, pod weight and seed weight/pod weight ratio per plant are the major contributors to seed weight variance and should therefore be given serious consideration in egusi-melon programs.
|
|