-
Paper Information
- Paper Submission
-
Journal Information
- About This Journal
- Editorial Board
- Current Issue
- Archive
- Author Guidelines
- Contact Us
International Journal of Plant Research
p-ISSN: 2163-2596 e-ISSN: 2163-260X
2014; 4(2): 43-50
doi:10.5923/j.plant.20140402.01
Optimization of the Polyphenolics Extraction from Chamomile Ligulate Flowers Using Response Surface Methodology
 Abstract
 Reference
 Full-Text PDF
 Full-text HTML
Zoran Zeković , Aleksandra Cvetanović , Branimir Pavlić , Jaroslava Švarc-Gajić , Marija Radojković
Department of Biotechnology and Pharmaceutical Engineering, Faculty of Technology, University of Novi Sad, Bulevar Cara Lazara 1,21000 Novi Sad, Serbia
Correspondence to: Aleksandra Cvetanović , Department of Biotechnology and Pharmaceutical Engineering, Faculty of Technology, University of Novi Sad, Bulevar Cara Lazara 1,21000 Novi Sad, Serbia.
| Email: |  |
Copyright © 2014 Scientific & Academic Publishing. All Rights Reserved.
Different extraction conditions may significantly influence extraction of particular compound groups. In present study response surface methodology (RSM) based on Box-Behnken design was used to define the best combination of extraction temperature (40-80°C), ethanol concentration (50-90%) and extraction time (30-90 min) for maximum yield of antioxidant compounds and maximum antioxidant activity of chamomile ligulate flowers (CLF) extracts. Experimental values of total extraction yields were in the range from 9.36 to 32.02 %. Content of phenolic compounds varied in the range between 35.55 and 57.35 mg/g, whereas the flavonoids were detected in the range from 14.06 to 26.31 mg/g. Antioxidant activity expressed as the 50% inhibition concentration (IC50 value) was in the range from 0.014 to 0.278 mg/mL. The experimental results were fitted to a second order quadratic polynomial model and they have shown a good fit to the proposed model (R2>0.90). Determined optimized conditions for maximizing yield of antioxidant compounds were withing the experimental range. Validation of the model confirmed that experimental values agreed with those predicted, thus indicating suitability of the used model and the RSM approach in optimizing the extraction conditions.
Keywords: Chamomila, Antioxidant activity, Phenols, Flavonoids, Response surface methodology (RSM)
Cite this paper: Zoran Zeković , Aleksandra Cvetanović , Branimir Pavlić , Jaroslava Švarc-Gajić , Marija Radojković , Optimization of the Polyphenolics Extraction from Chamomile Ligulate Flowers Using Response Surface Methodology, International Journal of Plant Research, Vol. 4 No. 2, 2014, pp. 43-50. doi: 10.5923/j.plant.20140402.01.
Article Outline
1. Introduction
- In last decades, focus on medicinal plant research increased all over the world. In traditional medicine, plant formulations and combined extracts of plants are used for the treatment of a wide variety of diseases [1]. Plants have been identified as source of various phytochemicals, which possess a range of benefits to human health. Many of these plants have been tested for their antioxidant activities, and results have shown that some crude extracts or isolated pure compounds from them were more effective antioxidants in vitro than BHT or vitamin E [2-4]. Taking this into account, medicinal plants can be regarded as a potential source of natural antioxidants [5]. Their extraction from plant material is very important step in the manufacture of products enriched with phytochemicals. The knowledge on factors influencing the process conditions is necessary to enhance the extraction efficiency for any bioactive compound. Many factors such as solvent composition, time of extraction, temperature, pH, particle size, etc., may significantly influence the solid-liquid extraction [6-13]. Response Surface Methodology (RSM) is a collection of statistical and mathematical methods useful for developing, improving, and optimizing processes [14]. It is effective for optimization of complex processes because it allows efficient and easier interpretation of experiments. Several authors already employed RSM for the optimization of extraction process in order to maximize yield of various polyphenolic compounds from various sources [15-17]. Among other RSM is being used for optimization the extraction of phenolic compounds from black and white mulberry [18], from the extract of hawthorn (Crataeguslaevigata) [19], Pyracantha fortuneana fruit [20]. RSM proved effective due to its ability to analyze effects of independent variables and their mutual interactions on investigated responses.Matricariarecutita L., commonly known as German chamomile, has a long history of application in herbal medicine. For thousands of years extracts of this plant have been used by folk healers to treat wounds, ulcers, skin irritations, neuralgia, rheumatic pain, gastrointestinal upset, and a vast number of other ailments [21-24]. The plant is used in different commercially available forms such as tea, infusion, and dietary supplements. Several studies have been carried out in order to evaluate the antioxidative potential of this plant. Essential oil, ethanolic extracts, and infusions of chamomile have been tested, and all of them exhibited antioxidative activity [25]. This antioxidant benefit of chamomile is associated with several groups of active components. Among other, polyphenols from this plant possess strong antioxidant activity.The objective of the present study was to investigate the effects of the extraction temperature, ethanol concentration and extraction time on antioxidative capacity of extracts prepared from chamomile ligulate flowers (CLF), and to optimize the extraction parameters with a consideration of three responses by applying RSM. Additionally, verification of calculated optimal conditions was done.
2. Material and Methods
2.1. Chemicals and Reagents
- 1,1-Diphenyl-2-picryl-hydrazyl-hydrate(DPPH), Folin – Ciocalteu reagent, chlorogenic acid and rutin were purchased from Sigma-Aldrich (St. Louis, Missouri, USA). Aluminium chloride hexahydrate, sodium carbonate, and sodium acetate trihydrate were produced from Merck (Darmstadt, Germany). All other chemicals and reagents were analytical reagent grade.
2.2. Sample Preparation
- In this study white ligulate flowers of chamomile (CLF) were used. Flowers were produced by the Institute of Field and Vegetable Crops, Bački Petrovac, Serbia. Plant material was collected in spring 2011. Extraction process was done with dry plant material. Drying was carried out in solar dryer at temperature of 40°C and was finished when the moisture of the plant material was approximately 12%. Ligulate flowers were separated from other parts by sifting through sieves and, after that, CLF were packed in paper bags and stored in the dark at room temperature until use.Plant samples were extracted at different temperature (40, 60 or 80°C), using ethanol as a solvent in a different concentration (50, 70 or 90%) and during different extraction time (30, 60 or 90 min). Sample-solvent ratio was 1:50 (w/v) for all experiments. Obtained liquid extracts were stored at 4°C until analysis.
2.3. Determination of Total Extraction Yield
- In order to determine the the total extraction yield, certain volume of liquid extracts were evaporated (Devarot, Elektromedicina, Ljubljana, Slovenia) under vacuum. After removing the solvent, drying was performed at 105°C to the constant mass. Further calculating of total extraction yield was done according to procedure described in pharmacopoeia (Ph. Jug. V) [26].
2.4. Determination of Antioxidant Components
- Total phenols content was determined spectrophotometrically according to the Folin-Cicolteu colorimetric assay [27, 28]. Chlorogenic acid was used as a standard and the results were expressed as mg of chorogenic acid equivalent (CAE) per g of dry plant material (mg CAE/g). Absorbance was measured at 750 nm, using a JANWAY 6300 VIS-spectrophotometer.Total flavonoids content was determined by aluminium chloride colorimetric assay [29] using rutin as a standard. The results were expressed as mg of rutin equivalents (RE) per g of dry plant material (mg RE/g). Absorbance was measured at 430 nm, using a JANWAY 6300 VIS-spectrophotometer.
2.5. DPPH Assay
- The capacity to scavenge the “stable” free radical 2,2-diphenil-1-picrylhydrazyl (DPPH) was monitored according to the method of Espin [30]. Solution of 90 μM DPPH in methanol (95%) was prepared and 1 ml was added to 3 ml of diluted liquid extract. Absorbance was measured 60 minutes later at 515 nm. Blank was prepared using water instead of CLF liquid extract. Radical scavenging capacity (%RSC) was calculated by the following Eq. (1):
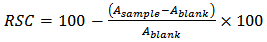 | (1) |
2.6. Experimental Design
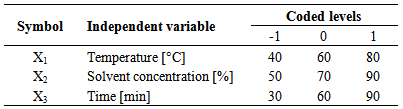
- RSM is a useful technique for developing, improving and optimizing processes. The most extensive application of RSM is in the industry, particularly when several input variables influence some performance measure or quality characteristic of the product or process. This performance measure or quality characteristic is called the response [31].After determining the preliminary ranges of independent variables, Box-Behnken experimental design was adopted in this optimization study. The extraction temperature, ethanol concentration, and extraction time were applied as independent variables. The range of those variables and their levels are presented in Table 1.
|
 | (2) |
3. Results and Discussion
3.1. Response Surface Models
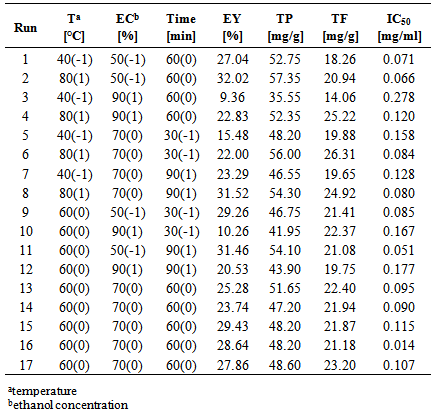
- During this study, the target compounds of the extraction process were total phenols (TP) and total flavonoids (TF), and the targeted activity was antioxidant capacity, i.e. IC50 value. Moreover, total extraction yield (EY) was also observed. In order to explore the functional relationship between inputs (extraction temperature, solvent concentration and extraction time) and outputs (extraction yield, target compounds and target activity) RSM was applied. Obtained experimental results of EY, TP and TF content, as well as IC50 values, are shown in Table 2.
|
|
|
3.2. Effects of Temperature, Solvent Concentration and Extraction Time on Investigated Response Parameters
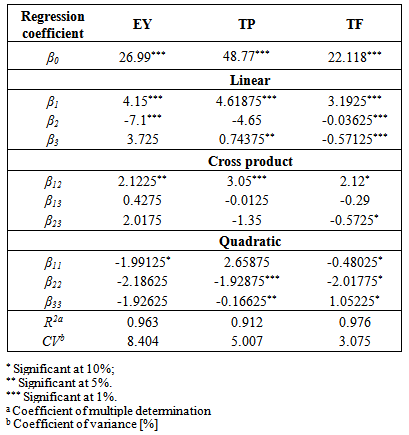
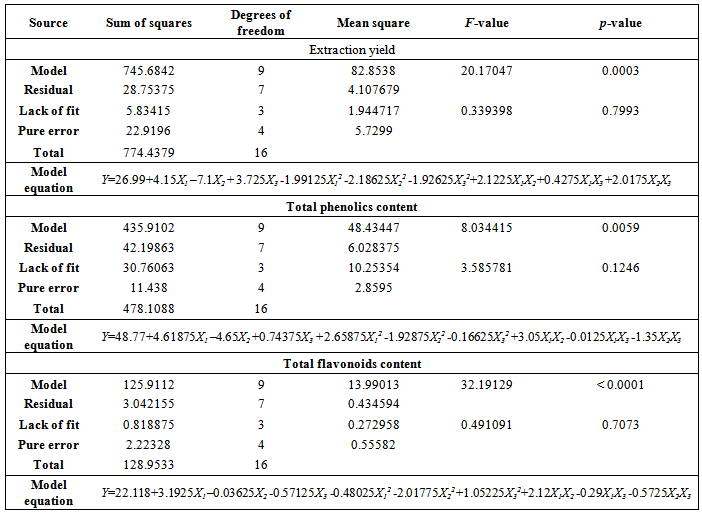
- In case model equation for EY, linear terms of temperature and ethanol concentration have significant influence (p<0.01). Temperature exhibited positive influence which could be explained with heat influence on softening of the plant tissues and increasing diffusivity of the extraction solvent into cells. Elevated temperature also reduces solvent viscosity and surface tension and hence to promote the extraction of soluble compounds [33]. Negative effect of ethanol concentration was also expected due to decrease in polarity for higher ethanol concentrations. Lower ethanol concentration contribute to higher EY, however these were not in direct correlation with antioxidant activity of obtained extracts.Since most of the compounds in the plant material are hydrophilic, extracts obtained with lower ethanol concentrations will have high content of concomitant compounds which does not possess high antioxidant capacity. Interaction between temperature and ethanol concentration showed significant influence on the EY. Positive effect could be explained with the moderate polarity and modified physical properties (viscosity and surface tension) of the extraction solvent at elevated temperatures. These changes increase its capacity for extraction. Quadratic term of temperature exhibited negative effects which suggest that EY will reach the saddle point at certain temperature which the yield starts to decrease. Lower EY at very high temperature is probably due to degradation of extractable compounds and possible formation of aggregates.Efficiency of extraction process is influenced by multiple parameters. The best way of expressing the effects of different extraction parameters on polyphenolic compounds content and antioxidant activity was to generate response surfaces of the model [18]. The 3D response surface plots are the graphical representations of regression equations. They provide a method to visualize the relationship between responses and experimental levels of each variable and the type of interactions between two test variables. The shapes of the plots indicate whether the mutual interactions between the variables are significant or not [34]. Figure 1A shows the 3D surface plots of the interactive effects of the independent variables corresponding to the extraction yields (EY). It can be seen that increase in solvent concentration leads to reduction of EY. On the other hand EY increasing with temperature up to about 75°C. Further increase of temperature leads to reduction of EY. The same situation can be observed with the extraction time. The yields increase with time, but after 65 minutes of extraction, amount of extracted matters decreases.In general terms, the extraction efficiency of phenolic compounds is a function of several process variables. Many authors reported the influence of different variables on the extraction of phenols. Among others, the most important factors influencing the recovery of phenols from plant material are solvent type, temperature and contact time. The positive or negative effects of each variable on the mass transfer phenomenon is specific and it is not always obvious [35]. In presented research and derived modellinear and cross product term of temperature (p<0.01) had significant influence on phenol extraction. However, cross product term of ethanol concentration showed negative effect. On the other hand linear term and quadratic term of extraction time showed significant influence (0.01<p< 0.05). Influence of parameters on TP content was visualized by the chart (Figure 1B). From the chart it is obvious that increase in ethanol concentration up to approximately 60% leads to higher yields for TP, while further increase of solvent concentration causes the decrease of the output value. Considering the fact that the extraction efficiency of the phenolic compounds decreases when using 90% ethanol, due to the number of hydroxyl groups in phenols that are rather hydrophilic, and as such generally more soluble in water-ethanol solutions, those results were expected. In terms of temperature influence, figure 1B shows that with extraction temperature the yield of TP increased. This result is supported with a claim that temperature generally shows positive effects on extraction of antioxidant compounds. Also, a linear increase of TP with extraction time could be observed.All linear terms of process variables had highly significant influence on TF (p<0.01). Temperature effect was once again positive, while other two variables had negative effects. Elevated temperature modifies polarity of the solvent and increases the solubility of flavonoid compounds in the extraction solvent [36]. Although, linear effects of ethanol concentration and extraction time were significant, they were still minor comparing to the temperature. These effects suggested that less polar solvent (90% ethanol) would not be suitable as 50% or 70% ethanol. Prolonged extraction time could lead to degradation of some flavonoid compounds due to prolonged exposure to environment factors such as light and oxygen [33, 37]. Reduction in extraction time could be significant for technological aspect of the process because it can result in time and cost saving [38]. Temperature-ethanol concentration and temperature-time interaction showed significant cross product effects. Positive effect of temperature-ethanol concentration represented interactive influence between variables where temperature improves solvent properties and increases affinity to desirable group of compounds. However, temperature-extraction time interaction suggests that elevated temperature could produce undesirable effects which probably come from chemical modifications of compounds present in crude extracts. Quadratic terms of all three variables had significant influence. The negative quadratic effect of extraction time confirmed the deceleration in the extraction yield, as Fick’s second law of diffusion predicts a final equilibrium between the solute concentrations in the solid matrix and in the bulk solution after a certain time [15].The relationships between independent variables and TF were illustrated in three-dimensional graphs (Figure 1C). As it can be seen from the figure the amount of TF increased linearly with of temperature. With the increase of ethanol concentration up to approximately 75% increase of the TF was observed, while further increase caused the decrease of the output value. This indicated that there is a saddle point near 75% ethanol concentration.
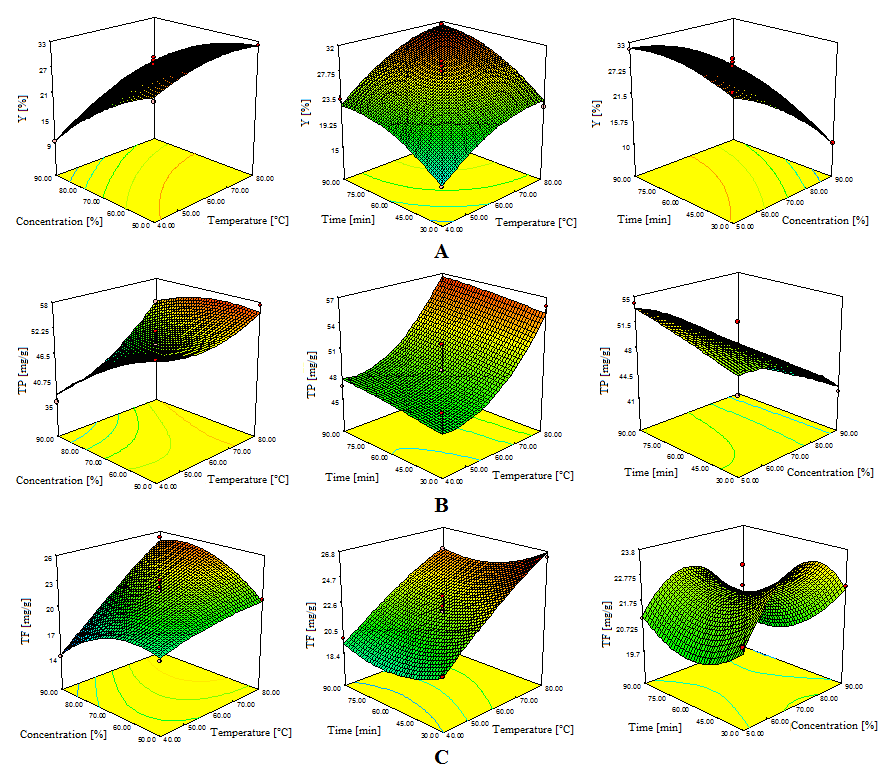 | Figure 1. Response surface plots showing effects of investigated parameters on: A-extraction yields, B-phenolics contents, C-flavonoids contents |
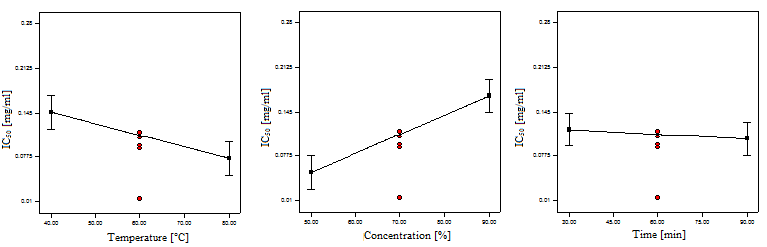 | Figure 2. Linear Influences of Independent Variables on IC50 Value |
3.3. Verification of Experiments
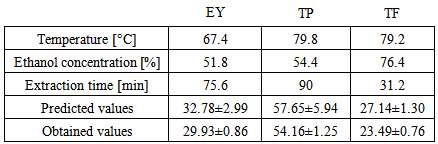
- The final step in this research was the verification of suitability of the defined model equation. By using RSM total extraction yield (EY) and antioxidant compounds (TP, TF) were optimized. Optimized system was developed for each of response Results of optimized parameters, predicted and observed values are reported in Table 5. All experiments were done at triplicate.
|
4. Conclusions
- High yield of extraction process is very important goal, especially for large-scale industrial applications. Considering the great role of antioxidants, there is increasing number of studies oriented towards the production of antioxidant-rich products. Polyphenolic compounds are recognized as one of the most important antioxidants. In order to produce extracts with high level of total phenols, total flavonoids and antioxidant activity, extraction of chamomile ligulate flowers (CLF) was successfully optimized by response surface methodology (RSM). Optimal extraction parameters defined by this approach for all target compounds were validated. In two of three cases, experimental results were close to the predicted calculated, confirming the validity and adequacy of the proposed models. Considering the fact that this is the first report on optimizing extraction technology of antioxidant compounds of CLF, these results can be useful for developing new CLF-based products.
ACKNOWLEDGMENTS
- Financial support of this work by the Serbian Ministry of Education, Science and Technological Development, Project No. TR 31013 is greatfully acknowledged. We are greateful to Dr Dušan Adamović, Institute of Field and Vegetable Crops, BačkiPetrovac, Serbia, for his support in supplying plant material.