-
Paper Information
- Paper Submission
-
Journal Information
- About This Journal
- Editorial Board
- Current Issue
- Archive
- Author Guidelines
- Contact Us
International Journal of Plant Research
p-ISSN: 2163-2596 e-ISSN: 2163-260X
2013; 3(2): 9-16
doi:10.5923/j.plant.20130302.01
Physiological Responses of Some Plant Species as a Bio-Indicator of Roadside Automobile Pollution Stress Using the Air Pollution Tolerance Index Approach
 Abstract
 Reference
 Full-Text PDF
 Full-text HTML
Pravin U. Singare1, Madhumita S. Talpade2
1Department of Chemistry, Bhavan’s College, Munshi Nagar, Andheri (West), Mumbai, 400058, India
2Department of Chemistry, J.J.T.University, Jhunjhunu, Rajasthan, 333001, India
Correspondence to: Pravin U. Singare, Department of Chemistry, Bhavan’s College, Munshi Nagar, Andheri (West), Mumbai, 400058, India.
| Email: |  |
Copyright © 2012 Scientific & Academic Publishing. All Rights Reserved.
The study examined Air Pollution Tolerance Indices (APTI) of four plant species grown along the road side of Bhavan’s College campus of Andheri, Mumbai and compared with unpolluted area of college Botanical garden. The results of the present study indicates that forPollyalthia longifolia, the percentage increase in APTI values was low of 2.64 in winter, moderate of 3.79 in summer, while maximum of 6.78 in rainy season. For Caesalpinia pulcherrima, the percentage increase in APTI value was low of 5.86 in rainy season, high of 8.18 in summer and still higher of 8.22 in winter. For Delonix regia, the percentage increase in APTI values varies from minimum of 7.10 in rainy season to maximum of 24.57 in winter, while in summer the percentage increase was found to be 16.33. In case of Tamarindus indica, the percentage increase in APTI value was found to be 19.59 (maximum) in winter, 12.71 in rainy, while in summer season it was 11.57 (minimum). The results of the present study indicate the order of tolerance as Pollyalthia longifolia (4.40 %) > Caesalpinia pulcherrima (7.42 %) > Tamarindus indica (14.62 %) > Delonix regia (16.00 %).
Keywords: Physiological Responses, Air Pollution Tolerance Index (APTI), Biochemical Parameters, Ascorbic Acid Content, Chlorophyll Content, pH, Relative Water Content, Bio-Indicator, Pollution Stress, Plant Species
Cite this paper: Pravin U. Singare, Madhumita S. Talpade, Physiological Responses of Some Plant Species as a Bio-Indicator of Roadside Automobile Pollution Stress Using the Air Pollution Tolerance Index Approach, International Journal of Plant Research, Vol. 3 No. 2, 2013, pp. 9-16. doi: 10.5923/j.plant.20130302.01.
Article Outline
1. Introduction
- Plants which are an important part of all ecosystems play a crucial role in monitoring and maintaining the ecological balance by actively participating in the cycling of nutrients and gases like carbon dioxide, oxygen. They are most likely to be affected by airborne pollutants, and the effects are widely observed on the leaves which are usually the most abundant and most obvious primary receptors of large number of air pollutants. The plants provide enormous leaf area for impingement, absorption and accumulation of air pollutants to reduce the pollution level in the air environment[1]. Since air pollutants affect germination of seeds, length of pedicles, and, number of flowers in inflorescence[2], the plant species can be used as a biomonitor to evaluate the impact of air pollution. The direct impact of air pollutants on the plants can be seen on leaves, while the indirect effect can be seen through soil acidification[3]. The previous studies on the effect of air pollution have reported the physiological changes in plant before exhibiting visible damage to leaves[4]. The studies also reported the air pollution impact on Ascorbic acid content[5] chlorophyll content[6], leaf extract pH[7] and relative water content[8]. These separate parameters have indicated contrasting results for same species[9]. However, the air pollution tolerance index (APTI) calculated by considering all the four parameters have been used for identifying tolerance levels of plant species[10-12]. Previous researchers have reported the visible and non visible effects of automobile exhaust on road side vegetation[13]. The studies have pointed gradual disappearance of chlorophyll and concomitant yellowing of leaves, which may be associated with a consequent decrease in the capacity for photosynthesis[14]. Some researchers have ranked the different plant species in order of tolerance to air pollution based on Air pollution tolerance[15, 16]. In the present study, we aim to evaluate air pollution tolerance of four plant species growing in the vicinity of Bhavan’s College Campus, Andheri, by using the Air Pollution Tolerance Index (APTI) method during the growing season, from the hot summer to the cooler autumn months. Thus we could analyze seasonal variation of the parameters which influence pollution tolerance. The APTI determinations of the present investigation are of importance because with increase urbanization, there is increasing danger of deforestation due to air pollution. Thus APTI results of the present investigation are therefore handy for future planning of air pollution control.
2. Materials and Methods
2.1. Study Area
- The study was carried out in Bhavan’s College campus of Andheri, which is located at one of the most populated and industrialized city of Mumbai, India. The city is situated between 18° 96’ north latitude and 72° 81' east longitude. Climate is subtropical, with mild winters and warm summers. The weather is typical coastal sultry and humid. The city receives average rainfall in the range of 1500 mm to 2000 mm. The place experiences the onset of the monsoon in the month of June and experiences monsoon till the end of September. The average temperature recorded is between 25 to 37℃.
2.2. Study of Biochemical Parameters
- The study was carried out during June 2011 to May 2012 for three seasons i.e. summer, winter and rainy season, to understand the seasonal impact of air pollution on different plant species grown around the Bhavan’s College Campus. For the study plants of four different species namely Pollyalthia longifolia, Caesalpinia pulcherrima, Delonix regia and Tamarindus indica were selected from the immediate vicinity of campus which are exposed to road side automobile pollution stress and referred as experimental site (ES). A botanical garden site nearby, the college campus, with similar ecological conditions was selected as the control site (CS). The plants used for the study at control site where same as those available at the experiment site with similar light, water and soil conditions. Three replicates of fully matured leaves were taken and immediately taken to the laboratory for analysis. Samples were quickly transported to lab in a heat proof container. Dry weight (DW) was taken instead of fresh weight to express ascorbic acid content and total chlorophyll content referring to the previous method[1]. Leaf fresh weight was taken immediately upon returning to the lab. Samples were preserved in a refrigerator for further analyses. The relative leaf water content (RWC)[12] and total chlorophyll content (TCh)[17] was determined by following the previous methods. To get leaf extract pH, about 4 g of fresh leaf was homogenized in 40 mL deionized water and centrifuged at 2,500 rpm for 3 min. Extract pH was measured using pH meter which was calibrated using the buffer solutions of pH 4 and pH 9. Furthermore, ascorbic acid content (AA) expressed in mg/g DW was measured using the spectrophotometric method by measuring the absorbance of supernatant at 520 nm[18].
2.3. APTI Determination
- The air pollution tolerance index (APTI) was computed by using the equation[1, 12]APTI =[AA (TCh + pH) + RWC] ÷10Where AA = Ascorbic acid content (mg/g),TCh = total chlorophyll (mg/g),pH = pH of leaf extract, andRWC = relative water content of leaf (%).Based on the APTI values calculated by using the above formula, the plant species were classified as sensitive species having value < 10, intermediate species for the values > 10 but < 16 and tolerant species having APTI values >17.
3. Results and Discussion
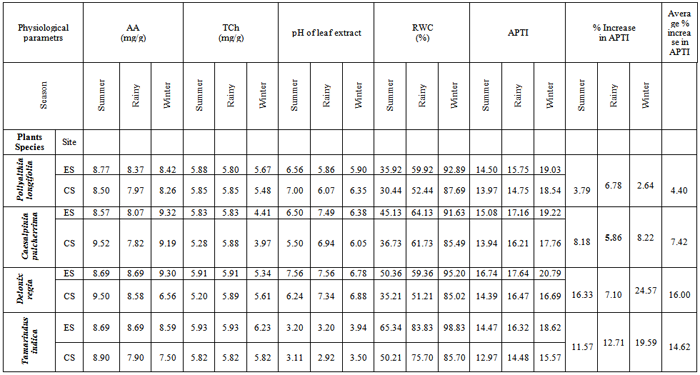
- Air Pollution Tolerance Index (APTI) is calculated for four plant species growing along the Bhavan’s College of Andheri city of Mumbai, India, and the data is presented in Table 1. The pollutants which are released in air may get adsorbed, absorbed, accumulated or integrated in the plant body and if toxic, they may injure the plant species in various ways. The level of injury will be maximum in sensitive species and least in tolerant species. The sensitive species gives indication of air pollution and tolerant one help in abatement of air pollution. The tolerant plant species function as a sink for pollution and therefore planting of such tolerant species in polluted areas will provide number of environmental benefits. For this purpose, it is essential to evaluate the tolerance level of different plant species to air pollution using changes in four biochemical parameters namely ascorbic acid content, total chlorophyll content, relative water content and pH value. The above biochemical parameters that are analyzed for calculation of APTI values are extremely important to understand the resistivity and susceptibility of different plant species.
3.1. Changes in Ascorbic Acid Content
- Being a very important reducing agent, ascorbic acid also plays a vital role in cell wall synthesis, defence and cell division[19]. Present study showed in case of Pollyalthia longifolia, the concentration of ascorbic acid in experimental sample with respect to the control sample was more by 3.18%, 5.02% and 1.94% in summer, rainy and winter seasons respectively. In case of Caesalpinia pulcherrima, the increase was found to be 3.20% and 1.41% in rainy and winter seasons respectively, while in summer season the fall in ascorbic acid content by 9.98% was observed. For Delonix regia, similar increase of 1.28 % and 41.77 % was observed in rainy and winter seasons respectively, while in summer the ascorbic acid content in the experimental sample was found to decrease by 8.53% with respect to the control sample. Identical trend was observed in case of Tamarindus indica, in which ascorbic acid content in experimental samples was found to increase by 10.00% and 14.53% in rainy and winter seasons respectively, while in summer season the value was found to decrease by 2.36% with respect to the control sample. Pollution load dependent increase in ascorbic acid content of all the plant species may be due to the increased rate of production of reactive oxygen species (ROS) during photo-oxidation of SO2 to SO3 where sulfites are generated from SO2 absorbed. Researchers[20] are of the opinion that higher ascorbic acid content of the plant is a sign of its tolerance against sulphur dioxide pollution.
3.2. Changes in Total Chlorophyll Content
- Chlorophyll content of plants signifies its photosynthetic activity as well as the growth and development of biomass. It is well evident that chlorophyll content of plants varies from species to species; age of leaf and also with the pollution level as well as with other biotic and abiotic conditions[21]. Degradation of photosynthetic pigment has been widely used as an indication of air pollution[22]. Previous studies have revealed that chlorophyll content in plant species varies with the pollution status of that area i.e. higher the pollution level in the form of vehicular exhausts, lower the chlorophyll content. It also varies with the tolerance as well as sensitivity of the plant species i.e. higher the sensitive nature of the plant species, lower the chlorophyll content. Previous studies[23, 24] also suggest that high levels of automobile pollution decreases chlorophyll content in higher plants near roadsides. Present study showed that in case of Pollyalthia longifolia, the total chlorophyll content in experimental sample with respect to the control sample was found to increase by 0.51 %, and 3.47 % in summer and winter seasons respectively, however in case of rainy season the value was found to decrease by 0.85 %. In case of Caesalpinia pulcherrima, the increase in total chlorophyll content was 10.42 % and 11.08 % in summer and winter seasons respectively, while in rainy season the fall in total chlorophyll content by 0.85 % was observed with respect to the control sample. For Delonix regia, increase in total chlorophyll content in experimental samples with respect to control sample by 13.65 % and 0.34% was observed in summer and rainy seasons respectively, while in winter the total chlorophyll content in the experimental sample was found to decrease by 4.81 % with reference to the control sample. However in case of Tamarindus indica, the total chlorophyll content in experimental samples was found to increase by 1.89 % in both the summer and rainy seasons, while in winter season the value increases by 7.04%. The results of the present investigation indicate that there exist strong positive correlation (r=0.853) between total chlorophyll content and APTI values in experimental and control samples of Tamarindus indica collected during summer, rainy and winter seasons (Fig.1); while strong negative correlation (r=-0.877) exist for samples of Pollyalthia longifolia collected for the three seasons (Fig.2).
3.3. Changes in Leaf Extract pH
- High pH may increase the conversion efficiency from hexose sugar to ascorbic acid[1]. It is reported that the photosynthetic efficiency is strongly dependent on the pH of leaf and at low pH the photosynthesis in plant species was reduced in plants with low leaf pH[12]. Researchers [25] have reported that in presence of an acidic pollutant, the leaf pH is lowered and the decline is greater in sensitive species. The results of the present investigation indicate that in case of Pollyalthia longifolia, the pH of leaf extract of experimental sample with respect to the control sample was found to decrease by 0.44, 0.21, and 0.45 towards acidic side in summer, rainy and winter seasons respectively. In case of Caesalpinia pulcherrima, the pH value of experimental samples with reference to the control sample was found to increase from acidic side towards neutral or slightly alkaline side by 1.00, 0.55 and 0.33 in summer, rainy and winter seasons respectively. For Delonix regia, the pH of leaf extract of experimental sample with respect to control sample was found to decrease by 0.10 towards acidic side in winter season, while in summer and rainy seasons; the pH value was found to increase by 1.32 and 0.22 respectively towards slightly alkaline side. However in case of Tamarindus indica, the pH of the leaf extract of experimental samples was found to increase throughout towards weakly acidic side by 0.09, 0.28 and 0.44 in summer, rainy and winter seasons respectively. The results of the present investigation indicate that there exist strong positive correlation (r = 0.831) between pH of leaf extract and APTI values in experimental and control samples of Tamarindus indica collected during summer, rainy and winter seasons (Fig.3).
3.4. Changes in Relative Water Content
- Relative Water Content (RWC) of a leaf is the water present in it relative to its full turgidity. Relative water content is associated with protoplasmic permeability in cells causes loss of water and dissolved nutrients, resulting in early senescence of leaves[26]. High water content within plant body serves as an indicator of drought resistance in plants[27] and helps to maintain its physiological balance under stress conditions such as exposure to air pollution when the transpiration rates are usually high.Therefore the plants with high relative water content under polluted conditions may be tolerant to pollutants. The results of the present investigation suggest a strong positive correlation between % relative water content and APTI values of control and experimental samples of different plant species collected during summer, rainy and winter seasons having value of correlation coefficient (r)=0.979 (Pollyalthia longifolia),0.973 (Caesalpinia pulcherrima), 0.816 (Delonix regia) and 0.937 (Tamarindus indica) as represented in Fig. 4-7. From the results it appears that the relative water content in the leaf of experimental samples with respect to the control samples collected in summer, rainy and winter seasons respectively was found to increase by 5.48%, 7.48% and 5.20% for Pollyalthia longifolia; by 8.40%, 2.40% and 6.14% for Caesalpinia pulcherrima; by 15.15%, 8.15% and 10.18 % for Delonix regia; 15.13 %, 8.13 % and 13.13 % for Tamarindus indica.
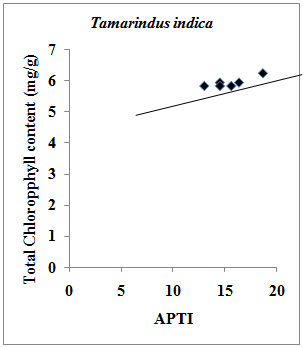 | Figure 1. Statistical Correlation between total chlorophyll content and APTI in control and experimental samples of Tamarindus Indica collected during summer, rainy and winter seasons. Correlation Coefficient (r) = 0.853 |
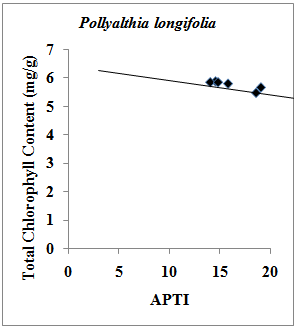 | Figure 2. Statistical Correlation between Total chlorophyll content and APTI in control and experimental samples of Pollyalthia longifolia collected during summer, rainy and winter seasons. Correlation Coefficient (r) = -0.877 |
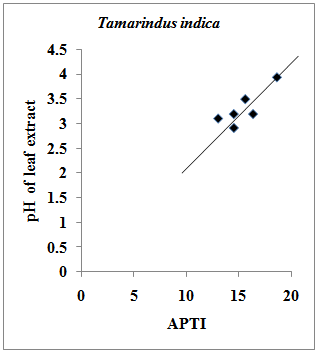 | Figure 3. Statistical Correlation between pH of leaf extract and APTI in control and experimental samples of Tamarindus Indica collected during summer, rainy and winter seasons. Correlation Coefficient (r) = 0.831 |
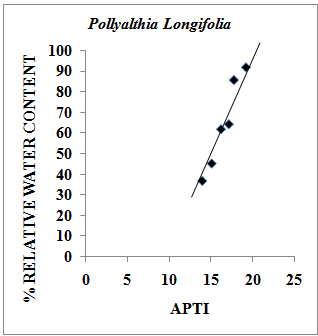 | Figure 4. Statistical Correlation between % Relative water content and APTI in control and experimental samples of Pollyalthia Longifolia collected during summer, rainy and winter seasons. Correlation Coefficient (r) = 0.979 |
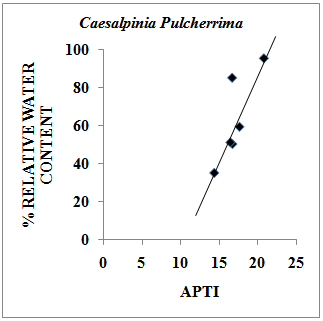 | Figure 5. Statistical Correlation between % Relative water content and APTI in control and experimental samples of Caesalpinia Pulcherrima collected during summer, rainy and winter seasons. Correlation Coefficient (r) = 0.973 |
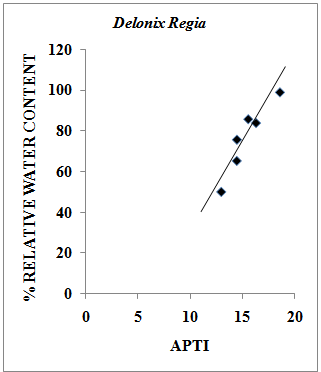 | Figure 6. Statistical Correlation between % Relative water content and APTI in control and experimental samples of Delonix Regia collected during summer, rainy and winter seasons. Correlation Coefficient (r) = 0.816 |
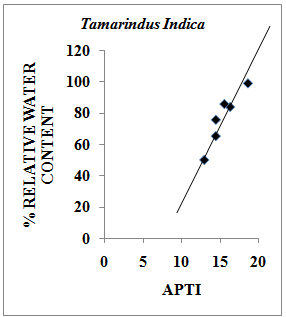 | Figure 7. Statistical Correlation between % Relative water content and APTI in control and experimental samples of Tamarindus Indica collected during summer, rainy and winter seasons. Correlation Coefficient (r) = 0.937 |
3.5. Air Pollution Tolerance Index
- The results of the present study reveal that the four different plant species shows considerable variation in their susceptibility to air pollution and they responded differently to air pollutants (Table 1). The plants with high and low APTI can serve as tolerant and sensitive species respectively. The variation of the APTI can be attributed to the variation in any of the four physiological factors which governs the computation of the index. A more proper conclusion can however be drawn from the percentage increase in APTI values. The results also revealed that of the four species studied, the percentage increase in APTI value of Pollyalthia Longifolia was maximum in rainy season, while for the other plant species the percentage increase was maximum in winter. The minimum increase in percentage APTI for Delonix Regia (7.10 %) and Caesalpinia pulcherrima (5.86 %) was observed in rainy season, for Tamarindus indica in summer season (11.57 %) and for Pollyalthia Longifolia in winter season (2.64 %). From the yearly increase in APTI values obtained by taking the average of the three seasons, it was observed that Pollyalthia longifolia and Caesalpinia pulcherrima were the most tolerant species since they had the least average percentage increase in APTI values, and the order of tolerance decreases as Pollyalthia longifolia (4.40 %) > Caesalpinia pulcherrima (7.42 %) > Tamarindus indica (14.62 %) > Delonix regia (16.00 %). High dust collecting capacity may be one of the reasons for the sensitive plant species studied to become highly susceptible to the auto-exhaust pollutants, making reduction or increase of different biochemical and physiological parameters[28]. Furthermore, air pollution tolerance is also affected by natural climate conditions such as temperature and humidity.
|
4. Conclusions
- From the study it appears that the Air Pollution Tolerance Index (APTI) values which are calculated using four biochemical parameters of plants leaves can be used to predict the impact of air pollution. It is to be noted that these parameters are significant in understanding the plant-environment interactions and are used for developing of bioindicator groups. The plant species which falls under intermediate to tolerant category on the basis of APTI values can be used in development of greenbelt in polluted areas. Based on the percentage increase in APTI values calculated for the four different plant species it can be concluded that Pollyalthia Longifolia is the most tolerant species followed by Caesalpinia pulcherrima, and hence these species can be grown in the college campus area for controlling the effect of air pollution. In conclusion, it appears that with increase in industrialization and urbanization, there is an increase threat of deforestation and hence such type of APTI determinations will gain significant importance for future planning. It is worth noting that combining a variety of parameters gave a more reliable result than when based on a single biochemical parameter.
ACKNOWLEDGEMENTS
- The author is extremely thankful to SAP Productions for developing and maintaining the manuscript template.