-
Paper Information
- Next Paper
- Previous Paper
- Paper Submission
-
Journal Information
- About This Journal
- Editorial Board
- Current Issue
- Archive
- Author Guidelines
- Contact Us
International Journal of Plant Research
p-ISSN: 2163-2596 e-ISSN: 2163-260X
2012; 2(6): 181-187
doi: 10.5923/j.plant.20120206.02
Reducing Emission from Community Forest Managements: A Feasible Study from Almora, Uttarakhand
 Abstract
 Reference
 Full-Text PDF
 Full-Text HTML
Vardan Singh Rawat
Department of Botany, D.S.B. Campus, Kumaun University, Nainital, Uttarakhand
Correspondence to: Vardan Singh Rawat , Department of Botany, D.S.B. Campus, Kumaun University, Nainital, Uttarakhand.
| Email: |  |
Copyright © 2012 Scientific & Academic Publishing. All Rights Reserved.
The present study highlights the significance of community forests in relation to forest degradation. This article argues that community can benefit from the REDD+ mechanism by proactively acting to curb the rate of forest degradation. Successful participation can bring biodiversity, ecological and economic benefits to the community as well as to the country. Of the total biomass in Anriyakot Van Panchayat the contribution of above ground and below ground parts was 73.95% and 26.05%, respectively. The contribution of shrub, herb and litter was 3.90%, 1.25% and 2.68%, respectively. Beside this in Bhatkholi Van Panchayat of the total biomass the contribution of above ground and below ground parts was 74.39% and 25.61%, respectively. The contribution of shrub, herb and litter was 5.72%, 3.50% and 6.11%, respectively. The mean carbon sequestration rate in Anriyakot and Bhatkholi Van Panchayats was 3.90±0.52 t ha -1 yr-1 and 3.41±0.69 t ha -1 yr-1, respectively. The soil organic carbon percent varied from 1.00±0.29 to 2.73±0.51 in Anriyakot, while 1.41±0.54 to 2.97±0.46 in Bhatkholi Van Panchayat. The finding indicates that the community managed forests may act as role model in mitigating climate changes. Determining the level of carbon stock pools in different components has become a concern of governments, businesses and many organizations. It is must to incorporate climate change consideration in forest sector especially Van Panchayat forests for long-term planning process.
Keywords: Community Managed Forest, Van Panchayat, Carbon Sequestration Rate, REDD
Cite this paper: Vardan Singh Rawat , "Reducing Emission from Community Forest Managements: A Feasible Study from Almora, Uttarakhand", International Journal of Plant Research, Vol. 2 No. 6, 2012, pp. 181-187. doi: 10.5923/j.plant.20120206.02.
Article Outline
1. Introduction
- Increased greenhouse-gases are attributable mostly to fossil fuel combustion and deforestation worldwide1. Increasing scientific evidence suggests that the impacts of warming will be more serious and will occur sooner than had previously been believed. The alarming carbon dioxide rise in the atmosphere would raise the global atmospheric temperature by approximately 1℃ but its impacts on the Himalayan region would be more where the temperature are expected to increase by upto 2℃ 2. The removal of atmospheric GHGs by terrestrial ecosystem through carbon sequestration has provided a great opportunity for shifting GHGs emission to mitigate climate change. Under the Kyoto protocol only afforestation and reforestation activities has been considered. However, with regard to and reducing emissions3. Carbon sequestration activitiesmust be coupled with streams of long-term positive benefits to local community, to ensure that potentially negative social impacts are averted and that avoided emissions are sustainable. Under the proposed REDD policy, proposed in Bali conference there is a strong move to reduce CO2 emissions from terrestrial ecosystems by reducing deforestation rates in the tropics4. However, in Copenhagen conference REDD policy was extended to REDD+ to include forest enhancement, sustainable forest management, conservation and reduced forest degradation5. In the present scenario measuring forest degradation is problematic and require many trained professionals. A potentially cheaper alternative monitoring approach at the local implementation scale of REDD+ is to engage local people in monitoring 6 a local based forest monitoring approach therefore hold promise for REDD+. In the present scenario the role of community forests cannot be neglected, as they have vast reserves of carbon stored in their woody biomass and in the soil carbon pool where carbon remains sequestered for long durations in the deeper layers7. The present study highlights the significance of community forests in relation to forest degradation and deforestation. This article argues that community can benefit from the REDD+ mechanism by proactively acting to curb the rate of forest degradation. Successful participation can bring biodiversity, ecological and economic benefits to the community as well as to the Nation.
2. Material and Methods
2.1. Study Site
- The study sites are located in the Van Panchayats of Anriyakot and Bhatkholi in Lamgara block of Almora districts of Uttarakhand. These Van Panchayat forests lie between 29º 32′ 98′′ to 29º 34′ 42′′ N latitudes and 79º 41′ 45′′ to 79º 43' 2'' E longitudes. The elevation of these Van Panchayats varied from 1800 to 2000m. The basic climate pattern is governed by the monsoon rhythm. The average annual rainfall varied from 329.3 to 515.9 mm. The mean maximum temperature varied from 17.31℃ (December) to 28.90°C (June), while the mean minimum temperature varied from 2.18°C (January) to 14.87℃ (June). The parent material forming the soils in the study area mainly comprises of schist, micaceous quartizimeta morphism, plutonic bodies of granodiorites and granites8. Altitudinally the study areas are located in temperate environment but latitudinally it comes within subtropical belt. Majority of forest soils belong to the brown forest soil category9. The soil is residual and shallow. The soil of all the forest types is slightly acidic in reaction and the texture is more or less clay loam. The vegetation type mainly comprises Himalayan moist temperate oak forest and subtropical pine forest. The dominated tree species of both the Van Panchayats are Quercus leucotrichophora, Pinus roxburghii, Rhododendron arboreum, and Myrica esculenta.
2.2. Methodology
- Information on socio-economic parameters was collected by questionnaires which were distributed to 30% of the households in the Van Panchayat. The house holds were selected randomly on the basis of number of family members and categorized in to small (<4), medium (5-9) and larger (>10). Four aspects at both the Van Panchayats were identified. At each aspect, trees were analyzed by placing randomly 10, 100 m2 circular quadrats. However, saplings, seedlings and shrubs were studied by using 10, 5×5 m2 quadrats10. Herbs and litter were studied in 10, 50× 50 cm2 quadrats placed randomly11. Tree layer biomass was estimated on the basis of allometric equations previously developed11 12). Carbon stock and sequestration rate were estimated as 50% of the dry weight of biomass and 50% of net primary productivity13 14. Soil samples were collected from 5-6 pits dug up to 100 cm depth in different locations within each aspect. From each pit 300 to 500 gm soil samples were collected from 0-10 cm, 10-20 cm, 20-30 cm, 30-40 cm, 40-50 cm, 50-60 cm, 60-70 cm, 70-80 cm, 80-90 cm, 90-100 cm soil depths from both Van Panchayats, packed in to polythenebags and brought to the laboratory. Soil carbon estimation was based on rapid titration method of Walkey and Black15. To determine soil bulk density, soil samples were collected by means of a special metal core sampling cylinder of known volume from different soil depths considered for soil carbon estimation. Samples of soil were brought to the laboratory and oven dried at 60℃ till constant weight and soil bulk density was calculated16. The pH of each soil sample was determined using a digital pH meter. Fine roots (< 1mm in diameter) were estimated following the ingrowth core method. The soil cores were obtained by driving a sharp edged steel tube (8.5 cm internal diameter) in to the soil up to a depth of 1m (0-20, 20-40, 40-60, 60-80, 80-100 cm soil depth). In this modified ingrowth process, fine roots were excavated from the soil core with the help of a steel tube and hole was refilled with root free mineral soil. Root samples were collected from different directions, kept in polyethylene bags depth wise and brought to the laboratory. Soil moisture was determined on fresh weight basis15. For total Nitrogen (N), available Phosphorus (P) and available Potassium (K), three composite samples at different soil depths (0-30, 30-60, 60-100 cm) were taken. The total nitrogen content (%) was determined by micro-Kjeldahl assembly17. Soil phosphorous and potassium were extracted by wet ashing of 1 g soil material in acid mixture consisting of 10 ml H2SO4 +3 ml HNO3 + ml HCLO415). Soil potassium was determined using a flame Photometer, and phosphorous was determined using spectrophotometer15. Analysis of variance (ANOVA) and Standard errors were calculated by using SPSS version 16 software.
3. Results
3.1. Forest Management and Socioeconomic Status
- The total household number in the present study ranged from 58 to 129. The area under both Van Panchayats varied from 30-50 ha. Every household has livestock number below 5. All the families are using fuelwood for cooking and heating purposes, only 3-5 families are using LPG, occasionally. The daily requirements of fuelwood ranged from 5-7 kg of dry fuelwood per family. The condition of the forests is quite satisfactory because trees are in healthy condition without lopping and are relatively undisturbed. The regeneration pattern is good, because the conversion of seedlings to saplings and saplings to trees is satisfactory. After the formation of the Van Panchayat the villagers believe that the condition of forest has improved substantially. Reforestation and afforestation emerged as a direct response to the ever-growing demands for fodder, fuel wood, and water in the village. The plantation of the Myrica esculenta and Alnus nepalensis was done in 2009 in about 5 ha area. The villager’s clear fire lines for the protection of forest during the summer season. According to recent estimates, there are about 12,089 Van Panchayats in Uttarakhand managing an area of 5,44,965 ha. Handing over forests to communities for management has gradually improved the forest condition with positive impacts on biodiversity conservation, increased production of fodder, firewood, litter and other non-timber forest products (NTFPs) which support subsistence livelihoods. The impact of this policy in the forestry sector has undoubtedly been positive in reducing deforestation and forest degradation in Uttarakhand Himalaya.
3.2. Phytosociological Attributes
- The total tree density of the Anriyakot and Bhatkholi Van Panchayat ranged from 150 to 490 ind/ha and 193 to 324.3 ind/ha, respectively (Table 1). The forest of both site were dominated by Quercus leucotrichophora and Pinus roxburghii. The total tree basal area in the present study varied from 5.26- 13.62 m2 ha-1. In the present study the conversion of seedlings to saplings and saplings to trees of Quercus leucotrichophora was satisfactory indicating an expanding type of population. Similarly, Rhododendron arboretum seedlings and saplings were in good conditions, while the Pinus roxburghii regenerating poorly. The higher density of seedling, sapling and trees was because of the efforts of community members and proper forest management practices deployed by the community.
3.3. Forest Biomass
- The total forest biomass of Anriyakot Van Panchayat in year 1st was 453.22 t ha -1 and it increased to 485.61 t ha -1 in 2nd year. The percent contribution of the tree layer in total forest biomass was maximum (98.82%). The biomass of the shrub and herb layer was close to 1.18%. While, the total forest biomass of Bhatkholi Van Panchayat in year 1st was 179.36 t ha -1 and it increased to 208.61 t ha -1 in 2nd year. Of the total forest, biomass contribution of the tree layer was maximum (98.1%). The biomass of the shrub and herb layer was close to 3.9%. Of the total biomass contribution of above ground part was 73.4% and belowground part 26.6% (Table 2)
| |||||||||||||||||||||||||||||||||||||||||||||||||||||||||||||||||||||||
3.4. Soil Characteristics
- The total organic soil carbon upto 100 cm soil depth varied from 13.39±0.36 t ha -1 to 30.08±0.30 t ha -1 across different soil layers of both Van Panchayats. The soil organic carbon percentage of the Anriyakot Van Panchayat ranged from 1.00±0.29% to 2.73±0.51%, whereas on Bhatkholi Van Panchayat it ranged from 1.41±0.54% to 2.97±0.46% (Figure 1 and 2). The maximum soil organic carbon percent being in top soil layer upto10 cm and thereafter it decreased with increasing soil depth. Contrary to this, the soil bulk density followed a reverse trend and varied from 1.09±0.07 g cc-1 to 1.44±0.22 g cc-1
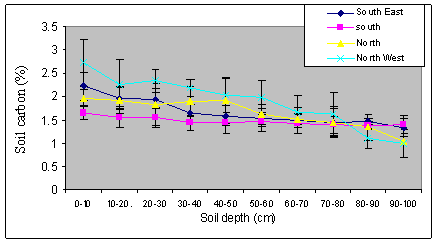 | Figure 1. Soil carbon of Anriyakot Van Panchayat along different soil depths and aspects |
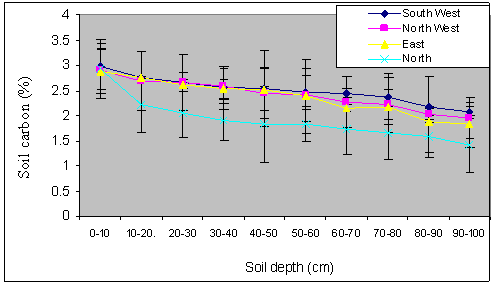 | Figure 2. Soil carbon of Bhatkholi Van Panchayat along different soil depths and aspects |
3.5. Carbon sequestration rates
- The average carbon sequestration rate in the present study in Anriyakot Van Panchayat forest was 3.90±0.52 t ha-1 yr-1, while in Bhatkholi Van Panchayat forest it was 3.41±0.69 t ha -1 yr-1. The maximum sequestration rate was on south facing aspect (5.44 t ha -1 yr-1) of the Anriyakot Van Panchayat forest and the minimum sequestration rate was on east facing aspect (2.03 t ha -1 yr-1) of the Bhatkholi Van Panchayat forest (Figure 3). Data showed that in both the Van Panchayats, the highest amount of carbon was stored in the biomass of Quercus leucotrichophora trees (91.55 %).
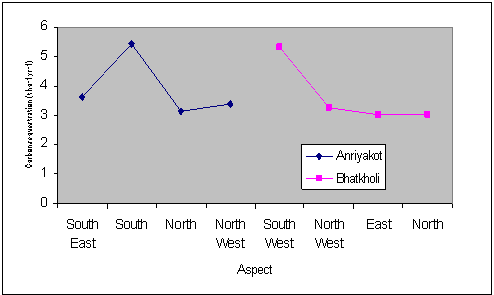 | Figure 3. Carbon sequestration rates (t ha -1 yr -1) in Anriyakot and Bhatkholi Van Panchayat (Carbon sequestration rate is on Y-axis and Aspect on X-axis) |
3.6. Litter Fall
- The mean annual litter fall in Anriyakot Van Panchayat forest was 6.25±0.26 t ha-1 (mean of four aspects). The mean litter fall value was higher in summer season (2.86±0.39 t ha-1) followed by rainy (1.87±0.27 t ha-1) and winter season (1.53±0.04 t ha-1). While the mean annual litter fall in Bhatkholi Van Panchayat forest was 6.08±0.50 t ha-1 (mean of four aspects). The mean litter fall value was higher in summer season (2.55±0.32 t ha-1) followed by rainy (1.84±0.24 t ha-1) and winter season (1.68±0.26 t ha-1) (Table 3). The ANOVA test showed significant variation at P<0.05 across aspects, seasons and types of litter. The combined effects of seasons x types of litter, seasons x aspects also varied significantly (P<0.05). However, in case of site x aspects, sites x seasons, sites x litter types and aspects x litter types did not show significant variation.
| ||||||||||||||||||||||||||||||||||||||||||||||||||||||||||||||||||||
3.7. Fine Root Biomass
- The total fine root biomass in Anriyakot Van Panchayat forest varied from 4.33 t ha -1 to 6.65 t ha -1 (Four aspects). The average fine root biomass of the three seasons was 7.41±2.89 t ha -1. The total fine root biomass in Bhatkholi Van Panchayat ranged from 4.28 t ha -1 to 5.74 t ha -1. The average fine root biomass was 6.56±2.68 t ha -1. The fine root biomass across all seasons declined with depth increasing soil depths. The ANOVA test showed that fine roots biomass varied significantly (P<0.05) between seasons, forest site, aspects, soil depths and to the combined effects of season x forest site and season x soil depths.
4. Discussion
- As deforestation was acknowledged as a source of anthropogenic emissions at the 13th CoP meeting, interest is growing in finding ways to include the reduction in forest degradation in developing countries beyond the first commitment period of the Kyoto Protocol18. Therefore, it is important for the authorities in the regions concerned to take early cognizance of the potential that forest conservation offers and lobby for a mechanism that brings benefits to local communities, which will conserve forests locally and extending the benefits globally. The present study illustrate that community forest management can be a viable strategy for reducing emissions from deforestation, as the data reveal that the mean carbon sequestration rate for India (3.7 t ha -1 yr-1) and Nepal (1.88 t ha -1 yr-1), are close to 2.79 t ha -1 yr-1or 10.23 CO2 t ha -1 yr-1 under normal management conditions, this is the condition when local people have extracted various forest products to meet their sustenance needs19. The Van Panchayat forests in Uttarakhand are sequestering carbon at the average rate of around 3.3 t ha -1 yr-1. However, these values varied from place to place. In least disturbed forests of various types, such as sal, pine and oak forests generally carbon sequestration rates ranged between 4.0-5.6 t ha-1 yr-1. These are more or less similar to values reported for tropical forests. However, due to forest degradation these high rates are not found everywhere at regional scale. A range of values between 2.52-3.53 t ha-1 yr-1 is common20. The carbon sequestration values observed from the present study varied from 2.03 to 5.44 t ha-1 yr-1. The carbon sequestration values observed from the present study are in agreement with the values reported earlier for different central Himalayan forests21 22 23. A study carried out in the inner Terai region in Nepal shows carbon sequestration rates of 2 t C ha -1 yr-1 from aboveground biomass, including understory biomass, and SOC of upto 20 cm depth25. In the present study the number of trees was more in the younger size girth classes (30 to 60cm), therefore calculated carbon sequestration rate values are towards higher side. Almost trees of medium size girth class had a greater potential for carbon sequestering than mature trees because the growth rate was slow in bigger size girth classes. Therefore, to conserve and manage the small trees of 10- 60cm girth class can considerably increase carbon sequestration potential in the near future if appropriate management practices are applied. 26 27 reported that carbon sequestration depended not only forest types and rates of productivity but also on the size classes of trees. As the average prices of carbon offsets range between US$ 5 to US$ 28 per tones. Using the nominal rate of US$ 10 per tones, the carbon stored in Anriyakot and Bhatkholi Van Panchayat forests was US$ 1690.44 and US$ 2046, respectively. The situation in other Van Panchayats in Uttarakhand is more or less similar. It was assumed that at least 2-5 ha of forest are required per household to meet their daily needs of fodder and fuelwood. A major transfer of forest from government to Van Panchayat would be required to give adequate forest support to most villages. This comes to over 100,000 ha of government forest; that is, nearly 40% of the existing forests28. Once each Van Panchayat is assured of an adequate forest area, regulations about the protection of government forests can be enforced effectively. This can be used to address the problem of leakage. Thus it would help to ensure improvement in the remaining government forest. Once assured of rights, villagers would be encouraged to take up measures to reduce their day to day dependency on forests. Selling of carbon from their forests can provide a considerable income for the Van Panchayats. The inclusion of forest conservation activities in international agreements and protocols will give incentives to the local population to get certified emission reductions for their efforts to conserve the forest. This would not only provide resources for sustainable livelihoods and improved lifestyles, but also encourage the marginalized people of the Himalaya to make a meaningful contribution to reducing global emissions and forest conservation29. On the basis of review of past studies, there appear to be high potential for enhancing the carbon sequestration in the vegetation and soils of the Central Himalayan region through improved management of degraded lands. Soil carbon sequestration could meet at most about one-third of the current yearly increase in atmospheric CO2 however, the duration of the effect would be limited, with significant impacts lasting only 20-50 years30. Soil organic carbon values of the present study varied from 0.38 to 2.73%. These values are generally comparable with the values reported earlier for different Central Himalayan forests (0.97% to 4.1%23).The organic soil carbon percent in the present study was higher on the top soil layers and declines as the soil depth increases. The vertical distribution of roots and soil carbon are correlated but soil carbon goes deeper than roots. Soil carbon turnover decreases with soil depth resulting in higher soil accumulation per units of carbon input in deeper layer soil organism mixes carbon vertically. The tree species which have a deeper root allocation hold a great potential and various species of given area need to be examined in view of soil carbon accumulation. On an average most of the soil texture of both the Van Panchayats were clay resulting in the higher value of soil organic carbon percent. The estimates for sequestrating atmospheric CO2 indicate that maintaining existing forests may be one of the least cost options for offsetting carbon, based on the breakeven price of $ 0.55 to $ 3.70 per t CO2. It is assumed that if the rates for credits are considerable higher than their cost, then it may be a real incentive to strengthen and promote sustainable forest management, which will be attractive to local communities as well as governments in developing countries. It also clearly shows REDD policy must be built upon the existing CFM policy where communities are recognized with their forest use rights. Successful participation can bring ecological and economic benefits to the community as well as the country.
ACKNOWLEDGEMENTS
- I am grateful to Dr. Ashish Tewari, Department of Forestry and Environmental Science for his valuable guidance and encouragement and Dr. Y.S. Rawat, Department of Botany, Kumaun University, Nainital for encouragement and perusal of the manuscript. I am also thankful to G.B. Pant Institute of Himalayan Environment and Development (GBPIHED) Kosi Katarmal, Almora (Uttarakhand) for financial assistance.
References
| [1] | Hamburg S.P, Harris N, Jaeger J, Karl T.R, McFarland M, Mitchell J.F.B., Oppenheimer M, Santer S, Schneider, S. Trenberth K.E. Weigley T.M.L, Common questions about climate change. United Nation Environment Programme, World Meteorology Organisation, 1997. |
| [2] | Ravindranath N.H, Joshi N.V, Sukumar R. and Saxena A, Impact of climate change on forest in India. Current Science 90:354-361, 2006. |
| [3] | Niles, J. Brown, S. Pretty, J. Ball, A. and Fay, J, Potential carbon mitigation and income in developing countries from changes in use and management of agricultural and forest lands. Philosophical Transactions: Mathematical, Physical and Engineering Sciences, 360(1797):1621-1639, 2002. |
| [4] | Gullison, R.E. Frumhoff, P.C. Canadell, J.G. Field, C.B. Nepstad, D.C. Hayhoe, K. Avissar, R. Curran, L.M. Friedlingstein, P. Jones, C.D. and Nobre, C, Tropical Forests and Climate Policy. In: Science, 316: 985-986, 2007. |
| [5] | UNFCCC, Decision 4/COP15. Methodological guidance for activities relating to reducing emissions from deforestation and forest degradation and the role of conservation sustainable management of forest and enhancement of forest carbon stock in developing countries, pp 11. 2010c. |
| [6] | Skutsch, M. editor, Community forest monitoring for the carbon market: opportunities under REDD. Earthscan, London, 2010. |
| [7] | Jobbagy, E.G and. Jackson, R.B, The vertical distribution of soil organic carbon and its relation to climate and vegetation. Ecological applications 10: 423-436, 2000. |
| [8] | Valdiya K.S, Geology of Kumaun lesser Himalaya. Dehradun. Wadia Institute of Himalayan Geology, India, 1980. |
| [9] | Singh, J.S. and Singh, S.P, Forest of Himalaya: Structure, Functioning and Impact of Man, Gyanodaya Prakashan, Nainital, India, 1992. |
| [10] | Tewari, A. and Karky, B. S, Carbon Measurement Methodology and Results. In. Banskota, K.l., Karky, B. S. and Skutsch, M. (eds). Reducing Carbon Emissions through Community managed Forests in the Himalaya, International Centre for Integrated Mountain Development Kathmandu, Nepal. pp 39-54, 2007. |
| [11] | Rawat, Y.S. Singh, J.S. Structure and function of forest in central Himalaya. ΙΙ. dry matter dynamics, R. (1968). Ecology workbook, annals of botany.62: 413-427, 1988. |
| [12] | Chaturvedi, O.P and Singh. J.S, The structure and function of pine forest in Central Himalaya. I. Dry matter dynamics. Annals of Botany, 60:237-252, 1987. |
| [13] | Hamburg, S.P. Simple rules for measuring changes in ecosystem carbon in forestry– offset projects. Mitigation and Adaptation Strategies for Global Change, 5:25-37, 2000. |
| [14] | Brown, S, Measuring and monitoring carbon benefits for forest-based projects: experience from pilot projects, can carbon sinks be operational? Resources for the Future (RFF) workshop proceedings. Washington DC, pp. 1- 19, 2001. |
| [15] | Jackson, M.L, Soil chemical analysis, Prentice Hall Inc., USA, 498p, 1958. |
| [16] | Misra, R. Ecology workbook, Oxford and IBH Publishing Co. Calcutta. Pp. 224, 1968. |
| [17] | Peach, K. and Tracey, M.V. Modern methods of plant analysis. Vol. I, Springer. Verlag, Berlin, 1956. |
| [18] | Karky, B.S. and Banskota, K, Reducing Emissions from Nepal’s Community Managed Forests: Discussion for COP 14 in Poznan. Journal of Forest and Livelihood 8 (1): 43-47, 2009. |
| [19] | Baskota, K. Karky, B.S and Skutsch, M, Reducing Carbon Emissions through Community managed forests in the Himalaya. Nepal: International Centre for Integrated Mountain Development, 2007. |
| [20] | Singh, S.P, Himalayan forest ecosystem services, incorporating in national accounting. Central Himalayan Environmental Association prakashan, Nainital, 2007. |
| [21] | KTGAL (Kyoto Think Global Act Local Project Report) 2003-2004. Central Himalayan Environmental Association, submitted to ICIMOD, Khatmandu, Nepal pp. 32-33, 2004. |
| [22] | Phartiyal, P. and Tewari, A, Challenges before Marginalized Hill Communities for Managing Community Forests, Status of the Village Forest Council in Uttaranchal, India. 11th Biennial conference of International association for the study of common property, Bali, Indonesia, 2006. |
| [23] | Singh, V, Biomass stock and Carbon Sequestration rates in banj oak (Quercus leucotrichophora, A. Camus.) forest under different disturbance regimes in Central Himalaya. Ph.D. Thesis, Kumaun University, Nainital, 2009. |
| [24] | Raikwal, D, Effect of leaf litter removal on soil nutrients in Central Himalayan banj oak and chir pine forests with relation to carbon sequestration. Ph.D. Thesis, submitted to Kumaun University, Nainital, 2009. |
| [25] | Aune, J.B. Alemu A.T. and Gautam, K.P. Carbon sequestration in rural communities: Is it worth the effort? Journal of Sustainable Forestry, 21(1): 69–79, 2005. |
| [26] | Huston, M.A. Marland, G, Carbon management and biodiversity. J. of Environmental Management 67:77-86, 2003. |
| [27] | Terakunpisut, J. Gajaseni, N. and Ruankawe, N, Carbon Sequestration potential in above ground biomass of Thong Pha Phum National Forest, Thailand. Applied ecology and environmental research 5(2): 93-102, 2007. |
| [28] | Singh, S.P. Singh, V. and Skutsch, M, Rapid warming in the Himalayas: Ecosystem responses and development options. Climate and Development. 2: 221-232, 2010. |
| [29] | Tewari, A. Singh, V. and Phartiyal, P, The potential of community managed. LEISA Magazine 24.4. pp. 33, 2008. |
| [30] | Smith, P, Carbon sequestration in croplands: the potential in Europe and the global context. European Journal of Agronomy 20 (3):229–236, 2004. |