Kari Jovaag 1, Jack Dekker 2, Brad Atchison 2
1Weed Biology Laboratory, Department of Agronomy, Department of Statistics, Iowa State University, Ames, Iowa, 50011, USA
2Weed Biology Laboratory, Department of Agronomy, Iowa State University, Ames, Iowa, 50011, USA
Correspondence to: Jack Dekker , Weed Biology Laboratory, Department of Agronomy, Iowa State University, Ames, Iowa, 50011, USA.
| Email: |  |
Copyright © 2012 Scientific & Academic Publishing. All Rights Reserved.
Abstract
Seedling recruitment of heterogeneous Setaria faberi seed entering the soil post-abscission is elucidated herein. This is the third in a series of three articles providing evidence that weedy Setaria seedling recruitment behavior is predicated on dormancy state heterogeneity at abscission (seed heteroblasty), as modulated by environmental signals. Complex oscillating patterns of seedling emergence were observed during the first half of the growing season in all 503 soil burial cores of the 39 populations studied. These patterns were attributed to six distinct dormancy phenotype cohorts arising from inherent somatic polymorphism in seed dormancy states (canalized phenotypes). Early season cohorts were formalized using a mixture model consisting of four normal distributions. Two, numerically low, late season cohorts were also observed. Variation in emergence patterns among Setaria populations revealed a fine scale adaptation to local conditions. Seedling recruitment patterns were influenced by both parental-genotypic (time of embryogenesis) and environmental (year, common nursery location, seed age in the soil) parameters. The influence of seed heteroblasty on recruitment behavior was apparent in that S. faberi populations with higher dormancy at the time of dispersal had lower emergence numbers the following spring, and in many instances occurred later, compared to those less dormant. Heteroblasty was thus the first determinant of behavior, most apparent in recruitment number, less so in pattern. Environment modulated seedling numbers, but more strongly influenced pattern. The resulting pattern of emergence revealed the actual “hedge-bet” structure for Setaria seedling recruitment investment, its realized niche, an adaptation to the predictable mortality risks caused by agricultural production and interactions with neighbors. These complex patterns in seedling recruitment behavior support the conjecture that the inherent dormancy capacities of S. faberi seeds provides a germinability ‘memory’ of successful historical exploitation of local opportunity, the inherent starting condition that interacts in both a deterministic and plastic manner with environmental signals to define the consequential heterogeneous life history trajectories.
Keywords:
Seed Heteroblasty, Seed Dormancy, Setaria, Community Assembly, Seedling Emergence, Canalized Phenotypes
Cite this paper:
Kari Jovaag , Jack Dekker , Brad Atchison , "Setaria faberi Seed HeteroblastyBlueprints Seedling Recruitment: III. Seedling Recruitment Behavior", International Journal of Plant Research, Vol. 2 No. 6, 2012, pp. 165-180. doi: 10.5923/j.plant.20120206.01.
1. Introduction
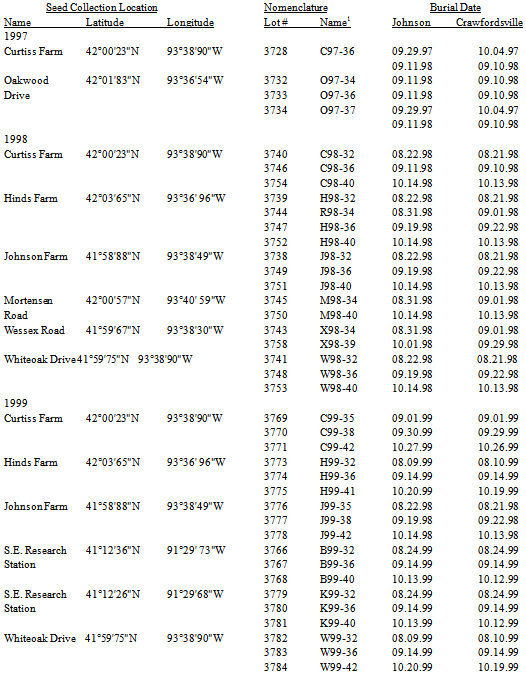
Setaria faberi is a very successful invasive agricultural weed because of its ability to form long-lived soil seed pools of heterogeneous seed (see first and second articles in this series) that cycle annually between dormancy and germination candidacy until environmental conditions allow germination and emergence to occur (Figure 5, second article in this series). This paper examines seedling emergence from the soil of those same populations and is the third in a series on the seed-seedling life history of this weedy species.Seedling recruitment is an irreversible, committed step in the life history of a plant. It is the time when the annual S. faberi plant resumes autotrophic growth, assembles in local agro-communities, and begins interactions with neighbours. As such, its timing is crucial to subsequent behaviours, including survival and reproductive success. Seedling emergence timing is a trade-off between the risks of mortality from disturbance and competition with neighbours and exploitation of opportunity space-time to accumulate biomass and produce seed. S. faberi has evolved in agro-ecosystems characterized by annual disturbance and selection by predictable farming practices (e.g., planting, tillage, herbicides, harvesting). The variable risks in these agricultural habitats have not led to a single, best time to germinate.Is there a pattern to the periodicity of S. faberi seedling recruitment? Past research only reveals a qualitative pattern: an early flush of seedling emergence in the spring (April-June) which decreases as temperatures warm, followed by low numbers during the late season (e.g., Forcella, et al., 1992, 1997). Is it possible to discover a more precise, quantitative pattern to seedling emergence? If so, does it bear a relationship to seed heteroblastic patterns among the same seeds at abscission?A successful survival strategy for a prolific seed producing species like Setaria may be to disperse heteroblastic seeds able to take advantage of as many recruitment opportunities as are available, in both seasonal time and field space. The resulting pattern of seedling emergence timing may reveal the ‘hedge-bet’ for individual Setaria fitness.We hypothesize that there exists a pattern to Setaria seedling recruitment timing which is predicated in the first instance on the dormancy state heterogeneity (seed heteroblasty) at abscission. This pattern in the second instance is modulated by the environment (year, common nursery location, seed age in the soil). Thus, patterns in Setaria emergence will reflect the historically advantageous recruitment times (opportunity) enabling survival and reproductive success.Table 1. Location (name, latitude, longitude) and nomenclature (lot no., name) of S. faberi populations grouped by year of abscission and collection. 1Population names consist of 3 parts: a prefix letter designating the population location, two digits designating the collection year, and two digits designating the Julian week of abscission and collection. All locations were in Ames, IA, except S.E. Research Station, near Crawfordsville, IA; R was 100m west of Hinds (H)
 |
| |
|
2. Materials and Methods
2.1. Experimental
2.1.1. Setaria Populations
For this study, a Setaria population was defined as a specific combination of Setaria location and seasonal time of abscission (table 1). Seeds collected from the sameccc location but at different seasonal times were treated as samples from different populations rather than repeated measures of the same population. The reason for this was that seed dormancy phenotypes developing early in the season differ from those developing later in the season due to the strong influence of photoperiod on dormancy induction (Dekker, 2004; Dekker et al, 1996).Locations. S. faberi seeds were collected from a local area around Ames, IA (table 1). Most were less than 3km from each other. The geographic range was restricted to allow characterization of localized population phenotypic (heteroblastic) dormancy structure (see second article in this series). In 1999, seeds were also collected from two distant locations in Iowa (near Crawfordsville, about 194km from Ames) to gain some initial perspective on regional heteroblastic variation. All seeds were gathered from Setaria monocultures, ensuring no contamination from non-target Setaria species occurred. When seed was collected from the same site in different years the site was protected from human interference.Seasonal time of abscission. Setaria seed development occurs continuously from July through November (Julian week (JW) 26-48) depending on environmental conditions. To evaluate the effects of time of abscission during this seed rain period, seed was collected from most of the locations at discrete intervals roughly corresponding to August (early; JW 31-35), September (middle; JW 36-39) and October (late; JW 40-42) (table 1). Our Julian week calendar assumes 29 days for every February.
2.1.2. Seed Collection and Preparation
Ripe, recently abscised (e.g., 0-5 days; Dekker et al., 1996) seed were collected from each population and dried at room temperature (20℃) and ambient humidity. Twelve hundred hard, dark, mature seeds from each lot were counted manually to provide six replications of 200 seeds per population (3 replications at each of the two nurseries). Further procedural details are given in Jovaag, Dekker, and Atchison 2009a.
2.1.3. Seed Burial
Seeds were buried in two common location, agricultural nurseries. Nurseries were on the Iowa State University Agricultural Experiment Research Station, at Johnson Farm, Ames, and the Southeast Research Station near Crawfordsville, Iowa (table 1).Field soil seedbank site preparation. The areas selected for this study had been previously maintained as turf grass (primarily bromegrass, Bromus sp.) for more than 12 years. Well in advance of burial, these areas were treated with a 3% solution of glyphosate (isopropylamine salt of N-(phosphomethyl) glycine; Roundup) to kill the grass sod. After allowing time for the herbicide to work, the dead sod was tilled to a depth of about 20cm using a rototiller. Time was allowed for continued decay of the sod and the area was tilled again. Finally, the soil was raked smooth and even for seedbed preparation. Soil cores were removed periodically in the experimental areas to confirm that no previous, contaminating S. faberi seeds were present.Crop (soybean) rows were planted 96cm apart. Individual S. faberi seed burial sites (soil cores) were located in the inter-row area. Burial sites were arranged in a completely randomized design using three replications.Burial procedure. At each burial site, three equidistant metal-staffed marker flags were used to define an 11cm diameter round “core” area. A 7cm diameter, 10cm deep (volume: 390cm³), soil core was extracted from the centre of the three flags. The soil was placed in a dishpan and thoroughly mixed with 200 seeds from a population (seed density: 0.5seeds/cm³). The soil was then carefully returned to the hole from which it was extracted. Seed burial occurred one to three weeks after the seed was harvested (table 1).Field management. No-till Roundup Ready soybeans were planted each spring between the soil core rows, simulating normal stand density and row spacing and ensuring the seed-soil cores were undisturbed. Both chemical and manual weed control methods were used to keep the plots weed free. Soybeans were harvested by hand and threshed, then the residue was redistributed over the entire plot area.
2.1.4. Seedling Emergence Data Collection
Each week in 1997-2000, from spring through autumn when the soil was not frozen, emerged seedlings in each core were counted, then killed by severing them at the soil surface to prevent them from influencing subsequent germination and emergence.
2.2. Analysis
2.2.1. Statistical Model
Seedling emergence in the first half of the season (Julian weeks 14-31) showed a complex oscillating pattern (figure 1). Mixture models, that is, models which are a combination of two or more simple distributions, are often flexible enough to fit such complex patterns, yet still provide parameters for interpretation and comparison. Determination of the number of distributions in the mixture is a difficult problem which has not been completely resolved (McLachlan & Peel 2001). The goal is to have the smallest number of components which are different, have nonzero mixing proportions, and are compatible with the data. For our data, a minimum of four distributions were generally necessary for the mixture model to be compatible with the data. Mixtures of five distributions were unnecessary since they generally contained one distribution with a mixing proportion close or equal to zero. Letting g(x) represent the expected proportion of seeds emerging at time x  the four distribution mixture model is:
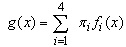 where:
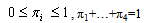 and:
and: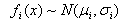 The πi are the mixing proportions, and the
  are the component distributions. Further, the standard deviations of the normal distributions were constrained to be equal. That is,
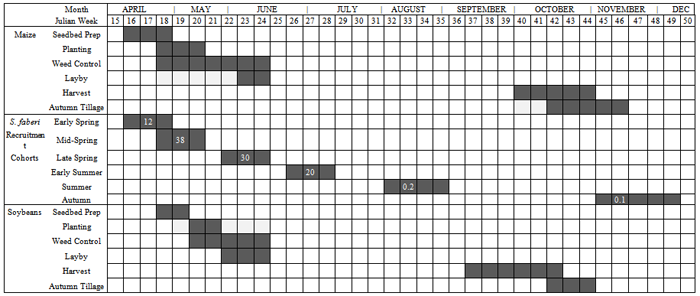
  . The constraint disallowed models containing two distributions with nearly identical means and very different standard deviations. Because of the critical importance of the timing of emergence, it seems reasonable that if there are distinct emergence phenotypes, that they would have distinct mean times, rather than identical mean times and varying standard deviations. This constraint also resulted in models with eight parameters (4 means, 1 standard deviation, 3 independent proportions) rather than eleven.Distribution Names. Herein, the four mixture model distributions are called early spring, mid-spring, late spring and early summer. Two additional late season emergence cohorts are called summer and autumn.Comparison of emergence and agricultural disturbances. Table 2 shows historical times (ca. 1980-1996) of agricultural disturbances typical of management practices for central and southeast Iowa corn-soybean rotation fields from which S. faberi populations were taken (personal communication, R. Hartzler, M.D.K. Owen, Iowa State Univ.; Farnham, 2001; Whigham, et al., 2000). To allow comparisons between disturbance timing and seedling recruitment observations, emergence times for the six cohorts reported herein are also provided.
2.2.2. Comparison of Emergence and Heterogeneity at Abscission
To test the hypothesis that Setaria seedling recruitment timing is predicated on the dormancy state heterogeneity at abscission, seed germinability of S. faberi populations at abscission was compared to their cumulative seedling emergence the following spring. Direct comparison of seed germinability numbers and emergence numbers was not possible because of the differing experimental methods needed in each case. Thus, the comparison was made on the relative rankings of the populations. Setaria populations were first ranked from least to most germinable at the time of abscission (rankings given in Jovaag, 2006). The populations were then ranked from least to most cumulative emergence at five different times during the first year after burial (Julian weeks 18, 20, 24, 28, and 48). The first three time points used (JW18, 20, 24) were intermediate to the four distribution mean times used to model emergence (table 2). Julian week 28 was shortly after the fourth mean. The last date was chosen to contain all first year emergence. The germinability ranking at abscission was then compared to the emergence ranking at each chosen time point using Spearman’s rank correlation, a nonparametric test of association that does not require specific distributional assumptions.To further compare emergence and heterogeneity at abscission, the emergence patterns of the seed dormancy (after-ripening, AR) groups developed in the first article of this series were also analyzed using four distribution mixture models.Table 2. Calendar of historical, seasonal times (Julian week, month) of agricultural field disturbances (seedbed preparation; planting; weed control, including tillage and herbicides; time after which all cropping operations cease, layby; harvest and autumn tillage), and seedling emergence timing for central and southeastern Iowa, US, Setaria faberi population cohorts (all S. faberi combined: time, +/- S.E.; mean proportion; see table 3)
 |
| |
|
3. Results
3.1. Spring Emergence
A consistent pattern was observed in the number of Setaria seedlings emerging during the spring (JW 14-31): periods of high emergence (local maxima) followed by intervening minima (figure 1):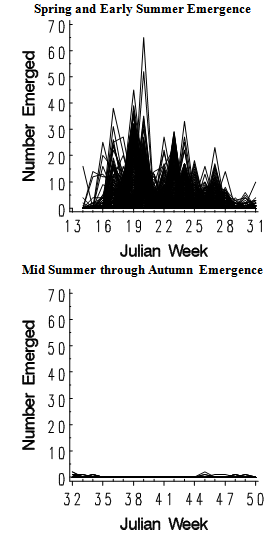 | Figure 1. S. faberi seedling emergence (no.) with time (Julian week (JW)) during the first year (spring and early summer: JW14-31, left; mid summer and autumn: JW32-50, right) after seed burial. Each line represents seedling emergence from one of the 503 cores used in the study |
This oscillating pattern occurred in all 503 cores of the 39 populations studied over three years in two common burial nurseries, although the magnitude and timing of the oscillations varied among the cores. To model these oscillations, spring emergence data was analyzed using a mixture model consisting of four normal distributions with equal standard deviations (see model discussion in materials and methods: analysis). The model had four emergence periods (local maxima) separated by intervening minima. However, when mean times were close, or the proportion in one of the distributions was very small, two or more of the distributions combined to form one peak, resulting in a model with two or three peak emergence periods. This resulted in the close coincidence of the models (solid curved lines in figures 2-3) with the frequency histograms of the actual data (bars in figures 2-3). In the following sections “peak” is used when referring to a local maxima in the model. The “distribution”, “mean time” or “proportion” refers to one of the four underlying normal distributions (dotted lines in figures 2-3). Separate models were obtained for each year and common nursery. Additionally, separate models were obtained for seeds of different ages in the soil, for seed collected from common locations during the early, middle and late periods of the seed rain, and for the AR groups developed in the first article in this series.
3.1.1. General Emergence Pattern
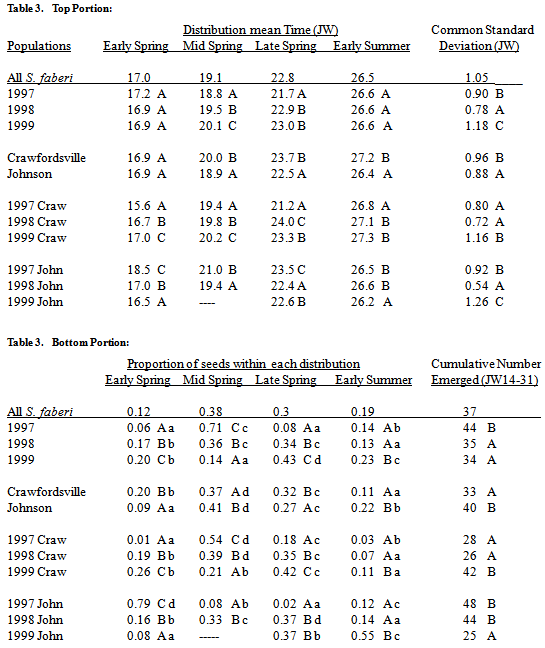
Overall, S. faberi seedling emergence during the first half of the first year after burial (Julian weeks 14-31) had an oscillating pattern with three sequentially decreasing peaks (figure 2, top left). Fifty percent of the emergence during this period occurred within the first peak, which consisted of the small early spring distribution and the large mid spring distribution (table 3). The late spring distribution formed the second, somewhat smaller (30%) peak. The early summer distribution formed the third and smallest peak. This overall response of S. faberi can be deconstructed to reveal the separate influences of years (1997-1999) and common burial nurseries (Crawfordsville, Johnson) on the spring emergence pattern.Years. Seedling emergence patterns differed between years primarily in the proportions of emergence occurring within each distribution (table 3, figure 2). The proportion of emergence during mid spring decreased from the 1998 season to the 1999 season, and again from the 1999 season to the 2000 season. The proportion of emergence during early and late spring increased from the 1998 season to the 1999 season, and again from the 1999 season to the 2000 season. The proportion of emergence during early summer was greater during the 2000 season than during the 1998 or 1999 seasons. Further, in the 1998 season (1997 populations), the mid spring distribution had the largest proportion. In the 1999 season (1998 populations), the mid and late spring proportions were about equal, and larger than the other two. In the 2000 season (1999 populations), the late spring distribution had the largest proportion.Table 3. Seedling emergence (mean times (Julian week, JW), std. deviations (JW), top portion of table; proportions, cumulative no. (per core of 200, JW14-31), bottom portion of table) of S. faberi populations within each of the four normal mixture model components (early, mid and late spring and early summer) during the first year after burial, grouped by burial year, nursery, and burial year at each nursery (Crawfordsville (Craw); Johnson (John)). In all cases, numbers in the same column, portion of the table and group (year, nursery, year by individual nursery) with the same uppercase letter are not statistically different (comparison of 95% confidence intervals, probability (p)>.05). Numbers in the same row with the same lowercase letter are not statistically different (hypothesis test, p>.05)
 |
| |
|
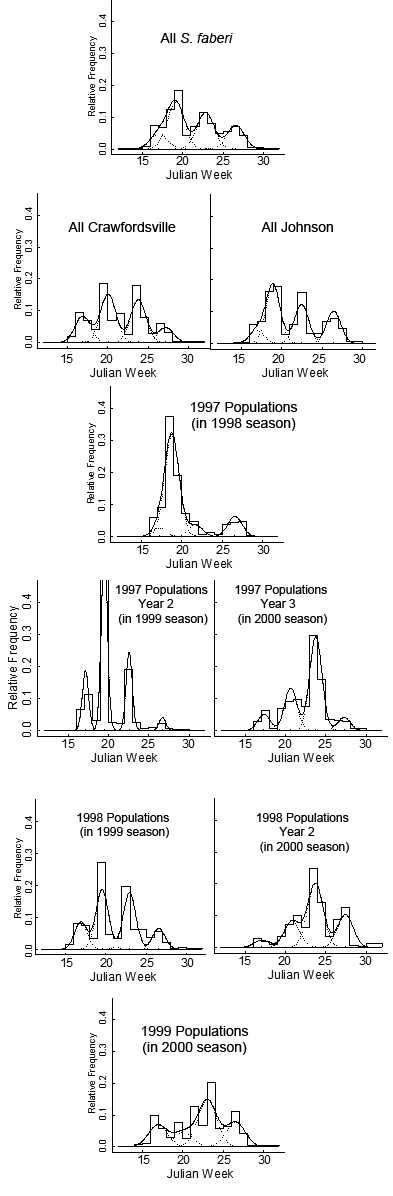 | Figure 2. S. faberi seedling emergence (proportion relative to total spring no.) with time (Julian week, JW) during the spring and early summer of the first year after burial for all S. faberi populations (top tier), each nursery (second tier), 1997 populations (tiers 3 and 4), 1997 second and third years after burial for populations buried in 1997 (tier 4), 1998 (tiers 5; including second year after burial), and 1999 populations buried in 2000 (bottom tier). Bars provide a relative frequency histogram of seedling emergence. The solid line is the seedling emergence estimate (proportion) from the mixture model (4 normal components with equal variance, see materials and methods). Dashed lines show the model’s four normal components (weighted by the mixing proportions) |
Mid and late spring timing means also differed between years, though timing had a lesser effect than proportion on the emergence pattern. The mid spring mean time for the 1998 season occurred earlier than for the 1999 season which in turn occurred earlier than the mean time for the 2000 season. The late spring mean time for the 1998 season occurred earlier than for either the 1999 or 2000 season. Mean times for early spring and early summer were similar between years. The variability of the distributions also differed between years. The 1999 season was less variable than the 1998 season which was less variable than the 2000 season. On average, the total number of seeds emerging during the spring (JW 14-31) was greater during the 1998 season than during the 1999 or 2000 seasons.Common nurseries. The mid spring through early summer mean times were about a week earlier at Johnson than at Crawfordsville, the mean time of the early spring distribution was similar at both nurseries (table 3, figure 2). The proportions of emergence during mid spring and early summer were 7-8% greater at Johnson than at Crawfordsville, while the proportions during early and late spring were 7-9% lower. Variability was greater at Crawfordsville than at Johnson. On average, the total number of seeds emerging during the spring (JW 14-31) was greater at Johnson than at Crawfordsville.Year by common nursery interaction. Overall, the influence of year was greater than that of common nursery on the spring emergence patterns during the 1998 and 1999 seasons. However, the mean time for each distribution was earlier during the 1998 season than during the 1999 season at Crawfordsville, but later or similar at Johnson (table 3). Also, the greatest proportion of emergence in 1998 occurred during early spring at Johnson, but during mid spring at Crawfordsville. Differences between the common nurseries were more apparent during the 2000 season. At Crawfordsville in 2000, emergence occurred primarily from early spring through late spring, with the greatest proportion (42%) during late spring (table 3). At Johnson in 2000, emergence primarily occurred during late spring and early summer, with largest proportion (55%) during early summer.
3.1.2. Seed Age in the Soil
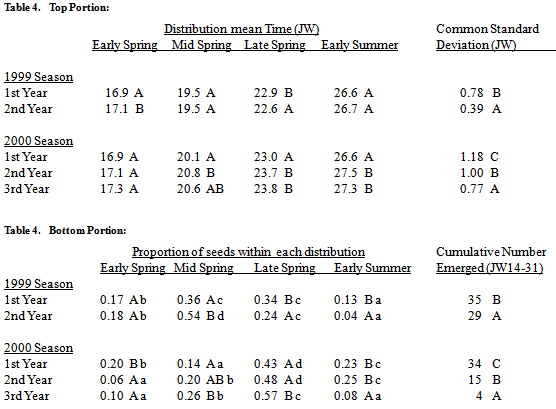
Emergence patterns among seeds of different ages in the soil were compared within a season (1999 or 2000; figure 3). Both years, the total number of seeds emerging during the spring (JW 14-31) declined rapidly as seed age in the soil increased (table 4). Patterns in emergence timing and proportion between the first and second year after burial differed depending on the season. Data for the third year after burial was only available for the 2000 season.Table 4. Seedling emergence (mean times (Julian week, JW), std. deviations (JW), top portion of table; proportions, cumulative no. (per core of 200, JW14-31), bottom portion of table) of S. faberi populations within each of the four normal mixture model components (early, mid and late spring and early summer) during the first-third years after burial, grouped by season (1999, 2000). Data for the third year after burial was available only for the 2000 season. In all cases, numbers in the same column, portion of the table and group (season) with the same uppercase letter are not statistically different (comparison of 95% confidence intervals, probability (p)>.05). Numbers in the same row with the same lowercase letter are not statistically different (hypothesis test, p>.05)
 |
| |
|
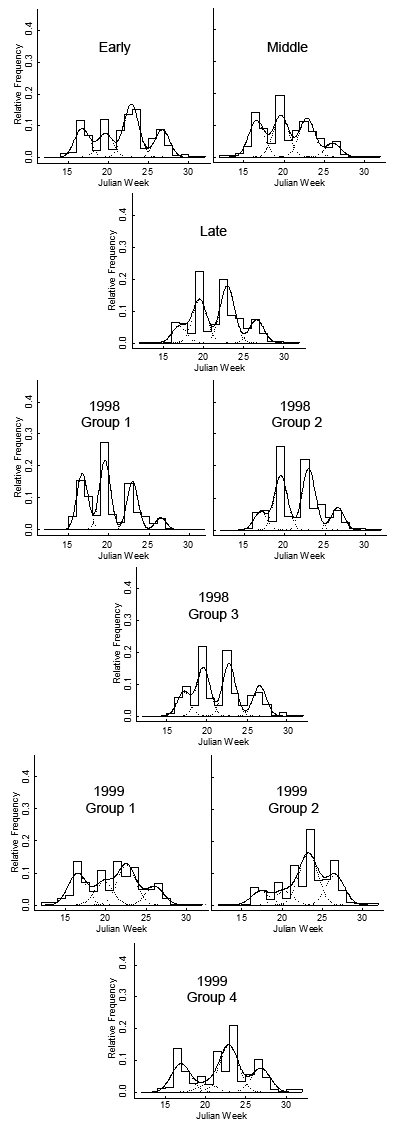 | Figure 3. S. faberi seedling emergence (proportion relative to total spring no.) from populations collected during the early (Julian week (JW) 32, top tier, left), middle (JW36, top tier, right) and late (JW40, tier 2) periods of the seed rain (1999 and 2000 seasons combined), and the 1998 (tiers 3 and 4) and 1999 (tiers 5 and 6) inter-AR groups (Group 1, most germinable; group 2 middle germination; group 3 (in 1998) or group 4 (in 1999) least germinable; developed in first article in this series) with time (Julian week, JW) during the spring and early summer of the first year after burial. Bars provide a relative frequency histogram of seedling emergence. The solid line is the seedling emergence estimate (proportion) from the mixture model (4 normal components with equal variance, see materials and methods). Dashed lines show the model’s four normal components (weighted by the mixing proportions). |
Emergence timing for the third year after burial was similar to that for the second year after burial. Emergence proportion for the third year after burial was greater during late spring and less during early summer than for the first or second years. Emergence proportion for the third year after burial was similar to that of the second year during early and mid spring.
3.1.3. Seasonal Time of Abscission
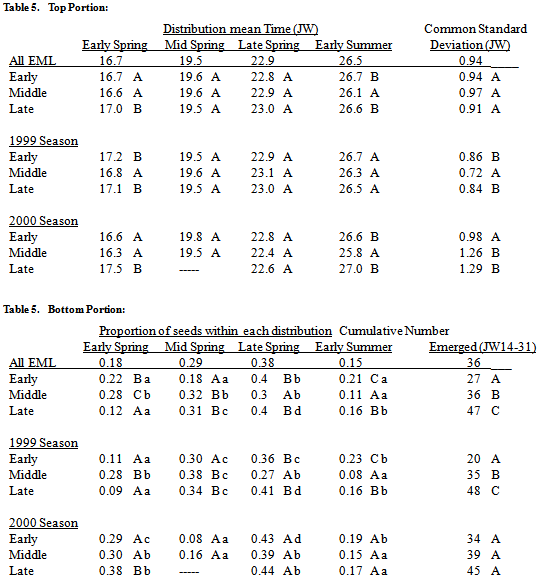
Populations of seed that matured during JW32, JW36 and JW40 were collected from eight locations; four in each of 1998 and 1999. These twenty-four populations provided a basis for the comparison of emergence patterns among seed with varying seasonal times of abscission.The 1998 populations (during the 1999 season) and 1999 populations (during the 2000 season) were modelled separately because of the strong influence of annual climatic conditions. Models with the years combined were also obtained to examine general patterns.Comparison of early-middle-late. During the 1999 season, the total number of seeds emerging during the spring (JW14-31) was lower for the early (JW32, August 1998) maturing seed than for seed maturing during the middle (JW36, September 1998) seasonal period, which in turn was lower than the total emergence from late (JW40, October 1998) maturing seed (table 5). During the 2000 season, there was no statistical difference in the number of seeds emerging from the early, middle and late maturing 1999 populations. Emergence timing was similar among early, middle and late maturing populations, with a few exceptions. The mean time of the early spring 1999 distribution was earlier for the middle 1998 populations than for the 1998 early or late populations. The 2000 early spring distribution was also earlier for the 1999 early and middle populations than for the 1999 late populations. The mean time of the 2000 early summer distribution was earlier for the 1999 middle populations than for the 1999 early and late populations. Patterns in the emergence proportions among early, middle and late maturing populations were equivocal, and varied with year.Table 5. Seedling emergence (mean times (Julian week, JW), std. deviations (JW), top portion of table; proportions, cumulative no. (per core of 200, JW14-31), bottom portion of table) of S. faberi populations collected during the early (JW32), middle (JW36) and late (JW40) periods of the seed rain within each of the four normal mixture model components (early, mid and late spring and early summer) during the first year after burial, grouped by season (1999 and 2000, 1999 only, 2000 only). In all cases, numbers in the same column, portion of the table and group (season) with the same uppercase letter are not statistically different (comparison of 95% confidence intervals, probability (p)>.05). Numbers in the same row with the same lowercase letter are not statistically different (hypothesis test, p>.05)
 |
| |
|
3.1.4. Comparison of Emergence with Seed Heteroblasty at Abscission
The hypothesis that Setaria seedling recruitment timing is predicated on the dormancy state heterogeneity at abscission was tested in two ways. First, seed germinability of S. faberi populations at abscission was compared to their cumulative seedling emergence at five different times (Julian weeks 18, 20, 24, 28, and 48) during the following year using Spearman rank correlations. Second, the emergence patterns of the heteroblastic AR groups developed in the first article in this series were compared using four recruitment distribution mixture models.Cumulative emergence. There was a positive correlation between dormancy capacity at abscission and the cumulative number of seeds emerged at all five times during the first year after burial for the 1998 S. faberi populations, and at Julian weeks 28 and 48 for the 1999 populations, as indicated by the Spearman coefficients. For the 1998 populations, Spearman coefficients at each time were between .53 and .73 (p-values<.02). For the 1999 populations, there was no statistical correlation between dormancy capacity at abscission and cumulative emergence in 2000 at JW18-24 (Spearman coefficients .30-46, p-values .22-.06), but there was a positive correlation at JW28 (.59, p-value=.01), and at JW48 (.52, p-value=.03).Cumulative 1999 spring emergence numbers (JW14-31) for the 1998 heteroblastic AR groups also showed an association with dormancy capacity at abscission. AR group 1, the least dormant group, had more spring emergence than AR group 2, which in turn had more spring emergence than AR group 3, the most dormant group (table 6). Spring 2000 emergence for the 1999 AR groups was more variable, thus there was no clear association between AR group and cumulative emergence.Emergence pattern: 1998 AR groups. A four peak spring 1999 emergence pattern was observed for each of the three 1998 AR groups (figure 3, middle row). The proportion of seeds emerging during the early summer 2000 increased from AR group 1 (the most germinable group) to AR group 3 (the least germinable group) (table 6). Proportions in the other distributions also varied, but the pattern was unclear. The mean times of peak emergence were generally similar among the three groups.Emergence pattern: 1999 AR groups. The spring 2000 emergence patterns for the 1999 AR groups were more variable than for the 1998 heteroblasty groups (figure 3; table 6), with the exception of the 1999 group 3, which consisted of a single population with an unusual germination pattern (see first article in this series). The proportion of emergence occurring during mid spring 2000 was higher for group 1 (the most germinable group) than for groups 2 or 4. Proportions in the other distributions also varied, but the pattern was unclear. The mean times of peak emergence in 2000 for the 1999 AR groups varied more than for the 1998 groups. The mean time of the early summer 2000 peak was earlier for group 1 than the mean time for group 2, which in turn was earlier than the mean time for group 4. Other patterns in timing were less clear.
3.2. Summer and Autumn Emergence
Foxtail seeds can germinate and emerge even in December (figure 1, right; table 2). The number of seeds emerging after mid July (JW32) was very low, thus no statistical model was used. However, some patterns did emerge.
3.2.1. Burial Year
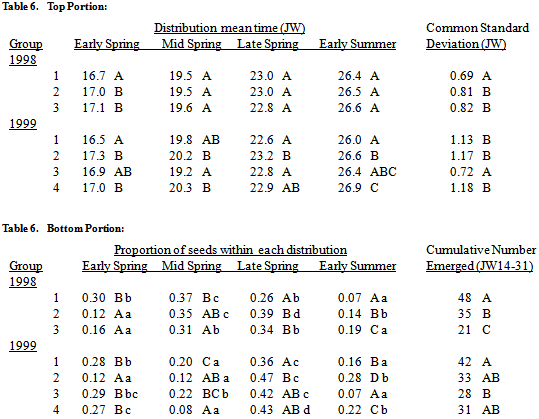
Many populations commenced emergence of small numbers of seedlings in the autumn of the burial year, most prominently in 1997. Emergence during the autumn of the burial year occurred during JW43-44 in 1997, during JW38-49 in 1998, and during JW42-47 in 1999. Eighty-three percent of the 94 population/common nursery combinations had 1% or less of their seeds emerge during the summer and autumn of the burial year. Only O97-36, O97-37 and W98-40 had more than 2% emergence during the burial year.Table 6. Seedling emergence (mean times (Julian week, JW), std. deviations (JW), top portion of table; proportions, cumulative no. (per core of 200, JW14-31), bottom portion of table) of the 1998 and 1999 inter-AR groups (developed in Jovaag, Atchison, and Dekker, 2009a) within each of the four normal mixture model components (early, mid and late spring and early summer) during the first year after burial, grouped by season (1998: Group 1, most germinable; group 2, middle germination; group 3, least germinable; 1999: group 1, most germinable; group 2, middle germination; group 3, unusual population; group 4, least germinable). In all cases, numbers in the same column, portion of the table and group (season) with the same uppercase letter are not statistically different (comparison of 95% confidence intervals, probability (p)>.05). Numbers in the same row with the same lowercase letter are not statistically different (hypothesis test, p>.05).
 |
| |
|
3.2.2. First Year After Burial
Late season (JW32-49) recruitment in the first year after burial occurred in only a few populations, and only with seed that matured in September or October (least dormant at abscission) of the previous year. Late season recruitment only occurred in two cohorts: mid-summer (JW32-35) and autumn (JW 45-49). Mid-summer emergence occurred only in mid and late maturing populations (collected after JW35). Autumn emergence occurred only for O97-37 at Johnson during the 1998 season; no autumn emergence occurred in the 1999 or 2000 seasons. Late summer and autumn of 1998 was warmer than that of 1999 or 2000. No population averaged more than 0.5% emergence (1 seed/core) during the summer and autumn of the first year after burial, and most had none at all.
3.2.3. Second Year After Burial
Late season recruitment in the second year after burial only occurred in mid-summer (JW32-35). Mid-summer emergence averaged less than 0.67%, and most populations (74%) had none. Data was available only for populations buried in 1997 and 1998.
3.2.4. Third year after burial
One O97-37 seed emerged during JW33 of the third year after burial (2000 season). Data was available only for populations buried in 1997.
4. Discussion
4.1. General Seedling Recruitment Pattern
A complex pattern of S. faberi seedling emergence was observed consisting of six discrete cohorts during the growing season (JW16-49; table 2). The majority were recruited during four early season (JW16-31) emergence periods, and a small minority during two later season (JW32-49) emergence flushes. This complex pattern of discrete, discontinuous seedling emergence was unexpected. A priori expectations were of a large, continuous flush of emergence in early season followed by low, sporadic numbers during the late season, as reported previously (e.g., Forcella et al 1992, 1997).
4.2. Early Season Recruitment
A complex oscillating pattern of S. faberi seedling emergence was observed in the first half of the growing season (JW16-31) in all 503 cores of the 39 populations studied, and formalized using a mixture model consisting of four normal distributions which consistently fit data from different populations and years. The consistent appearance of these four normal distributions provides strong evidence of the existence of discrete recruitment cohorts arising from inherent somatic polymorphism in seed dormancy states (seed heteroblasty). Changes in the recruitment of early season S. faberi cohorts in response to several factors were reflected in their timing, the proportional distribution among the individual seasonal cohorts, and the total number of seedlings that emerged.
4.3. Parental and environmental influences on recruitment
Fine scale changes in seedling emergence patterns in response to changes in parental qualities (time of abscission) and environmental conditions (year, common nursery, seed age in the soil) indicate that S. faberi has the ability to adapt its behaviour on a fine scale to a locality by generating multiple, well-timed and numbered, pulses of seedlings over the course of the growing season.
4.3.1. Parental Influences
Seed heteroblasty is induced during embryogenesis and modulated by the specific seasonal conditions experienced by the parental plant (Dekker, 2003). The influence of seasonal environment on dormancy induction is apparent at the time of seed abscission from the parent plant: the earliest maturing (August) seed was more dormant than middle (September) seed, which in turn was more dormant than late (October) seed (first article in series).The influence of seed heteroblasty was more apparent in recruitment number, less so in pattern. Total seedling recruitment in was often inversely related to the time of seed maturity from August to October. This inverse relationship between the time of abscission and the number of seeds subsequently emerging during the spring and early summer was observed in 1999 and the second half of 2000. Further, mid-summer to autumn emergence during both 1999 and 2000, while low, came only from middle and late maturing populations. During the first half of 2000, there was generally no difference in the emergence numbers, proportions or timing among seeds with different abscission times. This similarity indicated that environmental conditions dominated emergence patterns in 2000. The greater variation in emergence proportion and number during 1999 indicated that environmental conditions were less dominant, and parental variability more influential, than in 2000.Seed heteroblasty had some influence on emergence pattern: less dormant populations sometimes emerged earlier than more dormant. In years producing more germinable seeds, the majority generally emerged earlier compared to those years producing relatively more dormant seeds. 1997 seeds were less dormant than 1998 seed, and the majority of 1997 seeds subsequently emerged earlier in 1998 than did 1998 seed recruited in 1999. 1998 seeds were less dormant than 1999 seeds, and the majority of 1998 seeds subsequently emerged earlier in 1999 than did 1999 seed recruited in 2000.
4.3.2. Year
Seasonal conditions (year) had the greatest influence on S. faberi recruitment relative to other environmental parameters studied. Total emergence was greater in 1999 than in 2000. The timing of emergence varied depending on how the different heteroblastic seed cohorts responded to the different environmental conditions of a particular year. With changes in year from 1999 through 2000 the early spring cohort proportion increased, the mid-spring cohort decreased and occurred earlier, and the late spring cohort proportion increased and occurred earlier. Relative to inherent heteroblastic influences on recruitment, seasonal influences were more apparent in the 2000 season than in the 1999 season (based on Spearman correlations).
4.3.3. Common Nursery
S. faberi seed populations responded differently to the common, local, environmental conditions in which they were buried in terms of numbers and time of emergence.Greater total recruitment occurred in the Johnson nursery compared to that at Crawfordsville. There was an off-setting temporal shift among emergence cohorts at the two common nurseries. The greater Johnson recruitment numbers occurred one week earlier in the mid-spring to early summer cohorts.
4.3.4. Seed Age in the Soil
There was no consistent relationship of seed age in the soil with the timing and proportion of emergence, evidence of the inherency of seed dormancy capacity. Recruitment numbers (as well as the soil seed pool size) declined rapidly during the early season (JW16-31) as seed age in the soil increased from one to three years.
4.4. Relationship of Seed Dormancy Heteroblasty and Seedling Emergence
Fine scale differences in seed dormancy capacities (first article in series), dormancy cycling in the soil (second article in series), and seedling emergence behaviour were observed among S. faberi populations. Further, a clear relationship between these behaviours of a S. faberi population during its seed-seedling life history stages was observed, evidence consistent with the hypothesis that seedling recruitment is predicated at the outset by seed heteroblasty, and subsequently modulated by the environment.The life history trajectory of the individual S. faberi seed, from anthesis and embryogenesis to germination and seedling emergence was determined in the first instance by the inherent, parentally-induced, dormancy capacity of the seed, but was sensitive to the environmental conditions confronted on different time scales. This, consequential, life history trajectory was first apparent in dormancy-germinability cycling in the soil (second article in series). At the widest temporal scale studied, heteroblastic qualities largely determined the numbers of seeds that are recruited in a single year and locality. On a finer temporal scale (weekly or daily), the distribution and timing (pattern) of seedling emergence was strongly influenced by the unfolding seasonal environment. The life history trajectory is therefore both deterministic and plastic, conditional on starting conditions (parentally-induced dormancy capacity) and modulated by environmental conditions confronted subsequently. The resulting seedling recruitment in a locality is an emergent property of these complex interacting factors.A relationship between seed heteroblasty at abscission and its subsequent behaviour in the soil was observed. Individual S. faberi seed populations retained heteroblastic qualities throughout their annual soil germinability cycle (high spring germinability, summer dormancy re-induction, increased autumn germinability). Retention of heteroblasty was evident in the variable proportions of candidate seeds within a single population in the soil at individual seasonal times. The influence of heteroblasty was also apparent in the heterogeneous decline in germinability of seed in the soil from early spring to early summer. Further, the germinability pattern of the candidate pool in the soil (high in spring, low in summer, somewhat increased in autumn) was consistent with the emergence pattern (high in spring and early summer, low in mid summer, none in late summer-early autumn, low in mid-late autumn).A relationship between seed heteroblasty at abscission from the parent plant and its subsequent seedling recruitment behaviour was also observed. This influence, modulated by environment, was apparent in both seedling recruitment numbers and temporal emergence patterns. Evidence of this relationship between heteroblasty and emergence numbers was provided by the positive Spearman correlation between dormancy capacity at abscission and the cumulative number of seeds emerged during the first year after burial for both the 1998 and 1999 S. faberi populations. Additionally, more dormant populations had lower emergence numbers during the first year after burial than less dormant populations. This was more apparent during the 1999 season than the 2000 season. Further evidence was provided by the inverse relationships between time of abscission and subsequent emergence numbers during 1999 and the second half of 2000. Early maturing seed was the most dormant and had the least number of seeds emerging. Seed maturing late in the season was the least dormant and had the greatest number of seeds emerging. During the first half of 2000, environmental conditions strongly dominated emergence numbers and patterns such that no relationship with time of abscission was observed. The 1998 seed dormancy heteroblasty (AR) groups (first article in series) also provided evidence of this relationship: the most dormant seed (AR group 3) had the least emergence, while the least dormant seed at abscission (AR group 1) subsequently had the greatest number of seeds emerging. Further, the least dormant seed generally emerged earlier: AR Group 1 had the most early spring emergence, and the least early summer emergence.
4.5. Seedling Emergence Hedge-Betting for Assembly in Agro-Communities
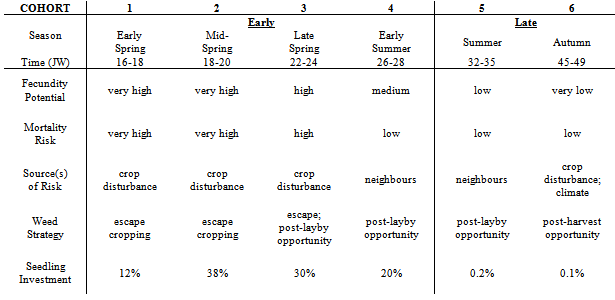
The current study provides insights about weedy hedge-betting strategies of S. faberi for invasion, colonization and enduring occupation of central Iowa agricultural fields. Fitness in S. faberi is conferred by strategic diversification of seedling recruitment when confronted by risks from agricultural disturbance and heterogeneous, changeable habitats. Evolutionarily, hedge-betting is a strategy of spreading risks to reduce the variance in fitness, even though this reduces intrinsic mean fitness. Hedge-betting is favoured in unpredictable environments where the risk of death is high because it allows a species to survive despite recurring, fatal, disturbances. Risks can be spread in time or space by either behaviour or physiology. Risk spreading can be conservative (risk avoidance by a single phenotype) or diversified (phenotypic variation within a single genotype) (Cooper & Kaplan, 1982; Philippi & Seger, 1989; Seger & Brockman, 1987).Hedge-betting of seedling recruitment time and pattern reduces temporal variance in fitness of S. faberi in agroecosystems characterized by annual cycles of disturbance and unpredictable climatic conditions. Earlier emergence allows for greater biomass and potentially explosive seed production at season’s end (Dekker 2004), but also has a high risk of death from agricultural practices. Later emergence has a lower potential for seed production, but also a lower risk of death. Thus variation in germination time results in both a decrease in the maximum and an increase in the minimum potential seed production, reducing fitness variability and ensuring enduring occupation of the locality. Variation in germination time has the additional benefit of reducing sibling competition, which enhances individual fitness (Cheplick 1996).Hedge-betting by S. faberi begins with the birth of seeds and the induction of heteroblastic differences that are subsequently echoed in seedling emergence behaviour. The complex pattern of emergence observed in this study reveals the actual hedge-bet structure for central Iowa S. faberi seedling recruitment, its realized niche. The relative seedling investment made by S. faberi at different times during the season is a consequence of the changing balance between the risk of mortality and the potential fecundity during those periods.There exists some predictability to the primary sources of mortality and recruitment opportunities for S. faberi in Iowa agroecosystems over the course of their annual life histories (Tables 2, 7). The majority of seedlings are recruited in the spring when the risk of mortality is very high from crop establishment practices (seedbed preparation, planting, weed control) and the rewards are the greatest. Weed seedlings emerging early have the greatest time available for biomass accumulation and competitive exclusion of later emerging neighbours. Subsequent fitness devolves on those individual S. faberi plants that escape these disturbances.Seedling recruitment in the late spring and early summer is affected by the cessation of all agricultural disturbances and weed control tactics, a time termed ‘layby’ in the Midwestern US. Seeds emerging after layby avoid mortality from cropping disturbances, and the risk of death shifts to that from interactions with neighbours. Freed from cropping disturbance risk, seedlings emerging post-layby face increasing competition from crop and weed neighbours and decreasing time for biomass production. Subsequent fitness devolves on those plants freed from human intervention that compete effectively with neighbours until harvest, an advantageous opportunity space-time apparent from the seedling investment observed.Table 7. Time (season; time, Julian week (JW)) of Setaria faberi seedling recruitment cohorts (Table 2) exploiting opportunity space-time in disturbed local habitats of central and southeastern Iowa corn-soybeans cropping system fields: potential fecundity, risk of mortality, weed strategy (see text) and percent investment of total seedling number
 |
| |
|
Very small S. faberi seedling investments are made late in the season when the risks of mortality are much lower. Seedlings recruited late experience a senescing crop light canopy. Those emerging during or after harvesting experience mortality risks only from the approaching winter climate. Floral induction in S. faberi is increasingly stimulated by decreasing photoperiod, allowing a seedling with as few as 2-3 leaves to produce a few seeds very late in the season (e.g. Oakwood site, 1998; data not reported). This justifies a small hedge-bet investment yielding low numerical returns but ensuring some potential increase in soil seed pool size for future infestations.The time of seedling emergence determines what individuals assemble in plant communities and how they interact with neighbours. Recruitment timing therefore determines how much biomass successful plants can accumulate, which directly predicates seed productivity (Dekker, 2004). Fitness devolves on pre-adapted individual S. faberi plants that anticipate the unfolding opportunity space-time. The hedge-betting structure of S. faberi revealed in these papers supports the conjecture that the inherent variation in seed dormancy capacities among seeds dispersed by a parent plant provides a germinability ‘memory' of historically successful seedling recruitment responses to local disturbance allowing exploitation of local opportunity in space and time (Trewavas, 1986).
References
| [1] | Cheplick GP (1996) Do seed germination patterns in cleistogomous annual grasses reduce the risk of sibling competition? Journal of Ecology 84, 247-255. |
| [2] | Cooper WS & Kaplan RH (1982) Adaptive “coin-flipping”: a decision-theoretic examination of natural selection for random individual variation. Journal of Theoretical Biology 94, 135-151. |
| [3] | Dekker J (2003) The foxtail (Setaria) species-group. Weed Science 51, 641-646. |
| [4] | Dekker J (2004) Invasive plant life history determinants of yield in disturbed agro-ecosystems. XIIth International Conference on Weed Biology, Dijon, France. Association Française pour la Protection des Plantes Annales, 5-14. |
| [5] | Dekker J, Dekker BI, Hilhorst H & Karssen C (1996) Weedy adaptation in Setaria spp.: IV. Changes in the germinative capacity of S. faberi embryos with development from anthesis to after abscission. American Journal of Botany 83(8), 979-991. |
| [6] | Farnham D (2001) Corn Planting Guide. USDA Ag. Extension. Sept. 2001 |
| [7] | Forcella F, Wilson RG, Dekker J et al. (1997) Weed seed bank emergence across the corn belt. Weed Science 45, 67-76. |
| [8] | Forcella F, Wilson RG, Renner KA et al. (1992) Weed seedbanks of the U.S. corn belt: magnitude, variation, emergence, and application. Weed Science 40, 636-644. |
| [9] | Heggenstaller AH & Liebman M (2006) Demography of Abutilon theoprasti and Setaria faberi in three crop rotation systems. Weed Research 46(2), 138-151. |
| [10] | Jovaag K (2006) Life History of Weedy Setaria species-group. PhD thesis, Iowa State University, Ames, Iowa, USA. |
| [11] | McLachlan G & Peel D (2001) Finite Mixture Models. John Wiley & Sons: New York. |
| [12] | Philippi T & Seger J (1989) Hedging one’s evolutionary bets, revisited. Trends in Ecology and Evolution 4, 41-44. |
| [13] | Rominger JM (1962) Taxonomy of Setaria (Gramineae) in North America. Ill. Biological Monographs 29, 1-127. |
| [14] | Seger J & Brockman HJ (1987) What is bet hedging? Oxford Surveys in Evolutionary Biology 4, 182-211. |
| [15] | Trewavas AJ (1986) Timing and memory processes in seed embryo dormancy-A conceptual paradigm for plant development questions. BioEssays 6(2), 87-92. |
| [16] | Whigham K, Farnham D, Lundvall J & Tranel D (2000) Soybean Replanting Decisions. USDA Ag. Extension. June 2000. |
 Abstract
 Reference
 Full-Text PDF
 Full-Text HTML