-
Paper Information
- Next Paper
- Paper Submission
-
Journal Information
- About This Journal
- Editorial Board
- Current Issue
- Archive
- Author Guidelines
- Contact Us
International Journal of Plant Research
p-ISSN: 2163-2596 e-ISSN: 2163-260X
2012; 2(1): 1-8
doi:10.5923/j.plant.20120201.01
Identification and Characterization of SSR Markers Linked to Yellow Mosaic Virus Resistance Gene(s) in Cowpea (Vigna unguiculata)
 Abstract
 Reference
 Full-Text PDF
 Full-text HTML
T. D. Gioi1, K. S. Boora2, Kamla Chaudhary2
1Division of Plant Breeding and Variety Testing & Evaluation, Cuulong Delta Rice Research Institute, Thoilai, Cantho, Vietnam
2Department of Biotechnology and Molecular Biology, CCS Haryana Agricultural University, Hisar, Haryana, 125004, India
Correspondence to: T. D. Gioi, Division of Plant Breeding and Variety Testing & Evaluation, Cuulong Delta Rice Research Institute, Thoilai, Cantho, Vietnam.
| Email: |  |
Copyright © 2012 Scientific & Academic Publishing. All Rights Reserved.
Cowpea yellow mosaic virus (CYMV) infects all aerial parts of cowpea (Vigna unguiculata), causes loss of as much as 80-100 % crop yield (Chant, 1960; Gilmer et al., 1974; and Williams, 1977). The linkage of SSR markers to CYMV resistance was studied using 20 CYMV resistance lines and 20 susceptible lines of cowpea. Among 60 SSR primers used to screen polymorphism between stable resistance (GC-3) and susceptible (Chrodi) genotypes, only 4 primers were polymorphic. These 4 SSR primer pairs were used to detect CYMV resistant genes among 40 cowpea genotypes. The polymorphism obtained was used to analyse the association of the linkage markers with CYMV resistant trait using QTXb20 software. In map maker analysis and QTL mapping application, four SSR markers (AG1/AF48383, VM31, VM1 and VM3) were mapped in the same chromosome covered 88.6cM calculated from 40 progenies with 53 crossovers. This segment of chromosome was located in a part of linkage group 2 of cowpea genetic map. A QTL for CYMV resistant trait was detected in association with three SSR loci (AG1/AF48383, VM31 and VM1) with absolute probability for the association. The interval QTL mapping showed 98.4 per cent of the resistance trait mapped in the region of three loci AGB1, VM31 & VM1 covered 32.1 cM, in which 95% confidence interval for the CYMV resistance QTL associated with VM31 locus was mapped within only 19 cM. This showed that QTL for CYMV resistant trait was highly heritable. The information provided by the identified markers would be very useful in breeding programs to select cowpea lines resistance to CYMV disease.
Keywords: CYMV Resistance, Microsatellite , SSR Markers, Cowpea, Polymorphism, Quantitative Trait Loci
Cite this paper: T. D. Gioi, K. S. Boora, Kamla Chaudhary, Identification and Characterization of SSR Markers Linked to Yellow Mosaic Virus Resistance Gene(s) in Cowpea (Vigna unguiculata), International Journal of Plant Research, Vol. 2 No. 1, 2012, pp. 1-8. doi: 10.5923/j.plant.20120201.01.
Article Outline
1. Introduction
- Cowpea is one of the important legume crops in the tropical and subtropical countries (Singh et al., 1997). It is not only an important pulse crop but also used as an excellent fodder, green manure and soil improving cover crop because of its high protein content (23-29%) and its ability to fix atmospheric nitrogen (Steele, 1972). Cowpea is being cultivated over an area of about 12.5 million hectares with an annual production of over 3 million tons worldover (Singh et al. 1997). Cowpea crop is being attacked by a large number of different species of pests and pathogens belonging to various groups such as fungi, bacteria, viruses, nematodes, insects and parasitic flowering plants. However, the productivity of this crop is greatly affected by cowpea yellow mosaic virus (CYMV) which sometimes cause 80-100 % yield losses (Chant, 1960; Gilmer et al., 1974; and Williams, 1977). Microsatellites or simple sequence repeats (SSR) are DNA sequences with repeat lengths of a few base pairs. Variation in the number of repeats can be detected with PCR by designing primers for the conserved DNA sequence flanking the SSR. As molecular markers, SSR combine many desirable marker properties including high levels of polymorphism and information content, unambiguous designation of alleles, even dispersal, selective neutrality, high reproducibility, co-dominance, rapid and simple genotyping assays. Microsatellites have become the molecular markers of choice for a wide range of applications in genetic mapping and genome analysis ( Li et al., 2000), paternity determination and pedigree analysis (Ayres et al., 1997), gene and quantitative trait locus analysis (Blair and McCouch, 1997), and marker-assisted breeding (Ayres et al., 1997; Weising et al., 1998). For identification of molecular markers linked to agronomically important genes, SSR is also one of the best choices as compared to RAPD and AFLP in a more polymorphic information or more cost effective manner, respectively (Lee 1995; Kelly and Miklas 1998; Young 1999). The development and use of molecular marker technologies has also facilitated the subsequent cloning and characterization of disease, insect, and pest resistance genes from a variety of plant species (Hammond- Kosack and Jones 1997; Ronald 1998; Meyers et al. 1999). Therefore, this study was done to investigate the genetic basis of cowpea yellow mosaic virus resistance in cowpea using microsatellites markers, to tag and identify quantitative trait loci (QTLs) for resistance to cowpea yellow mosaic virus in cowpea.
2. Materials and Methods
2.1. Plant Materials
- For QTL analyses, pure lines populations and several approaches were developed to associate QTL with molecular markers (Kearsey and Farquhar; 1998). The present investigation was conducted using pure lines population of cowpea created in the Forage section, Plant Breeding Department of CCS HAU, Hisar, Haryana (India). Ninety cowpea lines were used to screen CYMV resistance under the field condition of Forage section, Plant breeding Department, in July 2005. After primary screening of 90 cowpea genotypes, 20 clearly resistant lines and 20 susceptible lines were selected for further analysis using SSR markers. Genomic DNA was isolated from the young leaves of 3 to 4 week old seedlings of cowpea lines using CTAB (Cetyl trimethyl ammonium bromide) extraction method of Murray and Thompson (1980) modified by Saghai-Maroof et al. (1984) and Xu et al. (1994).
2.2. Molecular Markers
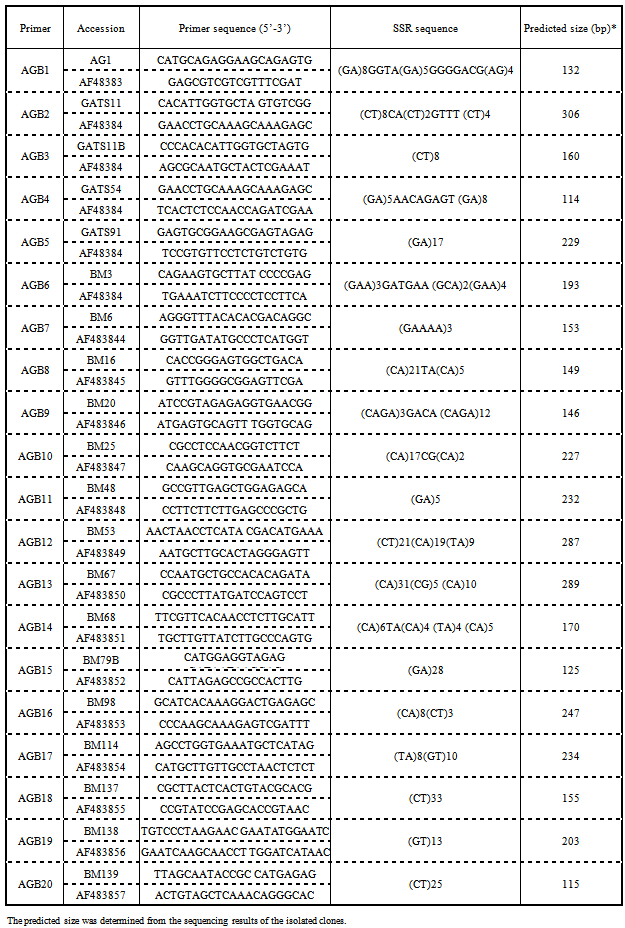
- To identify major QTL(s) for disease resistance against cowpea yellow mosaic virus in cowpea, forty SSR primers (VM1 to VM40) specific for cowpea (Vigna unguiculata) (Li et al., 2001) and 20 SSR primers (Table1) specific for moth bean (Vigna aconitifolia) were used.
|
2.3. Microsatellite Marker Analysis
- Sixty SSR primer pairs were used to detect polymorphism between standard resistant (GC-3) and susceptible (Chirodi) cowpea genotypes. The polymorphic markers were then used to carry out PCR for all individuals of 40 cowpea lines to detect the resistant genes. PCR for the amplification of template DNA was performed in PTC 100TM thermo-cycler (MJ Research Inc., Watertown, MA, USA). Total volume of PCR reactions mixture was made to 20 μl, which contained 1x PCR buffer, 200 µM dNTPs, 0.5 µM of primer (both), 2 mM MgCl2, 1.5 unit of Taq DNA polymerase and 50 ng of template DNA. PCR conditions for the microsatellite analysis included an initial pre-denaturation step of three minutes at 94℃ and following 30 cycles of 92℃ for 1 min (denaturing), 55℃ for 30 sec (annealing) and 72℃ for 1 min (extension), with the final step of extension carried out at 72℃ for 10 minutes.The PCR products were separated on 3% agarose gel by electrophoresis. The polymorphism scores were used to detect linkage group and map distances between markers loci and markers- QTLs association for the trait of yellow mosaic virus resistance using the map manager QTXb20 version 0.30. Simple linear regression and interval QTL mapping was analyzed using polymorphic scores coupling with the trait scores of resistance, susceptible reaction. Single marker analysis was done based on the simple linear regression model (Haley and Knott 1992). This single marker analysis served as the primary method of detecting association between markers and the trait. Groups of two or more closely linked markers that showed significant association were assumed to identify the same QTL.
3. Results
3.1. Polymorphism of Microsatellite Markers in 40 Cowpea Lines
- Genomic DNA of standard resistant variety (GC-3) and susceptible variety (Chirodi) were first used as template for PCR amplification to detect polymorphism between resistant and susceptible cowpea genotypes. Among 60 SSR markers used, only four SSR markers gave clearly polymorphic bands (Fig. 1). These four SSR markers were used to detect the CYMV resistant gene in 40 cowpea genotypes. Among these 4 SSR markers, the amplification products of VM31 primer pair detected polymorphisms in 16 resistant genotypes producing 200 bp DNA fragment out of 20 resistant genotypes analysed (Fig. 2). Three resistant genotypes HC98-48, HC98-63 and HC1-15 (R6, R10 and R19, respectively) generated additional DNA fragment of 180 bp. This showed the pattern of dominant effect of a resistant gene. Among 20 susceptible genotypes analysed, a 180 bp long DNA fragment band was detected in 18 genotypes. In one genotype HC2-87 (S11) an additional band of 200 bp was also observed. The resolution in agarose gel was not clear enough to see the difference between 180 bp and 200 bp band. A polyacrylamide gel was developed with 5 resistant and 8 susceptible genotypes along with 100 bp DNA ladder (Fig 3). A distinct difference between the two DNA bands could be observed.
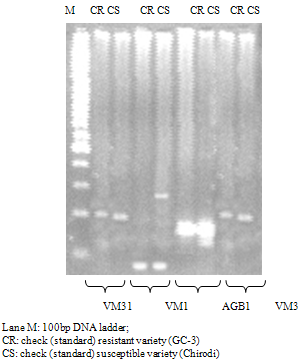 | Figure 1. Polymorphic pattern of VM31, VM1, AGB1 & VM3 PCR products between standard resistant and susceptible varieties |
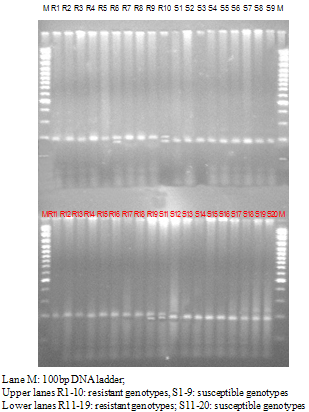 | Figure 2. Electrophoresis pattern of PCR amplified fragments of 20 susceptible & 20 resistant genotypes with SSR marker VM31 |
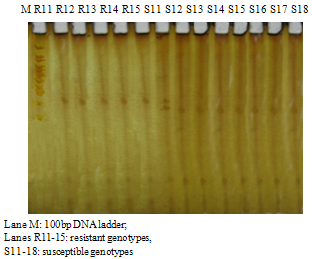 | Figure 3. Ectrophoresis pattern of PCR products of 5 resistant & 8 susceptible genotypes with SSR marker VM31 on PAGE. |
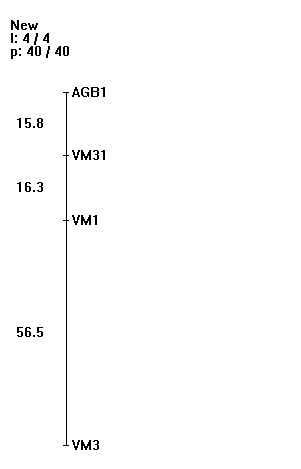 | Figure 4. Distances of 4 SSR markers in total length of 88.6 cM map calculated over 40 progenies |
3.2. Map Maker Analysis
- The polymorphic scores of SSR makers were fed to the map manager QTXb20 to analyze linkage group and map distances. The search and find linkage function made the linkage markers in the order loci and calculated the map distances (figure 4) with the detail information loaded in the stat window.
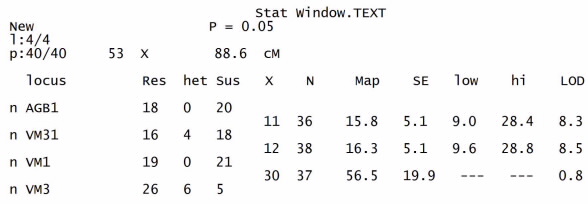 The statistics displayed in the window are the following:Res: The number of progeny with the resistant genotype at this locus. Het: The number of progeny with the heterozygote genotype at this locus. Sus: The number of progenies with the susceptible genotype at this locus X: The number of crossovers for this interval (does not include crossovers whose position is ambiguous because of missing data). N: The number of informative loci for this interval. Map: The map distance for this interval calculated using the mapping function. SE: The standard error of the map distance for this interval. Low: The lower limit of the 95% confidence interval for the map distance. High: The upper limit of the 95% confidence interval for the map distance. LOD: The LODlinkage of the markers flanking this interval.The number of progenies in both resistant and susceptible population showed variation between four SSR loci. The resistant progenies were maximally observed at VM3 locus (26) and minimal at VM31 locus (16). Some heterozygote progenies were also observed at VM31 and VM3 loci (4 and 6, respectively). The number of susceptible genotypes was variation from 5 to 21 progenies with the maximum observed at VM1 locus (21), and minimum was at VM3 locus (5). The map distances were constructed at p=0.05 with 4 loci covered 88.6cM calculated from 40 progenies with 53 crossovers (Fig. 4). The LOD scores for two intervals detected closely linkage with CYMV resistant trait were 8.3 between AGB1 and VM31 and 8.5 between VM31 and VM1.
3.3. QTL Mapping Analysis
- These polymorphic markers scores were also used to analyze simple linear regression, and interval QTL mapping along with the trait scores of resistant and susceptible reaction. The linear regression function calculated the likelihood ratio statistic (LRS) for the association of the trait with the loci, the probability of an association and estimate of the 95% confidence interval size for a QTL (CI). The detail information was summarized in Marker Regression report. The interval QTL mapping function estimated probability of the resistance trait with the interval loci distances of SSR markers (Fig. 5)
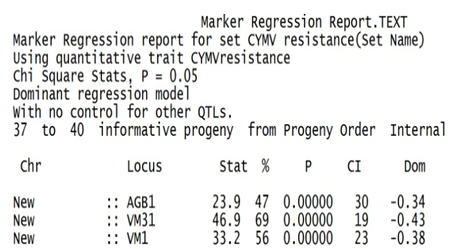 Stat: The likelihood ratio statistic (LRS) for the association of the trait with this locus. %: The difference between the total trait variance and the residual variance, expressed as a percent of the total variance. P: The probability of an association this strong happening by chance. CI: An estimate of the size of a 95% confidence interval for a QTL of this strength, using the estimate of Darvasi and Soller (1997). Dom: The dominance regression coefficient for the association. The marker regression function calculated the highest likelihood ratio statistic (46.9) and smallest CI (19 cM) at VM31 locus. That means 95% confidence interval for the QTL of CYMV resistant trait was mapped within 19 cM around VM31 locus with 46.9 likelihood ratio statistic. The interval QTL mapping estimated 98.4% of the resistant trait was mapped within the interval of three loci AGB1, VM31 & VM1 covered 32.1 cM (Fig. 5).
 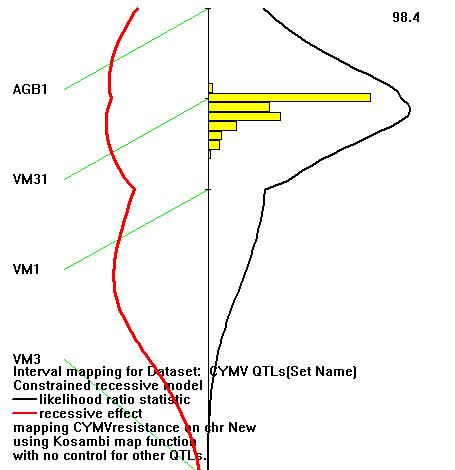 | Figure 5. Interval QTL map of 4 SSR markers in the chromosome |
4. Discussions
- Microsatellite markers have shown high levels of polymorphism in many important pulse crops such as soybean [Glycine max (L.) Merr.,Akkaya et al., 1992], beans (Phaseolus) and Vigna (Yu et al., 1999) and cowpea (Vigna unguiculata L. Walp, Li et al., 2001). The present study showed that microsatellite markers could be used to distinguish CYMV resistant lines in cowpea. In fact, four polymorphic microsatellites were able to distinguish 13 to 17 resistant lines out of the 20 resistant genotypes (data not shown). All the microsatellite primer pairs of cowpea could successfully amplify DNA from 40 cowpea lines. Furthermore, two microsatellite primer sets designed from the sequences of moth bean (AG1/AF48383 and BM98/AF483853; AGB1 and AGB16) were able to amplify DNA of cowpea in which AG1/AF48383 (AGB1) could distinguish 15 resistant lines among 20 resistant genotypes investigated. Therefore, microsatellite markers of cowpea could be used to detect CYMV resistant genes and map these genes to cowpea linkage map. In addition, these microsatellite primers could be used for comparative genome analysis between the different Vigna species.Cowpea is predominantly a self-pollinated crop and most variants appeared to be homozygous. However, heterozygous individuals may occur due to out crossing or residual heterozygosity. Plaschke et al. (1995) detected heterozygosity in wheat (a self-fertilized crop) and explained that the detected heterozygous genotypes were probably due to heterogeneity rather than the genetic heterozygosity. Roder et al. (1998) reviewed that multiple alleles in wheat are homoeologous or non-homoeologus amplified products. The present study also detected 4 heterozygosities at VM31 locus (Fig. 2) and 6 heterozygosities at VM3 locus (data not shown).
4.1. Mapping of CYMV Resistance Genes in Cowpea
- The current genetic linkage map of cowpea made by Ouedraogo et al. (2002) included 441 markers (267 AFLP, 133 RAPD and 39 RFLP) on 11 LGs spanning a total of 2670 cM, rendering it the most extensive map for cowpea available to date. The average distance between markers is 6 cM. Because the physical size of the cowpea genome is estimated to be 613 × 106 bp, 1 cM would relate to 229 kb on an average. This is less than the 360 kb for chickpea (Winter et al. 2000) or the 750 kb/cM for the high-density map of tomato (Tanksley et al. 1992). In view of plans to proceed with the map-based cloning of certain loci of interest, this information will undoubtedly prove useful in judging the degree of marker density needed to ensure the timely completion of such an undertaking. A direct application of genetic linkage maps has been in tagging genes of economic importance with molecular markers (Kumar 1999). Besides the genes controlling chilling tolerance and seed weight mapped (Menéndez et al. 1997) and the mapping of AFLP markers linked to Striga gesnerioides resistance genes (Ouedraogo et al., 2002), the present study was applied to cowpea genetic linkage map to tag microsatellite markers with CYMV resistant genes. Four microsatellite markers, AG1/AF48383 (AGB1), VM31, VM1 and VM3, were mapped on the same chromosome covered 88.6 cM. Since no microsatellite marker was present in the current cowpea genetic linkage map, this segment of chromosome can not be assigned to any linkage group of cowpea map directly. But in other relative revelation that the resistance to cowpea mosaic virus have been mapped in the linkage groups 2 in current map using AFLP, RFLP and RAPD (Ouedraogo et al., 2002), this segment of chromosome can be located in a part of linkage group 2 of cowpea genetic map.
4.2. QTL Analysis and Interval Mapping
- Some forms of plant disease resistance are genetically simple and have been analyzed extensively by traditional methods of plant pathology, breeding, and genetics (Hulbert and Michelmore, 1985). Genetically complex forms of disease resistance, by contrast, are poorly understood (Geiger and Heun, 1989). The classical quantitative genetics provided the tools for studying complex disease resistance (Falconer, 1989). However, quantitative genetics is unsuited for dissecting polygenic resistance characters into discrete genetic loci or defining the roles of individual genes in disease resistance. An effective approach for studying complex and polygenic forms of disease resistance is known as “Quantitative Trait Locus” (QTL) mapping, which is based on the use of DNA markers (Tanksley, 1993). QTL analysis is predicted, based on associations between the quantitative trait and the marker alleles segregating in the population. It has two essential stages; the mapping of the markers and the association of the trait with the markers. Both of these stages require accurate data plus statistical software. The basic theory underlying marker mapping has been available since the 1920s (Mather, 1938), but had to be extended to handle hundreds of markers simultaneously. Although slightly different algorithms are used in the final stages to smooth the results to fit the multiple marker information, the maps produced are very similar (Stam, 1993). Most QTL analyses in plants involved populations derived from pure lines and several approaches have been developed to associate QTL with molecular markers in such populations (Kearsey & Pooni, 1996). In the present study, also 40 cowpea pure lines were used to detect cowpea yellow mosaic virus QTL associated with SSR markers. The basic problem was that the trait score of a particular genotype was a single value resulting from the combined allelic effects of many genes and the environment. Two individuals could have the same genotype but a different phenotype or vice versa. This was observed at VM31 locus with the same banding pattern of 4 heterozygous genotypes, one of them had susceptible reaction with CYMV disease (HC2-87) while 3 others (HC98-48, HC98-63 and HC1-15) gave resistant phenotypes. The earlier approach to this problem was to look at all individual associations between marker and phenotype. There were three problems with this approach. First, false positives will occur if the significance level is set too low. Second, because all genes on a chromosome will show some linkage among themselves, any one QTL will be associated with several markers. Third, because the QTL will not necessarily be allelic with any given marker, its exact position and effect can not be known, although the strongest association will be with the closest marker. Interval mapping was introduced to overcome many of these problems. Intervals between adjacent pairs of markers along a chromosome are scanned and the likelihood profile of a QTL being at any particular point in each interval is determined. To be more precise, the log of the ratio of the likelihoods (LOD) of there being one against no QTL at a particular point (Lander & Botstein, 1989). Those maxima in the profile which exceed a specified significance level indicate the likely sites of QTL. Significance levels have to be adjusted to avoid false positives resulting from multiple tests, while confidence intervals are set as the map interval corresponding to a 1 LOD decline either side of the peak. This has been the most widely used approach, particularly for those using populations derived from inbred parents. Using multiple regression approach, Haley & Knott (1992) gave very similar results to LOD mapping both in terms of accuracy and precision and also has the advantages of speed and simplicity of programming. It has been adapted to handle complex pedigrees and to include a wide range of fixed effects in the model such as sex differences and environments. Tests of significance and confidence intervals can be obtained by bootstrapping approaches (Lebreton & Visscher, 1998). The current study performed single marker analysis based on the simple linear regression model (Haley & Knott, 1992). QTL detected closely linked three SSR loci, AG1/AF48383 (AGB1), VM31 & VM1 with absolutely probability of the association (0.00). Using multiple regression approach developed by Haley & Knott (1992) with significances and confidence intervals performed by bootstrap test, the present interval mapping estimated 98.4% of the resistant trait was associated within the interval of three loci AGB1, VM31 & VM1 covered 32.1 cM (Fig. 5), in which 95% confidence interval for the QTL was associated with VM31 locus in only 19 cM. It has long been clear that the confidence intervals (CI) associated with QTL locations in segregating populations are large (Hyne et al, 1995). The reliability depends on the heritability of the individual QTL. Given a typical trait with an overall broad heritability of 50 per cent or less, the individual QTL will have heritability of this 50 per cent. Thus with 5 equally sized QTL, each can only have a heritability of 10 per cent. Simulations have shown that the 95 per cent CI of such a QTL in an F2 population of 300 individuals is more than 30 cM while it is very difficult to reduce the CI to much less than 10 cM even for a very highly heritable QTL; more markers beyond a density of one every 15 cM do not help much. These distances should be viewed in the context that, on average, a chromosome is about 100 cM long. In the present study, confidence interval associated with QTL location at VM31 locus was 19 cM. This showed that QTL for CYMV resistant trait was very highly heritable. With the half of overall broad heritability calculated 49.2 per cent, the QTL was highly associated with three SSR markers (AGB1, VM31 & VM1) and most closely linkage with VM31.The information provided by the identified markers would be very useful in breeding programs to select cowpea lines resistance to CYMV disease. These markers may prove useful in marker-assisted selection for breeding of cowpea resistance to CYMV. The markers may also be used for genetic diagnostics of CYMV and isolation of the gene resistance to CYMV using map based cloning which may further be utilized in other crops for genetic transformation to incorporate the resistance for CYMV.
ACKNOWLEDGEMENTS
- This research was supported by a grant from ‘PhD. Scholarship’ between Vietnam-India Culture Exchange Program. The first author TDGioi is grateful to Indian Council for Cultural Relations, Azad Bhawan, New Delhi for providing financial support during PhD. degree programme.