
-
Paper Information
- Paper Submission
-
Journal Information
- About This Journal
- Editorial Board
- Current Issue
- Archive
- Author Guidelines
- Contact Us
Public Health Research
p-ISSN: 2167-7263 e-ISSN: 2167-7247
2026; 16(1): 14-25
doi:10.5923/j.phr.20261601.03
Received: Oct. 3; Accepted: Oct. 25, 2026; Published: Oct. 29, 2026

Systemic Failures in Water, Sanitation, and Hygiene (WASH) Expose Patients and Staff to Risk: A Cross-Sectional Study of Health Facilities in Edo State, Nigeria
 Abstract
 Reference
 Full-Text PDF
 Full-text HTML
Ola Chikerendu Egbuta1, 2, Alphonsus Oriaifo Aigbiremolen2, 3, Pierre Oziegbe Okukpon2, 3, Ekaete Alice Tobin2, 3, Stephen Obekpa Abah4
1Department of Public Health and Community Medicine, Benson Idahosa University, Benin City, Edo State, Nigeria
2Department of Public Health and Community Medicine, Irrua Specialist Teaching Hospital, Irrua, Edo State, Nigeria
3Department of Community Medicine, Ambrose Alli University, Ekpoma, Edo State, Nigeria
4Department of Community Medicine, Federal University of Health Sciences Otukpo, Benue State, Nigeria
Correspondence to: Alphonsus Oriaifo Aigbiremolen, Department of Public Health and Community Medicine, Irrua Specialist Teaching Hospital, Irrua, Edo State, Nigeria.
| Email: |  |
Copyright © 2026 The Author(s). Published by Scientific & Academic Publishing.
This work is licensed under the Creative Commons Attribution International License (CC BY).
http://creativecommons.org/licenses/by/4.0/

Background: Water, sanitation, and hygiene (WASH) are fundamental to quality care and infection prevention and control in healthcare facilities (HCFs). However, WASH services remain inadequate in many HCFs in Nigeria, where an estimated 39% lack access to improved water sources and 32% lack sanitation services. This study assessed WASH services in secondary and tertiary healthcare facilities in Edo Central Senatorial District, Nigeria. Methods: A descriptive cross-sectional study was conducted across all nine government-owned secondary and tertiary HCFs in Edo Central Senatorial District. Data were collected using a WASH assessment tool adapted from WASH-FIT, comprising 50 indicators scored 0-2. Domain-specific and overall scores were calculated as percentages and categorised as poor (<50%), fair (50–70%), or good (>70%). Results: The most common source of water supply was water purchased from vendors (44.4%). Only 36.8% of water samples met WHO microbial quality standard (<1 E. coli/100ml). Although all HCFs had improved sanitation facilities, none provided basic sanitation services. Most HCFs (66.7%) had an overfilled, unfenced burial pit for disposal of general waste, while only 1 (11.1%) had a functional incinerator. About 55.6% of the HCFs used Veronica buckets as their main hand hygiene stations. Most HCFs (77.8%) had no planned budget for WASH, and 55.6% lacked WASH/IPC team. Overall, 88.9% of the HCFs had poor WASH service coverage. Conclusion: Significant gaps exist in WASH services across secondary and tertiary HCFs in Edo Central District. Addressing these gaps requires political commitment, innovative financing models, and context-specific strategies to fortify healthcare infrastructure and prevent healthcare-associated infections.
Keywords: Hand Hygiene, Healthcare facilities, Infection control,Sanitation, Water
Cite this paper: Ola Chikerendu Egbuta, Alphonsus Oriaifo Aigbiremolen, Pierre Oziegbe Okukpon, Ekaete Alice Tobin, Stephen Obekpa Abah, Systemic Failures in Water, Sanitation, and Hygiene (WASH) Expose Patients and Staff to Risk: A Cross-Sectional Study of Health Facilities in Edo State, Nigeria, Public Health Research, Vol. 16 No. 1, 2026, pp. 14-25. doi: 10.5923/j.phr.20261601.03.
Article Outline
1. Introduction
- Water, sanitation, and hygiene (WASH) are fundamental determinants of human health and wellbeing. Access to safe water, adequate sanitation, and appropriate hygiene practices significantly reduces disease burden and mortality, alleviates poverty, and contributes to socioeconomic development. [1], [2], [3], [4] Within healthcare facilities (HCFs), WASH services are essential for patient safety and quality care. WASH in healthcare facilities encompasses the provision of basic water, sanitation, hygiene, waste management and environmental cleaning infrastructure, resources, services and practices across all parts of a health facility. [5] Effective infection prevention and control (IPC) measures, including hand hygiene, environmental disinfection, linen management, and healthcare waste management, depend on reliable WASH services. Functional WASH infrastructure is also essential for routine healthcare activities such as food preparation, patient bathing, surgical interventions, and childbirth. WASH is especially important for maternal, newborn, and child health, as infections contracted in healthcare facilities remain a significant cause of mortality in these groups. [5], [6] In addition to supporting IPC, accessible and dependable WASH services can improve staff morale, boost patient satisfaction, and build trust in the health system. [5], [7] Inclusive WASH facilities, such as gender-segregated toilets with menstrual hygiene provisions and amenities accessible to individuals with limited mobility, further promote safety and dignity for both healthcare workers and service users. [8] However, infrastructure alone is not sufficient; sustainable and effective WASH implementation requires adequate staffing, training, dedicated funding, functional policies, and regular supervision. [9], [10] In the absence of these interventions, healthcare facilities become vulnerable to healthcare-associated infections (HCAIs), antimicrobial resistance, and outbreaks of preventable diseases.Water quality is also critical to IPC in healthcare settings. Irregular water availability may reduce microbial quality and increase the risk of contamination from unsafe storage or alternative sources. [11], [12] Contaminated water in HCFs facilitates transmission of faecal pathogens, posing a significant threat to patient safety. [13] Regular assessment of microbial water quality using Escherichia coli or thermotolerant coliforms as indicators is therefore essential for monitoring water safety. [14] Despite the recognised importance of WASH, global assessments reveal persistent gaps. The 2019 WHO/UNICEF Joint Monitoring Programme report showed that 26% of HCFs lacked basic water services, 21% lacked sanitation, and 16% lacked hand hygiene facilities at points of care. [8] In sub-Saharan Africa, approximately 50% of HCFs lacked basic water services, while nearly one-third had unimproved or no toilets. [8] In Nigeria, the situation remains concerning. Findings from the 2019 WASH National Outcome Routine Mapping showed that 39% of facilities had no access to improved water, 32% lacked sanitation services, and 74% lacked functional hand hygiene facilities. [15] Only one in three facilities safely segregated and disposed of healthcare waste, while 96% lacked access to combined basic WASH services. [15] These deficiencies compromise patient safety and may discourage timely healthcare-seeking behaviour. Furthermore, substandard WASH in delivery settings can discourage women from giving birth in healthcare facilities, contributing to delayed care and adverse maternal outcomes. [16] This is particularly important in Nigeria, where only 43% of births occur with the assistance of a skilled birth attendant. [17] A supportive policy environment, with clear targets, implementation plans, and funding for WASH in the HCFs, is associated with higher WASH service levels. [18] Yet, many Nigerian HCFs lack dedicated WASH budgets, operational IPC policies, and adequately trained staff. A study conducted in 63 HCFs in Edo State revealed that only 25% had written operational IPC policies and 33% routinely trained staff on IPC. [19] Similarly, a 2019 study of 99 primary and secondary HCFs in Rivers State found that while 57% had IPC guidelines, only 13% monitored implementation and 40.5% provided staff training. [20] Only two out of six HCFs in Ebonyi and Kogi States involved in a study exploring barriers to IPC implementation during labour and delivery had a dedicated budget for cleaning expenditures. [21] These systemic weaknesses hinder effective compliance with WASH and IPC practices.Regular assessment of WASH services in HCFs is essential for identifying gaps and guiding improvements. However, data on WASH infrastructure and services in Nigerian HCFs remain limited, particularly in the study area. This study therefore assessed the WASH profile and the level of WASH implementation in secondary and tertiary healthcare facilities in Edo Central Senatorial District, Edo State, Nigeria.
2. Methods
2.1. Study Design
- A descriptive cross-sectional study design was utilised for this study.
2.2. Study Area
- This study was conducted from November 2022 to January 2023 in government-owned secondary and tertiary healthcare facilities within Edo Central Senatorial District of Edo State, Nigeria. Edo Central Senatorial District is one of three senatorial districts in Edo State, comprising mainly the Esan speaking tribe, with a projected population of 924,479 as of 2022. [22] There are eight government-owned secondary healthcare facilities and one government-owned tertiary HCF in the district. The tertiary healthcare facility is a 375-bed federal government-owned hospital with a staff strength of approximately 1200 personnel, providing clinical, laboratory, radiological, and preventive services to both inpatients and outpatients. It also serves as a referral centre for the diagnosis and management of viral haemorrhagic fevers, particularly Lassa fever. The secondary healthcare facilities, owned by the state government, have bed capacities ranging from 16 to 61 and a staff strength of about 7 to 49 personnel. All the secondary HCFs offer general care to both outpatients and inpatients, while most also provide specialised care.
2.3. Site Selection
- All (nine) government-owned secondary and tertiary HCFs in Edo Central Senatorial District, Edo state were included in the study.
2.4. Selection of Water Samples
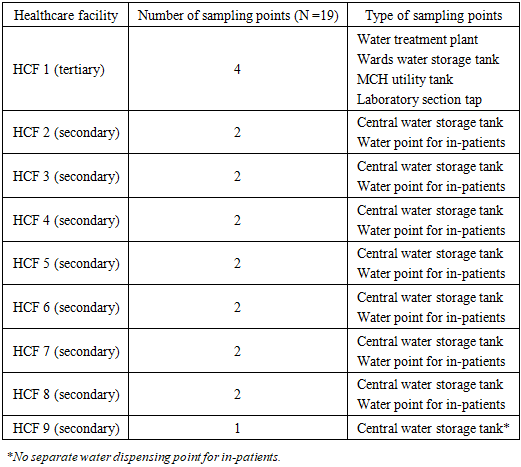
- Water samples were collected for microbial water quality testing from the main sources of water in the HCFs as well as from taps or storage containers in one randomly selected ward in each HCF. A schedule of the water sampling points and health facilities is shown in Box 1.
|
2.5. Data Collection and Measurement of Variables
- Data were collected through observation and interviews using a WASH assessment tool adapted from the WHO Water and Sanitation for Health Facility Improvement Tool (WASH FIT). [23] This tool (see Supplement 1) captured information on the general characteristics of each facility, as well as the availability, accessibility, functionality, and implementation of WASH infrastructure and services. A total of 50 indicators were used to assess the WASH profile and level of implementation across six domains: water (11 indicators), sanitation (10), healthcare waste management (6), hand hygiene (3), environmental cleaning (3), and WASH management (17). [24] Each indicator was scored as follows: “meets minimum standard” = 2, “partially meets minimum standard” = 1, and “does not meet minimum standard” = 0. Domain-specific (e.g., for Water, Sanitation) were calculated by summing the scores of all indicators within that domain. The sum was then divided by the maximum possible score for that domain and multiplied by 100 to generate a percentage score. The overall WASH implementation score for each facility was calculated similarly, using the total score from all 50 indicators. Performance was categorised as poor (<50%), fair (50–70%), or good (>70%), as derived from the adapted WASH-FIT guide (Supplement 1).
2.6. Microbial Analysis of Water Samples
- Water samples were collected from taps, storage tanks and containers using aseptic procedures. At each sampling point, 100 ml of water was collected into sterile Thio-bags and transported in a cooler with ice to the microbiology laboratory of the tertiary hospital. Samples were stored at 2–8°C and processed within 24 hours. Microbial analysis was conducted using the Aquagenx® Compartment Bag Test (CBT), a low-cost, field-appropriate method for detecting and quantifying Escherichia coli and total coliforms in 100 ml water samples, with results expressed as the most probable number (MPN). [25] The CBT shows high reliability, with a reported sensitivity of 94.9% and specificity of 96.6% compared to membrane filtration. [26] For each water sample, chromogenic growth medium was added and dissolved by gentle swirling for 15 minutes. The mixture was transferred to a five-chamber Aquagenx® compartment bag containing volumes of 1, 3, 10, 30, and 56 ml, sealed, and incubated at 35°C for 24 hours. E. coli was identified by blue or blue-green colouration in ambient light, while total coliforms were detected by blue fluorescence under ultraviolet light. The negative control showed no blue or blue-green colouration or fluorescence under ultraviolet light. Bacterial concentrations were estimated by matching the colour patterns across the five compartments with the manufacturer's MPN scoring table and reported as MPN/100 ml. The manufacturer's table provides estimates up to and exceeding 100 MPN/100 mL, with associated 95% confidence intervals.
2.7. Data Analysis
- Data were analyzed using IBM SPSS Version 21.0. Categorical variables were presented as frequencies and percentages. Descriptive statistics were used to summarize the microbial water quality data, presenting the counts of E. coli and total coliforms by WHO risk category. Given the descriptive nature of the study and the small sample size of healthcare facilities (N = 9), a comparative statistical test between groups was not conducted.
2.8. Ethical Consideration
- Ethical approval was obtained from the Health Research Ethics Committee of the Irrua Specialist Teaching Hospital, Edo State, Nigeria (ISTH/HREC/20221002/271). The purpose and procedures of the study were explained to all participants, and written informed consent was obtained prior to their participation. Confidentiality and anonymity were assured and maintained throughout the study.
3. Results
3.1. General Characteristics of the Healthcare Facilities
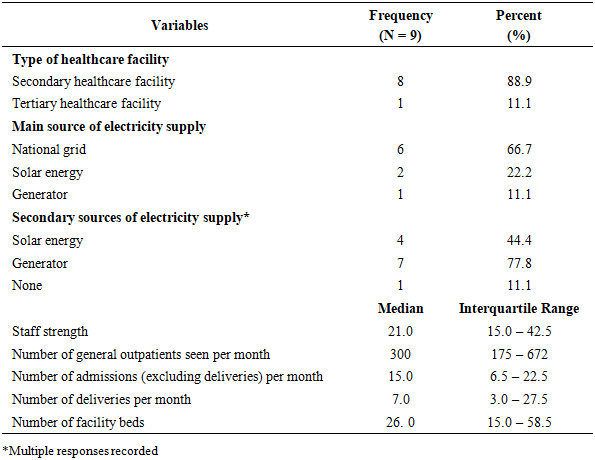
- Table 1 shows that the majority (n=8, 88.9%) of the healthcare facilities were secondary healthcare facilities. The median number of facility beds was 26.0 (IQR: 15.0 – 58.5), and the median number of general outpatients seen per month was 300 (IQR: 175 – 672).
|
3.2. Water Services in the Healthcare Facilities
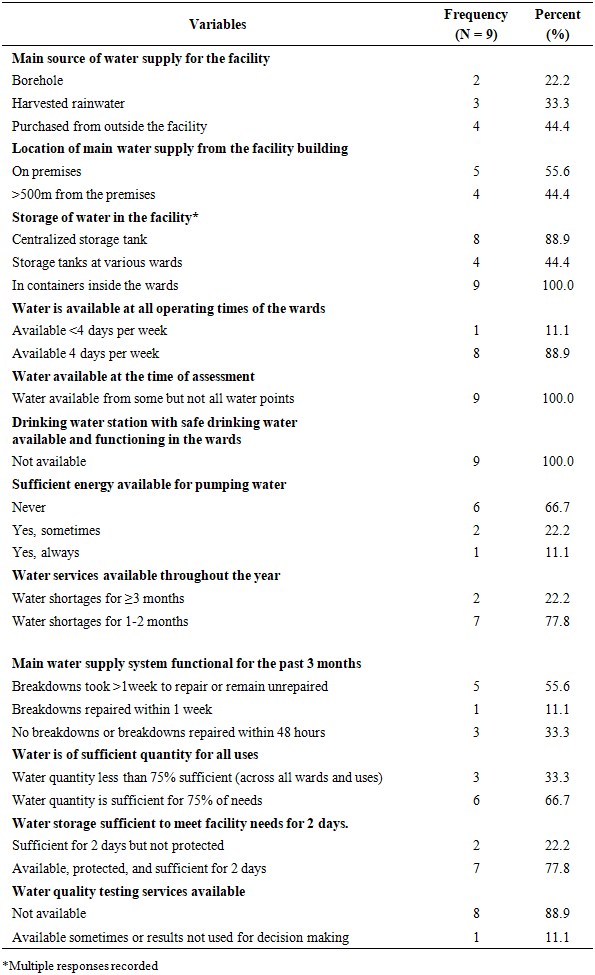
- Table 2 shows that nearly half (44.4%, n=4) of the healthcare facilities assessed relied primarily on water purchased from external vendors. A slight majority (55.6%, n=5) had their main water source located on the facility premises. Water storage in containers within the wards was a universal practice (100.0%, n=9), and most facilities (88.9%, n=8) also used a centralized storage tank. While water was available for at least four days per week in the majority of facilities (88.9%, n=8), none had a functioning drinking water station in the wards (100.0%, n=9). Furthermore, water quality testing services were absent in most health facilities (88.9%, n=8).
|
3.3. Microbial Quality of Water Samples from the Healthcare Facilities
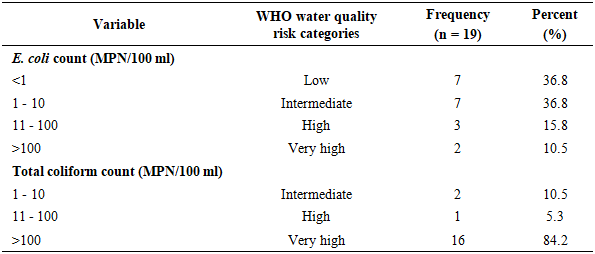
- In Table 3, it is shown that seven (36.8%) water samples from the healthcare facilities had an E. coli count of <1 MPN/100ml, while 2 (10.5%) had a count of >100 MPN/100ml. Most water samples (n= 16, 84.2%) had a total coliform count of >100MPN/100ml (Table 3).
|
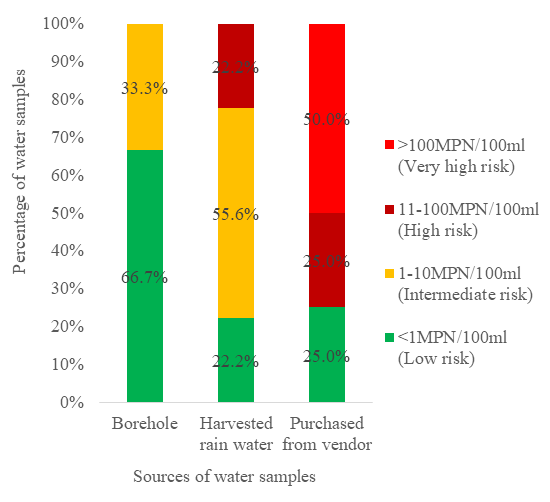 | Figure 1. Proportion of water samples from the healthcare facilities by WHO E. coli risk category |
3.4. Sanitation Services in the Healthcare Facilities
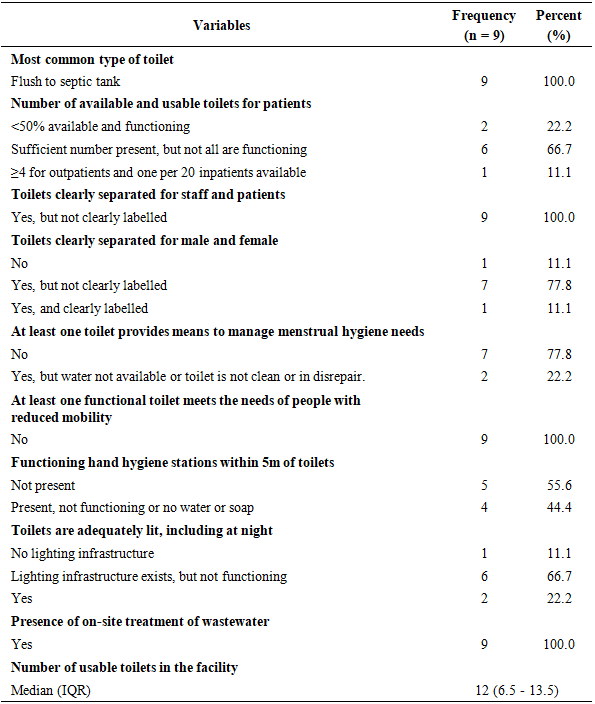
- Table 4 shows that all HCFs (100.0%) used flush toilets connected to septic tanks. The median number of usable toilets was 12 (IQR: 6.5 - 13.5). Although all the HCFs (100.0%) had toilets separated for staff and patients, these toilets were not clearly labelled. Seven (77.8%) HCFs lacked toilets that provided means to manage menstrual hygiene needs. All facilities (100.0%) lacked a toilet that met the needs of people with reduced mobility. More than half 5 (55.6%) did not have a functioning hand hygiene station within 5m of toilets.
|
3.5. Healthcare Waste Management Services in the Healthcare Facilities
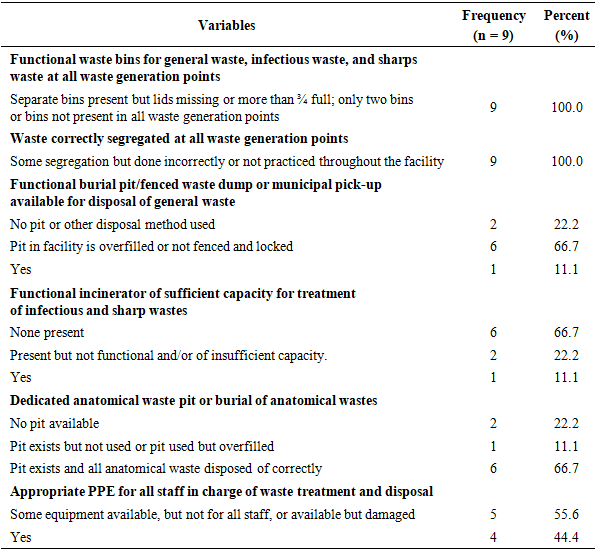
- The findings on healthcare waste management, presented in Table 5, revealed that while all HCFs (100.0%) had separate bins for waste segregation, these were non-compliant as demonstrated by missing lids, being overfilled beyond three-quarters capacity, or an insufficient number (only two) at points of waste generation. For general waste disposal, majority of facilities (66.7%, n=6) utilized burial pits, which were non-fenced and overfilled. Only one HCF (11.1%) possessed a functional incinerator of sufficient capacity for treating infectious and sharp waste, though six (66.7%) had a dedicated pit for the correct disposal of anatomical waste. Appropriate personal protective equipment (PPE) for all staff handling waste treatment and disposal was available in fewer than half of the HCFs (44.4%, n=4).
|
3.6. Hand Hygiene Services and Environmental Cleanliness in the Healthcare Facilities
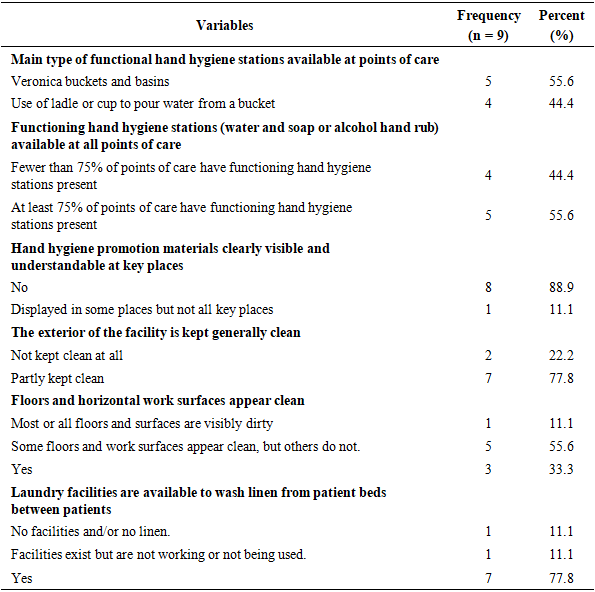
- In Table 6, it is shown that the main type of hand hygiene stations available at points of care in more than half 5 (55.6%) of the healthcare facilities were veronica buckets and basins. The exterior premises of 2 (22.2%) of the facilities were not kept clean. Laundry facilities for washing patient bed linens between use were available in 7 (77.8%) healthcare facilities.
|
3.7. Implementation of WASH Services in Healthcare Facilities
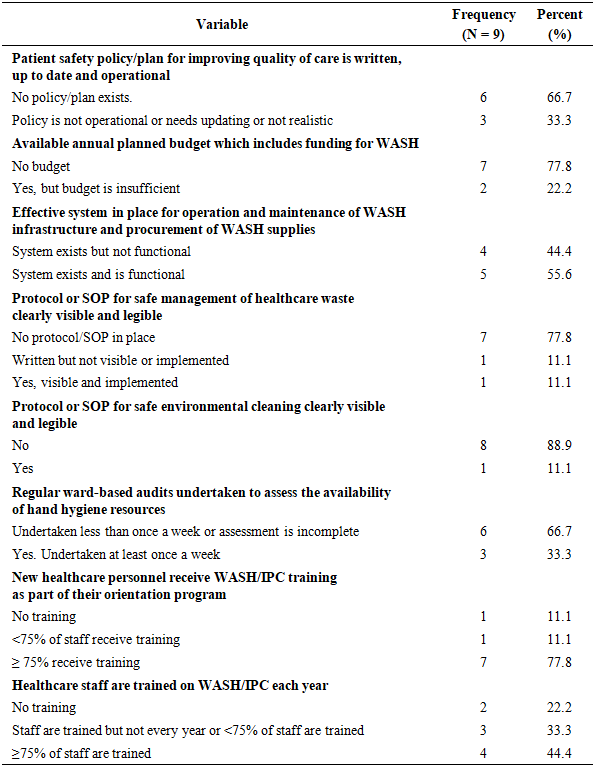
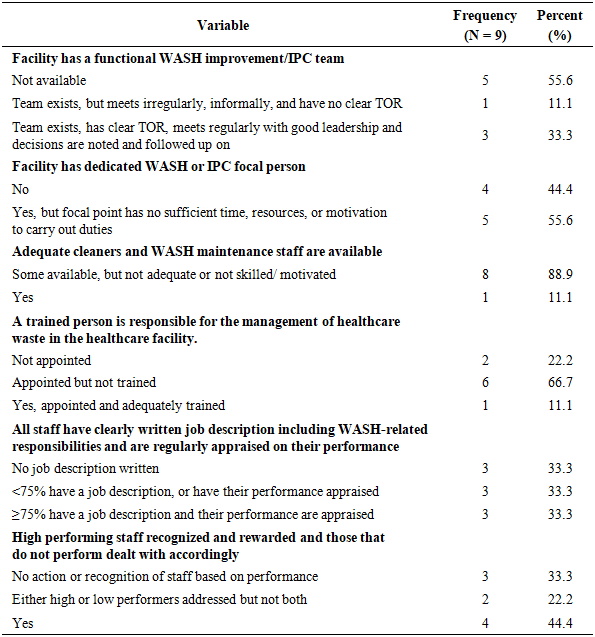
- As detailed in Table 7, a majority of HCFs (66.7%, n=6) operated without an operational patient safety policy or plan for quality-of-care improvement, and most (77.8%, n=7) had no planned budget that included funding for WASH. Just over half of the facilities (55.6%, n=5) maintained a functional system for the operation, maintenance, and procurement of WASH infrastructure and supplies. Written protocols or standard operating procedures for the safe management of healthcare waste were absent in most facilities (77.8%, n=7).
|
|
3.8. WASH Service Coverage in the Healthcare Facilities
- As shown in Figure 2, most healthcare facilities 7 (77.8%) had poor water service coverage. Likewise, 8 (88.9%) had poor sanitation service coverage, while seven (77.8%) had poor service coverage in the hand hygiene and management domain, respectively. Six facilities (66.7%) demonstrated fair service coverage in healthcare waste management, while only 3 (33.3%) had good service coverage in environmental cleaning.
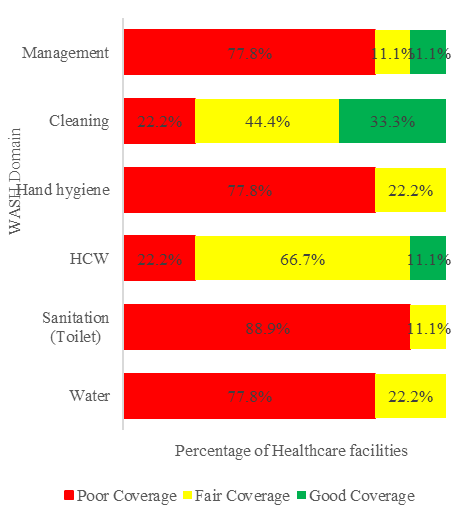 | Figure 2. WASH service coverage of the healthcare facilities according to domains |
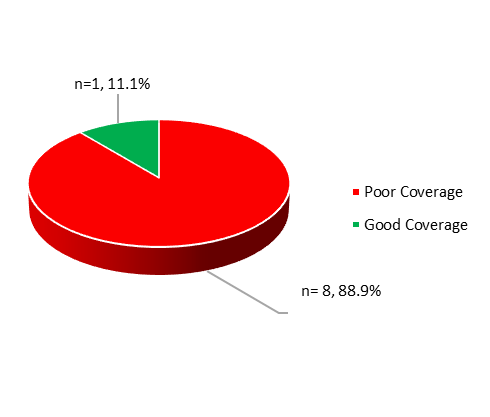 | Figure 3. Overall WASH service coverage of the healthcare facilities |
4. Discussion
4.1. Discussion of Findings
- This study provides a comprehensive assessment of WASH services, revealing systemic failures across secondary and tertiary health facilities in Edo Central Senatorial District. The study reveals that all the healthcare facilities in the senatorial zone operate without a foundation of safe WASH, effectively making them potential hubs for disease transmission rather than centres of healing. The key deficiencies ranged from contaminated water to the absence of basic sanitation and inadequate waste management, thus revealing a healthcare environment where the foundational elements of infection prevention and control (IPC) are severely compromised, directly endangering patient and staff safety.A central finding is the heavy reliance on purchased water from vendors, with 44.4% of HCFs depending on vendors as their primary source. This contrasts with studies from other Nigerian regions, where boreholes predominate, [27], [28] suggesting local geological challenges and, more critically, a failure of public investment in reliable on-site water infrastructure. This dependence on external sources introduces significant risks; water from vendors often originates from unimproved sources and is susceptible to contamination during transport and storage in often-unclean containers, a likely key contributor to the poor microbial quality observed. Indeed, only 36.8% of water samples met the WHO standard for E. coli, indicating widespread faecal contamination. This situation creates a dangerous paradox: the water intended for hand hygiene and medical procedures may itself be a vehicle for pathogens, including opportunistic organisms like Pseudomonas aeruginosa that threaten immunocompromised patients. [29], [30] Furthermore, the universal lack of drinking water stations in wards undermines the well-being of healthcare workers and caregivers, potentially impairing their ability to provide sustained care.While all facilities had improved sanitation infrastructure, none provided basic sanitation services as defined by WHO/UNICEF. [8] The universal lack of toilets equipped for menstrual hygiene or for people with limited mobility is a critical failure to meet the needs of vulnerable populations. This not only constitutes a breach of the human right to dignity but also likely acts as a barrier to healthcare access, particularly for women and persons with disabilities. [8] These findings, consistent with studies from Ogun State and Uganda [31], [32] highlight a national and regional neglect of inclusive sanitation planning in HCFs. The deficiencies in healthcare waste management and hand hygiene represent a direct and acute IPC hazard. The improper segregation, overfilled sharps containers, and reliance on open burning (due to an 88.9% lack of functional incinerators) expose both healthcare workers and the surrounding community to infectious agents and environmental toxins. [33], [34] Similarly, the dependence on Veronica buckets without guaranteed soap or water renders hand hygiene protocols theoretical rather than practical, drastically increasing the risk of healthcare-associated infections (HCAIs). Furthermore, the documented WASH deficiencies create a dangerous ecosystem that increases the risk of propagation of antimicrobial resistance (AMR). [35], [36] The reliance on water of poor microbial quality for hand hygiene and medical procedures, combined with chronic shortages that discourage its use, compromises the most fundamental IPC measures. This environment that elevates the risk of persistent bioburden exerts a strong selective pressure, that may favour the survival and spread of resistant pathogens. [37] Moreover, the inadequate management of healthcare waste, including the common practice of open burning, provides further pathways for resistant bacteria and antibiotic residues to enter the environment and amplify the local "environmental resistome". [38] Consequently, these facilities may inadvertently be functioning as significant local amplifiers of the risk of AMR, a finding consistent with models that identify poor sanitation as a key predictor of resistance at the population level. [39] This inextricable link underscores the urgent need to reframe WASH investments as a critical frontline defence in the global fight against drug-resistant infections. [5]Underpinning all these service failures is a profound systems-level deficit in governance, funding, and human resources. The majority of facilities (77.8%) had no dedicated budget for WASH, mirroring findings from Kebbi State and other LMICs. [9], [40] This financial vacuum explains the lack of maintenance, the inability to conduct water quality tests, and the critical shortage of skilled cleaners. Furthermore, the absence of written protocols (77.8% for waste management) and functional WASH/IPC teams (55.6%) indicate a lack of structured leadership and accountability for these essential services. While initial training for new staff was common, the commitment to ongoing annual training for all staff was weak (44.4%), leading to knowledge decay and non-compliance. This creates a vicious cycle: without a budget, staff cannot be trained or equipped; without trained staff, infrastructure is not maintained or protocols followed; and without these, infections spread, undermining the very purpose of the healthcare facility.
4.2. Limitations
- This study was a one-time assessment in tertiary and secondary HCFs. This approach presented a limitation in evaluating causal relationships between WASH variables and healthcare service outcomes and comparisons between all levels of healthcare service delivery in the study area. We acknowledge that while the small number of health facilities in this study (n= 9) represents the entire population of government-owned tertiary and secondary HCFs in the senatorial district, it limits the generalizability of the exact percentages to other regions. However, the patterns and systemic issues identified in this study will serve as good pointers to WASH concerns in similar settings. It is also possible that social desirability bias occurred during the interviews as staff may have provided answers they believed were correct or expected by the interviewer. The effect of this is however moderated by the observational components of the assessment tool and the objective testing of water samples.
4.3. Conclusion and Recommendations
- In conclusion, the state of WASH in the studied HCFs is a stark symptom of systemic neglect and not merely a collection of individual shortcomings. Addressing this crisis requires targeted actions at multiple levels. Healthcare facility management should immediately develop and display clear, simple SOPs for key processes like waste segregation and hand hygiene. IPC teams must be established or revitalised with clear terms of reference and meet regularly. The State Ministry of Health must prioritize WASH by mandating a dedicated budget line for WASH/IPC in all HCF allocations and integrating WASH standards into health facility accreditation and monitoring frameworks. The Federal Ministry of Health should revise the national IPC policy to include mandatory, minimum WASH standards and a dedicated budget line for all secondary and tertiary facilities, with compliance linked to accreditation. Further Research is needed to conduct a detailed cost-analysis of achieving and maintaining basic WASH services in these settings to inform advocacy and resource mobilization efforts. Without this multi-level commitment to investing in WASH as a core component of healthcare, efforts to improve quality of care, reduce HCAIs, and ensure patient safety will remain fundamentally compromised.
ACKNOWLEDGEMENTS
- The authors acknowledge the cooperation of heads of healthcare facilities where data for this study was collected for their cooperation with the study processes.
DISCLOSURE
- None.