-
Paper Information
- Paper Submission
-
Journal Information
- About This Journal
- Editorial Board
- Current Issue
- Archive
- Author Guidelines
- Contact Us
Public Health Research
p-ISSN: 2167-7263 e-ISSN: 2167-7247
2024; 14(1): 22-26
doi:10.5923/j.phr.20241401.03
Received: Jan. 26, 2024; Accepted: Feb. 17, 2024; Published: Feb. 22, 2024

Obesity in Relation to Old Age Complications
 Abstract
 Reference
 Full-Text PDF
 Full-text HTML
Md. Habibur Rahman, Soma Chowdhury Biswas
Department of Statistics, University of Chittagong, Chattogram, Bangladesh
Correspondence to: Md. Habibur Rahman, Department of Statistics, University of Chittagong, Chattogram, Bangladesh.
| Email: |  |
Copyright © 2024 The Author(s). Published by Scientific & Academic Publishing.
This work is licensed under the Creative Commons Attribution International License (CC BY).
http://creativecommons.org/licenses/by/4.0/

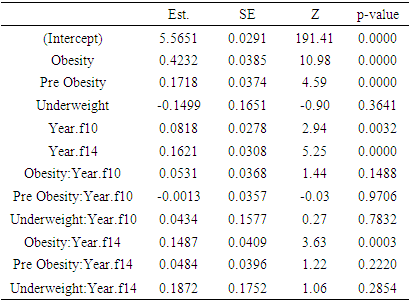
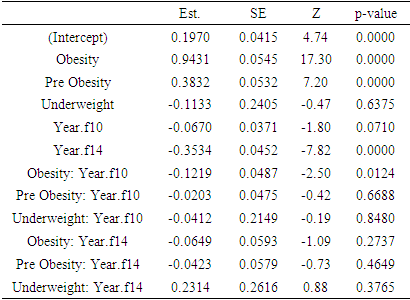
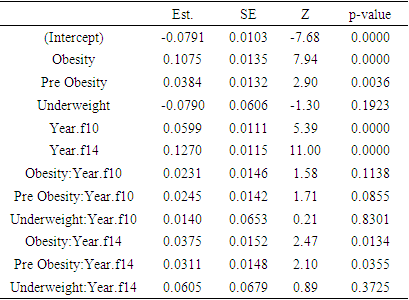
Obesity is a worldwide health concern for all ages. It is associated with morbidity and death from a variety of diseases. This study focused on the impact of obesity on the elevated levels of HbA1c, CRP, and Cystatin C in the elderly. High concentrations of these parameters are linked to numerous medical issues. The study is longitudinal based on Health and Retirement Study (HRS) data. Mean levels of these parameters were found to be highest on all the occasions for the respondents having obesity. The impact of the respondents' BMI status (obesity, pre-obesity, normal weight, and underweight) on their levels of HbA1c, CRP, and Cystatin C has been assessed using profile analysis models. The effect of obesity is found to be significant in all the models. The results of profile analysis models pertaining to HbA1c and Cystatin C produced significant interaction effects associated with obesity: Year.f14 (p = 0.0003 for HbA1c and 0.0134 for Cystatin C). Interaction effect obesity: Year.f10 is found significant (p = 0.0124) in the profile analysis model of CRP. These findings suggest that individuals with obesity are more likely to develop high levels of HbA1c, CRP, and Cystatin C over time. Hence obesity in old age is a crucial risk factor for the worsening of the elderly situation.
Keywords: Obesity, HbA1c, CRP, Cystatin C
Cite this paper: Md. Habibur Rahman, Soma Chowdhury Biswas, Obesity in Relation to Old Age Complications, Public Health Research, Vol. 14 No. 1, 2024, pp. 22-26. doi: 10.5923/j.phr.20241401.03.
Article Outline
1. Introduction
- Population aging is now a very common phenomenon all over the world. According to the World Health Organization, more than two billion people are expected to be over 60 years old by 2050. This demographic transition towards an aging society presents different challenges to providing their necessary medical facilities and ensuring a supportive environment for the elders. Various geriatric conditions and deterioration of health with aging reduce the quality of life of seniors [1]. Older people often suffer from various life-threatening infectious diseases as well as age-related non-communicable chronic diseases (NCDs) [2]. One of the main factors thought to contribute to the development and severity of non-communicable diseases is obesity. It is a global health issue that affects people of all ages [3]. A number of studies were carried out related to obesity and its impact on the elderly. Numerous medical issues, especially those related to obesity, pose a concern for the elderly (e.g., T2DM, arthritis, cardiovascular disease, metabolic syndrome, urine incontinence, and depression) [3]. According to Segula (2014) type 2 diabetes mellitus and reduced glucose tolerance are associated to obesity [4]. Honolulu Heart Program and Japanese data survey stated that there is still a predictable relationship between obesity and hypertension [5,6]. Obesity increases the risk of coronary artery disease (CAD) as in [7,8]. Obesity is linked to dyslipidemia, which is characterized by decreased high density lipoprotein (HDL) and elevated triglycerides [9]. According to Aspeden et al. (2001) osteoarthritis (OA) is common in obesity [10]. In addition to raising the risk of several chronic diseases, obesity also contributes to functional disabilities [11]. In this study effort is made based on longitudinal data to check association between obesity of the aged individuals and the elevated levels of HbA1c, C-Reactive protein (CRP), and Cystatin C. The analysis of the study was done using the nlme package of R programming [12]. The three-month average blood sugar level is evaluated using the HbA1c test, which can also be used to diagnose diabetes [13,14]. It is a crucial blood test that provides a reliable indication of how effectively diabetes is being managed. The liver releases a molecule called c-reactive protein (CRP) in reaction to bodily inflammation. High levels of CRP may mean there is a serious health condition that causes inflammation [15]. Myocardial infarction, stroke, peripheral artery disease, and sudden cardiac death are all predicted by c-reactive protein (CRP). CRP appears to be a more accurate clinical predictor of cardiovascular events than LDL cholesterol [16]. Cystatin c is a protein produced by the cells in our body, and used as a biomarker of kidney function. When the kidneys are functioning normally, concentrations of cystatin c in the blood are stable. However, as kidney function deteriorates, the concentrations begin to rise. This test measures the amount of cystatin c in blood to help evaluate kidney function [17,18].
2. Methods and Materials
- In our research work we have used data from the Health and Retirement Study (HRS). The HRS is sponsored by the National Institute on Aging (grant number NIA U01AG009740) and is conducted by the University of Michigan. Bugliari et al. (2020) described the details of the dataset [19]. It is a national cohort study for Americans over age 50 and their spouses. Beginning in 1992, samples of people were followed every two years for their social, economic, and health issues. HRS began collecting biomarkers in 2006. Biomarker refers to one-time biochemical or hematological measures made on blood or other available bodily fluids. Five biomarker viz. a. Total cholesterol b. HDL cholesterol, indicators of lipid levels c. Glycosylated hemoglobin (HbA1c) – an indicator of glycemic control over the past 2-3 months d. C-reactive protein (CRP), a general marker of systemic inflammation e. Cystatin C, an indicator of kidney functioning are considered for this purpose [20]. A random one half of the 2006 sample was preselected for biomarker information. The other half was selected in 2008. In 2010, the first half was again interviewed, and in 2012 the second half was interviewed for a second time. This creates a four-year interval between biomarker collections. To obtain the data for the study, Biomarker 2006, 2010 and 2014 data sets were merged with randhrs 1992_2016 longitudinal data file [21-24]. Finally wave 8, wave 10, and wave 12 were considered for the data of the study. In our study the following variables are chosen as response variables1. Glycated hemoglobin (HbA1c) – an indicator of glycemic control over the past 2-3 months2. C-reactive protein (CRP), a general marker of systemic inflammation3. Cystatin C, an indicator of kidney functioning.BMI of the respondents are classified in four categories as obesity (30+), pre obesity (25.0-29.9), normal weight (18.5-24.9), and underweight (<18.5) according to World Health Organization. This BMI status is used as categorical covariate. The influence of the covariate over response variables were carried out using three different profile analysis models. Profile analysis is used to compare different groups of subjects in terms of mean response over time [25]. The method requires a single categorical covariate (denoting different treatment or exposure groups) and a balanced longitudinal design. Identifying the patterns of change in the mean response over time in the groups and figuring out if the shapes of the mean response profiles differ between groups are the key objectives of the study of response profiles [25].
3. Results and Discussion
3.1. HbA1c
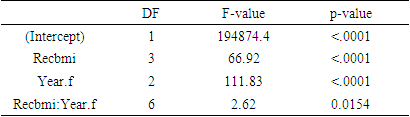
- Considering complete cases 3281 respondents were found having HbA1c value in all three (wave 8, wave 10, and wave 12) occasions. Among them number of individuals belong to obesity, pre-obesity, normal weight, and underweight are 1115, 1295, 844, and 27 respectively. Mean HbA1c levels over times according to BMI status are shown in the following table
|
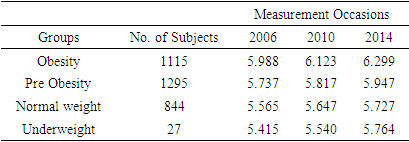
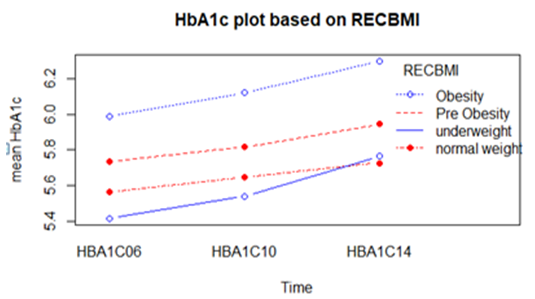 | Figure 1. Mean HbA1c over time based on BMI status of the respondents |
|
|
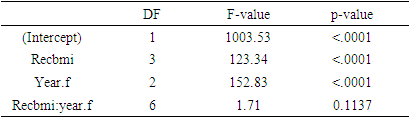
3.2. C - Reactive Protein (CRP)
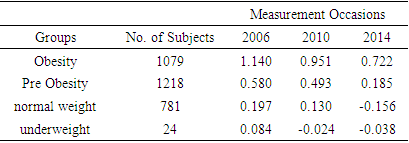
- Considering complete cases 3102 individuals were found having CRP levels on three occasions. Log transformation of the response variable CRP was made in order to ensure normality. Mean log CRP over times based on BMI status is shown in the following table
|
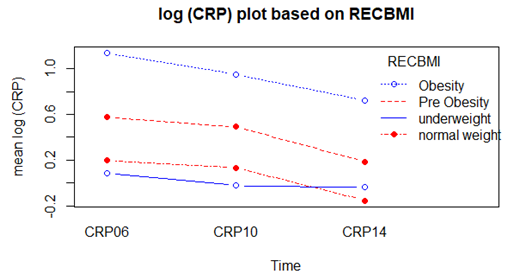 | Figure 2. Mean log CRP over time based on BMI status |
|
|
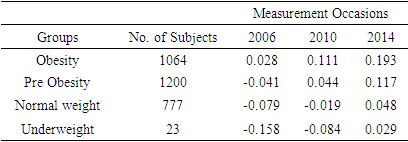
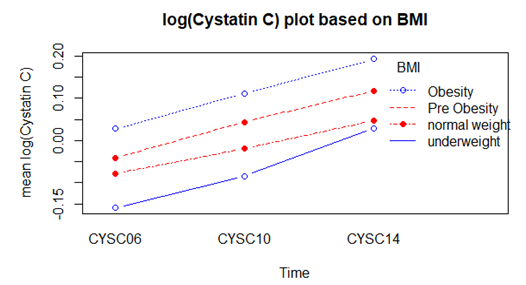
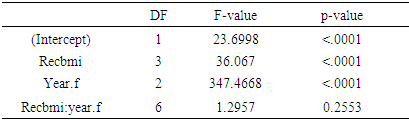
3.3. Cystatin C
- Log transformation of the response variable Cystatin C was also made in order to ensure normality. Total of 3064 respondents were found in complete data with Cystatin C measurements. Among which 1064 respondents in obesity class, 1200 in pre obesity, 777 in normal weight and only 23 in underweight. Mean log Cystatin C over time based on BMI status is shown in the following table
|
 | Figure 3. Mean log Cystatin C over time based on BMI status |
|
|
4. Conclusions
- Elevated levels of HbA1c, CRP, and Cystatin C are related to a number of medical conditions. Results of this study show that aged persons having obesity developed high levels of all the mentioned parameters. Hence obesity makes geriatric circumstances more vulnerable.