-
Paper Information
- Paper Submission
-
Journal Information
- About This Journal
- Editorial Board
- Current Issue
- Archive
- Author Guidelines
- Contact Us
Public Health Research
p-ISSN: 2167-7263 e-ISSN: 2167-7247
2023; 13(2): 39-50
doi:10.5923/j.phr.20231302.01
Received: Aug. 22, 2023; Accepted: Sep. 4, 2023; Published: Sep. 12, 2023

Integration of HIV and NCD Service Provision: Cost Savings and Implications in Nakuru County, Kenya
 Abstract
 Reference
 Full-Text PDF
 Full-text HTML
Njuguna K. David1, Caroline Kawila Kyalo2, Eunice Muthoni Mwangi3
1Health Economist, Ministry of Health, Nairobi, Kenya
2Health System Management Expert, Department of Health Systems Management, School of Medicine and Health Sciences, Kenya Methodist University, Nairobi, Kenya
3Health System Management Scientist, Department of Population Health, Aga Khan University-East Africa
Correspondence to: Njuguna K. David, Health Economist, Ministry of Health, Nairobi, Kenya.
| Email: |  |
Copyright © 2023 The Author(s). Published by Scientific & Academic Publishing.
This work is licensed under the Creative Commons Attribution International License (CC BY).
http://creativecommons.org/licenses/by/4.0/

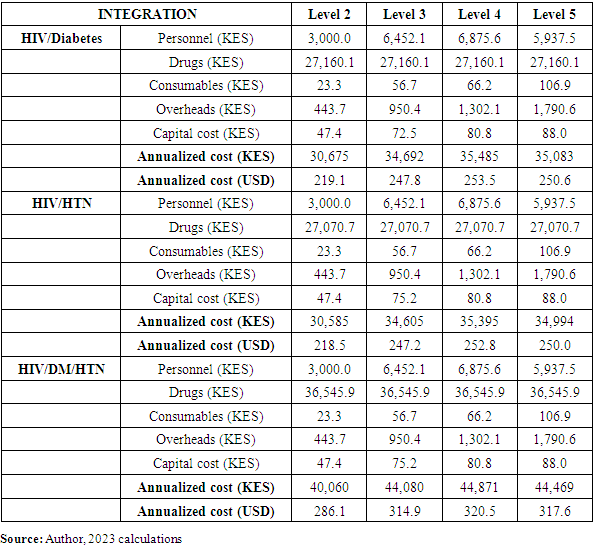
Background: Dwindling donor funding has been on the rise. Therefore healthcare systems are forced to strategize on how to manage their service delivery with the available resources. There is need to sustain the healthcare services delivery.Integration of Human Immunodeficiency Virus (HIV) and (Non-Communicable Diseases) NCDs services has emerged as a potential solution to improve patient outcomes and optimize resource utilization. This study aimed to evaluate the cost savings associated with integrating HIV services with three common NCDs: Diabetes Mellitus (DM), hypertension (HTN), and the combination of diabetes and hypertension (DM/HTN) in Nakuru County. Methods: This study utilized a hybrid costing approach that combined both top-down and ingredients approaches. The costing analysis took a health system perspective and for acute conditions, the time horizon considered was a case management episode. To determine cost savings, integrated service costs were subtracted from the cumulative costs of individual services on a per-case basis. Results: Integration of HIV and diabetes services resulted in annual cost savings of KES 7,086 (21%) per case. Similarly, integrating HIV with hypertension services yielded cost savings of KES 6,166 (19%) per case. The greatest cost savings were observed when integrating HIV with both diabetes and hypertension services, with annual savings of KES 10,653 (29%) per case. Conclusion: The study results prove that integrating HIV/NCD services would save the healthcare system costs incurred while delivering the services in a parallel model. Hence recommends that healthcare service delivery be supported using an integrated care model to enhance sustainability of the services that have been heavily funded by donors in this country.
Keywords: HIV/NCDs, Cost savings, Integration, Kenya, Costing, and Process map
Cite this paper: Njuguna K. David, Caroline Kawila Kyalo, Eunice Muthoni Mwangi, Integration of HIV and NCD Service Provision: Cost Savings and Implications in Nakuru County, Kenya, Public Health Research, Vol. 13 No. 2, 2023, pp. 39-50. doi: 10.5923/j.phr.20231302.01.
1. Introduction
- Kenya's recent reclassification as a lower middle-income country (LMIC) has significant implications for its eligibility for development assistance. As some donors begin to transition out, it is crucial to manage this transition effectively to prevent a reversal of the health gains achieved. To address this challenge, a reprogramming of health services is necessary, shifting from parallel disease programs to integrated health services and emphasizing preventive care through publicly funded primary healthcare. Integrating HIV and non-communicable disease (NCD) programs can generate cost savings that can be redirected towards strengthening healthcare systems, expanding access to care, and improving overall population health. In Sub-Saharan Africa (SSA), non-communicable diseases (NCDs) such as diabetes, neoplasms, cardiovascular diseases, and mental illnesses are prevalent among individuals living with HIV (HIV-positive people). The presence of these NCDs poses a significant threat to the progress made in HIV treatment programs. They not only contribute to increased impairment and mortality rates among HIV-positive individuals in SSA but also present additional challenges in providing comprehensive healthcare for this population [1]. People living with HIV (PLWHIV) are more susceptible to non-communicable diseases (NCDs) due to several factors. The inflammatory markers that are stimulated by HIV infection, as well as the potential adverse effects associated with antiretroviral therapy, contribute to this increased risk. Additionally, behaviors such as tobacco smoking, alcoholism, unhealthy diet, and physical inactivity further exacerbate the likelihood of acquiring NCDs among individuals with HIV. It is important to address these risk factors and promote healthy lifestyles to minimize the burden of NCDs in this population. [2]. High viral suppression and increased life expectancy among PLWHIV, and the expanded access to care also increase the window period for NCDs to progress as PLWHIV ages [3]. Elevated hypertension prevalence in PLWHIV is attributed to persistent inflammation, heightened microbial translocation and renal illness, blood vessel injury from constant ART exposure, and behavioral risk factors among PLWHIV [4]. Additionally, HIV-positive women are predisposed to infection with human papillomavirus (HPV), pre-cancer, and invasive cervical cancer somewhat due to HIV’s modifying effect on HPV pathogenesis [5]. According to the Ministry of Health in Kenya (MoH, 2021), NCDs accounted for over 50% of in-patient cases and 40% of hospital mortalities reported in Kenyan hospitals. It is worth noting that HIV services in the country are separate and operate independently. These services are delivered in a vertical manner, meaning they have a distinct focus, and they are decentralized and implemented through task shifting to effectively treat a large number of patients. [6]. Globally, the recognition of the impact of comorbidity between HIV and Non-Communicable Diseases (NCDs) has grown, revealing the complex nature of managing these conditions and the challenges they pose to the healthcare system, patients, and caregivers. The achievements in combating HIV/AIDS are hindered by the increasing prevalence of NCDs among individuals living with HIV (PLWHIV). This comorbidity not only affects the cost of care, diagnosis, and health outcomes for PLWHIV but also presents additional obstacles in their overall treatment and management. [7]. Integrating these two services will improve efficiency and enhance the utilization of NCD services [8]. Integrating HIV/NCD services in health facilities is a crucial step towards improving the overall health outcomes and well-being of individuals living with HIV/AIDS. Integrating HIV/NCD services also aligns with the global health agenda of achieving universal health coverage (UHC). UHC aims to provide all individuals and communities with access to quality healthcare services without financial hardship [9]. By integrating services, health systems can deliver a comprehensive package of care that encompasses prevention, diagnosis, treatment, and long-term management of both HIV and NCDs. This approach promotes equity in healthcare provision and helps to bridge the gap between HIV and NCD services, ensuring that no individual is left behind in accessing essential healthcare. Moreover, integrating HIV/NCD services optimizes the utilization of resources and healthcare infrastructure. Combining services for HIV and NCDs in the same facility allows for shared resources, including laboratory tests, diagnostic equipment, and healthcare personnel. This approach enhances efficiency, reduces duplication of efforts, and improves cost-effectiveness in healthcare delivery. Additionally, integrated care models promote early detection, prevention, and management of NCDs among PLWHIV, resulting in improved health outcomes, and reduced long-term treatment expenses. By combining efforts, HIV/NCD integration not only improves patient care but also maximizes cost-effectiveness, making it a sustainable and efficient approach to healthcare delivery [10].Cost savings are a compelling driver for the integration of HIV and non-communicable disease (NCD) services. Estimating and understanding the potential cost savings associated with integration is important for several reasons. Firstly, healthcare systems worldwide face financial constraints and limited resources. By integrating HIV and NCD services, synergies can be achieved, leading to more efficient use of available resources. Estimating cost savings helps healthcare policymakers and administrators make informed decisions about resource allocation, budgeting, and planning. It provides them with evidence to advocate for the integration of services and secure necessary funding. Secondly, cost savings are crucial for sustainability. By optimizing resource utilization, integration can help mitigate the financial burden on healthcare systems. This is particularly relevant in low- and middle-income countries, where resources are often scarce, and the prevalence of both HIV and NCDs is high. Estimating cost savings helps ensure the long-term viability and scalability of integrated programs, as it demonstrates the potential return on investment and the financial benefits of integration.Furthermore, estimating cost savings provides a framework for evaluating the economic impact and cost-effectiveness of integrated HIV/NCD services. It allows for comparisons with alternative approaches or interventions, helping policymakers prioritize resource allocation based on the potential benefits and efficiency gains. Cost-effectiveness analyses can inform decision-making by identifying the most economically viable strategies for improving health outcomes and reducing the burden of disease. Estimating cost savings also contributes to advocacy efforts. It provides tangible evidence that integration is not only beneficial from a health perspective but also economically advantageous. This evidence can be used to garner support from stakeholders, policymakers, and funders who may be more inclined to invest in integrated programs if they can see the potential financial gains.Additionally, estimating cost savings helps identify areas where efficiencies can be maximized. By understanding the specific cost drivers and potential savings, healthcare systems can implement strategies to optimize service delivery, streamline processes, and eliminate redundancies. This continuous improvement can lead to ongoing cost savings and resource optimization in the long-run. Therefore, it is imperative to investigate and quantify the potential cost savings associated with HIV/NCD integration. Such investigations will provide valuable insights for policy decisions, resource allocation, and the development of sustainable healthcare approaches in the face of changing funding dynamics. As such this study aimed to evaluate the cost savings associated with integrating HIV services with three common NCDs: diabetes (DM), hypertension (HTN), and the combination of diabetes and hypertension (DM/HTN) in Nakuru County.
2. Methodology
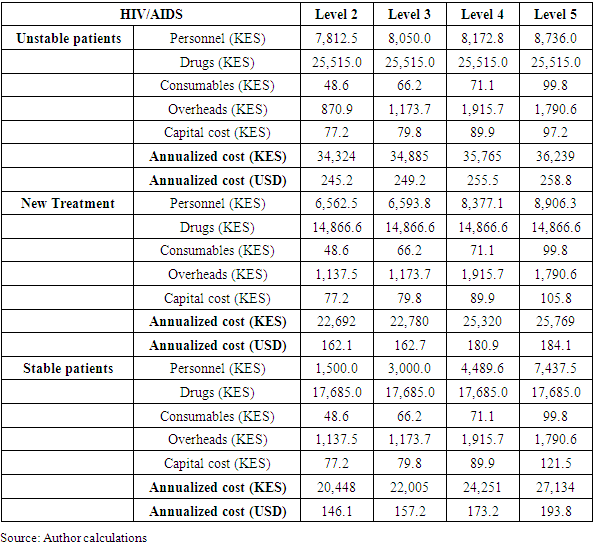
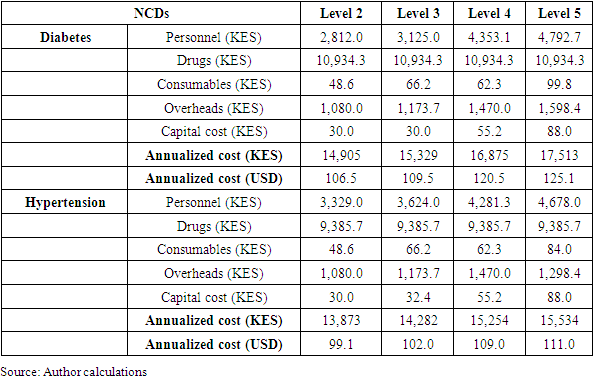
- Study areaThis study was conducted in 31 health facilities in Nakuru County in Kenya.Costing design The Time Driven Activity Based Costing (TDABC) approach was utilized [11,12]. TDABC is a methodology that assigns costs to inputs and services, primarily serving as a tool for planning and control. While direct labor and materials can be easily linked to specific products, allocating indirect costs to different key result areas poses a greater challenge. In cases where inputs are shared among multiple activities, a weighting system is necessary for cost allocation. The goal of this process is to allocate costs based on each intervention and activity to achieve predetermined goals or results. By identifying the factors that cause cost fluctuations (cost drivers), the TDABC approach traces and assigns all activity costs to the corresponding intervention or service. In this study, TDABC was applied to HIV and NCD services. Normative costs were employed, representing the costs expected to be incurred when approved standard clinical guidelines are followed for case management.This study also adopted a hybrid approach to costing that combined top-down and an ingredients approach. This approach is common and takes advantage of the strengths of each method while completing either methods weakness. The top-down approach was used to measure and allocate shared costs to specific services. These include health facility administration and overhead costs that include management and operations, staff salaries, electricity, water etc. The top-down approach used retrospective data of healthcare expenditures and divided total expenditure by the services provided in the given period. The study used an ingredients approach to measure direct costs to specific health services. These included costs of diagnostics, medicines, and other consumables etc. While an ingredients approach allows much greater disaggregation of the cost data and tends to be more accurate, it is more time-consuming.Estimation methodsThe TD-ABC methodology follows a seven-step approach as follows.Step 1: Select medical condition and/or patient population: ABC focused on all priority services.Step 2: Define the care delivery value chain: The care delivery value chain (CDVC) charts out the main activities involved in the patient’s full care visit. CDVC is both a descriptive and prescriptive tool that maps the full set of activities delivered over the care visit, spanning multiple providers and nonclinical settings, and offers providers a systematic approach to analyze, improve, and implement new configurations of care if needed. This is the starting point for producing a process map for each intervention. Use of patient treatment guidelines and expert opinions was used to provide a simple map of the CDVC for when and where health services are provided and what activities are performed at each stage of the CDVC and by whom.Step 3: Develop process maps of each activity in the patient care visit to identify the resources involved and any supplies used for the patient at each process: Process maps are developed for each activity in the care delivery value chain and consists of the path that a patient may follow to receive care (care visit). The process map included the resources (personnel, facilities, and equipment) involved in each process used by the patient or needed to make the primary resources available. This includes commodities and consumables such as drugs and pharmaceutical supplies used for direct service delivery. Step 4: Obtain time estimates for each process step: How much time a provider spends with a patient or how much time a piece of equipment or other resources are used for each process step. The data on time was sourced from the existing literature as well as experts’ opinion. Obtain workload/norms and standards estimates for each process step: Estimate how much investment / depreciation/workload a piece of equipment, Human Resources for Health (HRH) and other resources are used for each process step need to be measured by extracting data from the relevant sources and experts opinion where necessary Step 5: Estimate the cost of supplying patient care resources: The costs of all inputs used to provide the needed patient care was estimated. This included both direct and indirect costs. Direct costs include staff compensation, depreciation or leasing of equipment, and supplies. This data was collected from relevant sources. Indirect costs include support staff and other operating expenses needed to provide services. These include the costs of utilities, infrastructure, etc.Information on equipment, room dimensions, and administrative staffing required to estimate the full cost of providing the service. An equipment, furniture, and space data collection tool was used to gather data on equipment and general supplies.Step 6: Estimate the capacity of each resource; This consisted of estimating the capacity cost rate for personnel, equipment, and space. Data on the annual cost of each resource were obtained and divided by how often, in minutes, the resource could be used annually. This is the hypothetical cost if resources are used at their capacity.TDABC was used to capture costs for (a) care and treatment provided at the facility level, (b) diagnosis and treatment provided to HIV and NCD patients at the facility level, (c) routine outpatient services provided at the facility level. Overall, TDABC identifies and measures the following:Activities: Those that are performed over the care visit for a condition, who performs each activity, and how long they spend on each activity.People, furniture, equipment, and facility space: Cost per unit of time for each type of personnel, furniture, equipment, and facility space used during the care visit (capacity cost rate).Materials: Those that are consumed during the care visit (supplies/consumables, drugs, lab tests and reagents, test kits, etc.).On-site indirect cost: Additional costs incurred that are not directly consumed over the care visit. These are costs that do not directly contribute to individual patient care but are expended for service provision to be made possible, such as salaries of administrators, cleaners, security personnel, and utilities such as heating and electricity.Step 7: Calculate the unit cost per intervention: This final step consists of estimating the unit cost of each health service provided. A unit cost calculation was possible for every health intervention that has a process map developed. This is done by multiplying the capacity cost rates for each resource used in each patient process by the amount of time the patient spent with the resource (Step 4). Then, all the costs were summed up across all processes used during the patient’s complete visit to the facility for the estimated total costs of the patient visit.Costing DataData on costs was collected from various sources within the facility. Specifically, the cost data for the human resources required for HIV/NCD services was extracted from the Ministry of Health Staffing Norms and Standards, which are outlined in the Ministry of Health's guidelines for the health sector called "Human Resources for Health Norms and Standards Guidelines." To estimate costs for recurrent goods and services, we referred to expenditure records [13,14]. In order to validate the list of recurrent items and services, determine the quantity of units used, and allocate items across different functions and time periods, interviews were conducted with staff members. The costs of capital goods were discounted at a rate of 3% annually. Consultative meetings were also held to refine the activities and establish the implementation plan for each activity. The study made several major assumptions including:i. Facility indirect capacity cost rates (CCR) were determined based on the assumption that the duration of an average outpatient visit would be the same as an average disease area-specific facility visit.ii. The cost of most pharmaceutical and laboratory consumables, except for antiretroviral drugs (ARVs), was estimated using the 2021 sales price from the Kenya Medical Supplies Authority (KEMSA) as the reference unit price. The study assumed that the actual price of general clinical and administrative consumables, as well as laboratory test kits and consumables, would be similar to the KEMSA sales price.iii. The initial calculations of facility room CCR were based on the inventory of furniture and equipment collected. It was found that most rooms had a CCR of less than USD 0.01. The study assumed that all facility locations, except for laboratories and pharmacies, would have a CCR of USD 0.004 per minute. On-site pharmacies and laboratories in Level 4 and 5 facilities were assumed to have a CCR of USD 0.01 per minute. We assumed that all facility locations, except for labs and pharmacies, would have a CCR of USD 0.004 per minute. We assumed that on-site pharmacies and laboratories in Level 4 and 5 facilities would have a CCR of USD 0.01 per minute. These estimates are based on the study team’s observation that most rooms would need to have an annual cost of USD 650 to have a CCR above USD 0.005. This would require multiple equipment with replacement costs over one-thousand US dollars, which are more often observed in laboratories and pharmacies in referral or higher-level hospitals. iv. In estimating annualized cost per ART client, the study assumed an average of seven facility visits per year for a stable client and ten visits per year for an unstable client. These are the frequencies of visits indicated by the amount of ARV dispensed to the clients observed in our client shadowing process.An excel-based data tool was used to capture specific inputs needed for HIV/NCD services, including the data from past health system and facility assessments. All costs reported are in 2021 U.S. dollars. Data analysis was conducted using an Excel-based tool that had the provision for activity/sub-activity, costing assumptions, inputs specification, input price, frequency of occurrence, recurrence of the activity, and total cost of the activity.
3. Results
- The presented process maps offer a comprehensive outline of the essential stages encompassed in the delivery of HIV and NCD services, including the processes of identification, screening, ongoing care, and prevention. These maps serve to illustrate the sequential nature of care provision, the time allocation for each step during a care visit, the healthcare professionals involved, and the service location. By examining the process maps, it becomes evident that there are variations in the delivery of care both among different facilities and within the same facility. Additionally, the process maps shed light on the fact that providers' perceptions of the care process often deviate from the recommended clinical protocols outlined in Kenya's national guidelines. See figure 1.
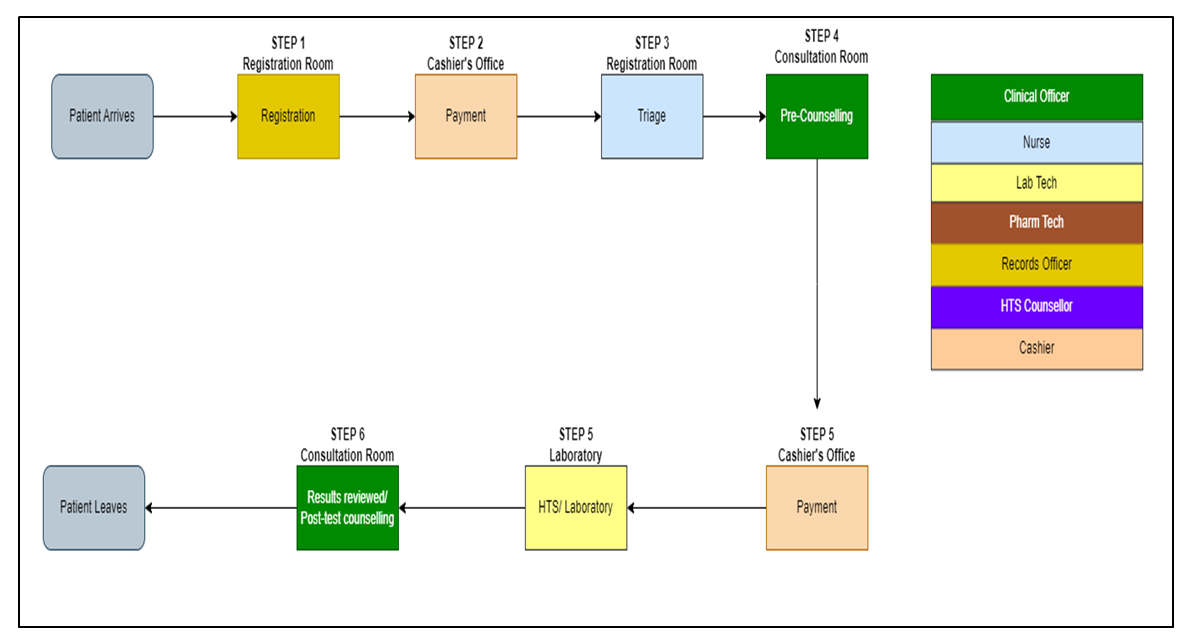 | Figure 1. Process Map of HIV Screening (Source: Author, 2023) |
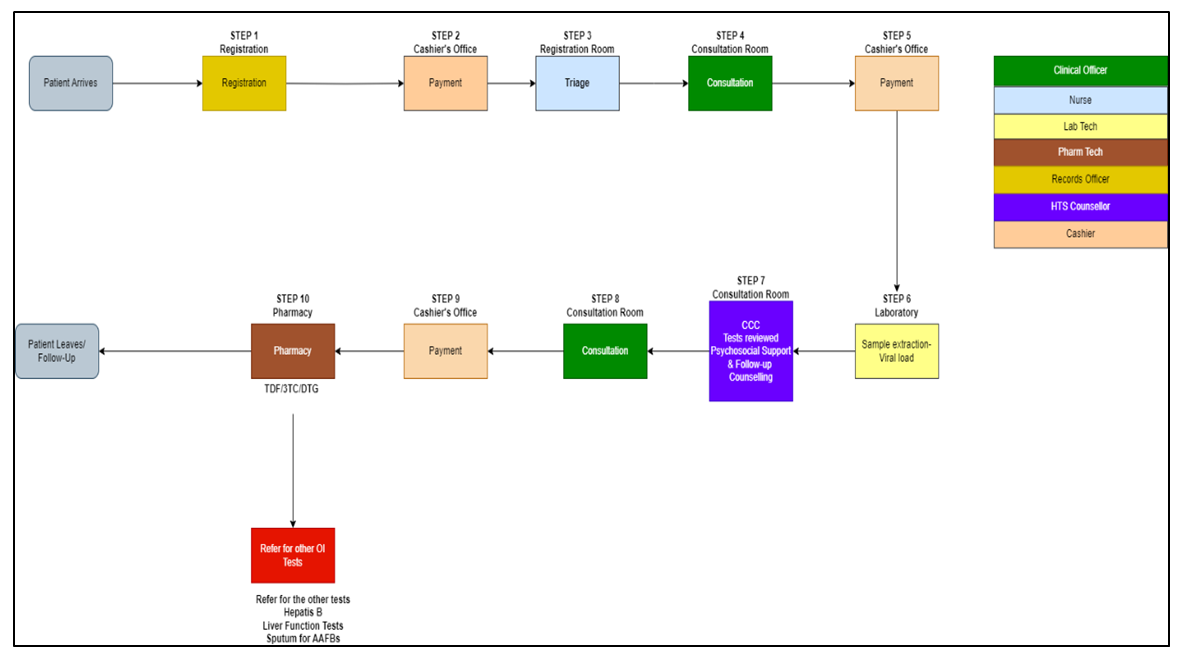 | Figure 2. Process Map of HIV Treatment for Stable Adult ART Client (Source: Author, 2023) |
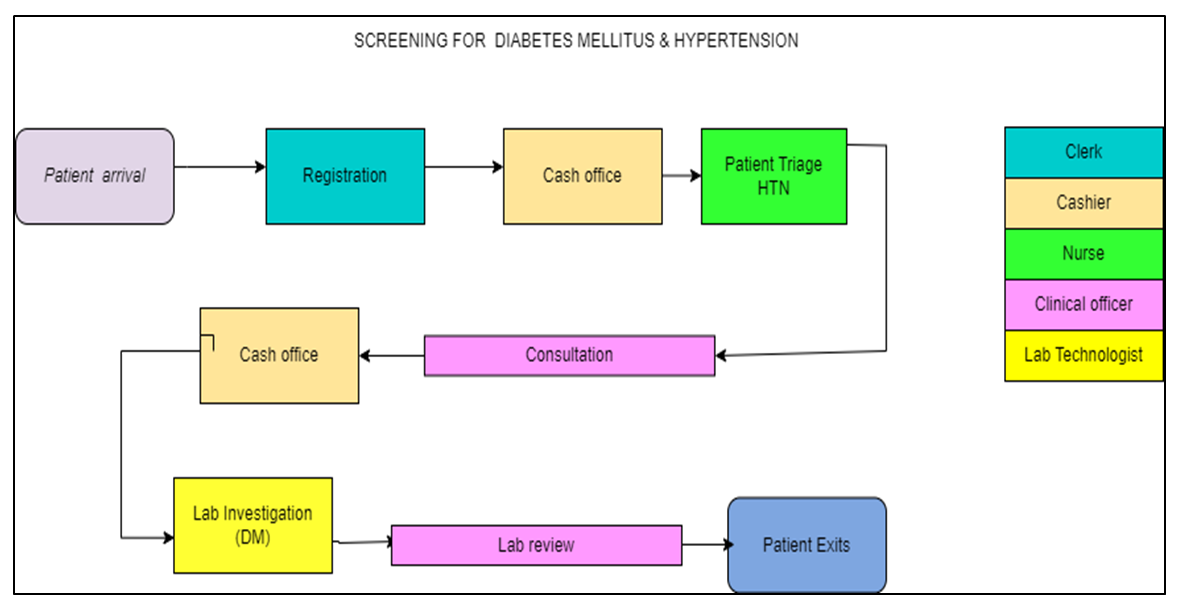 | Figure 3. Process Map of Diabetes and Hypertension Screening (Source: Author, 2023) |
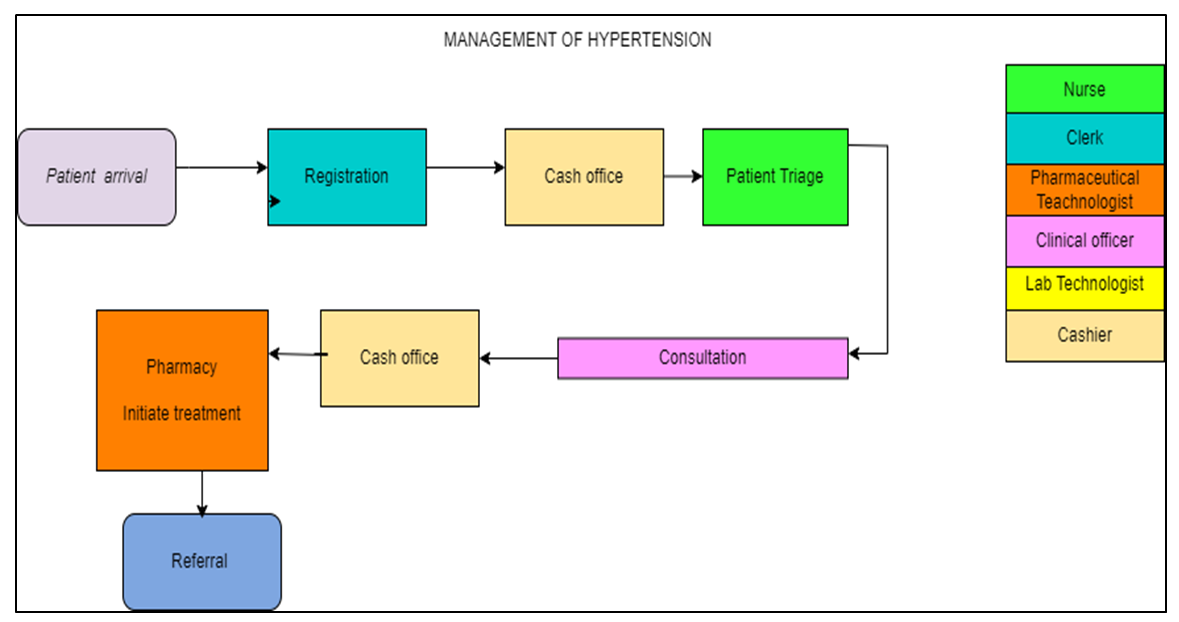 | Figure 4. Process Map of Hypertension (HTN) Management (Source: Author, 2023) |
|
|
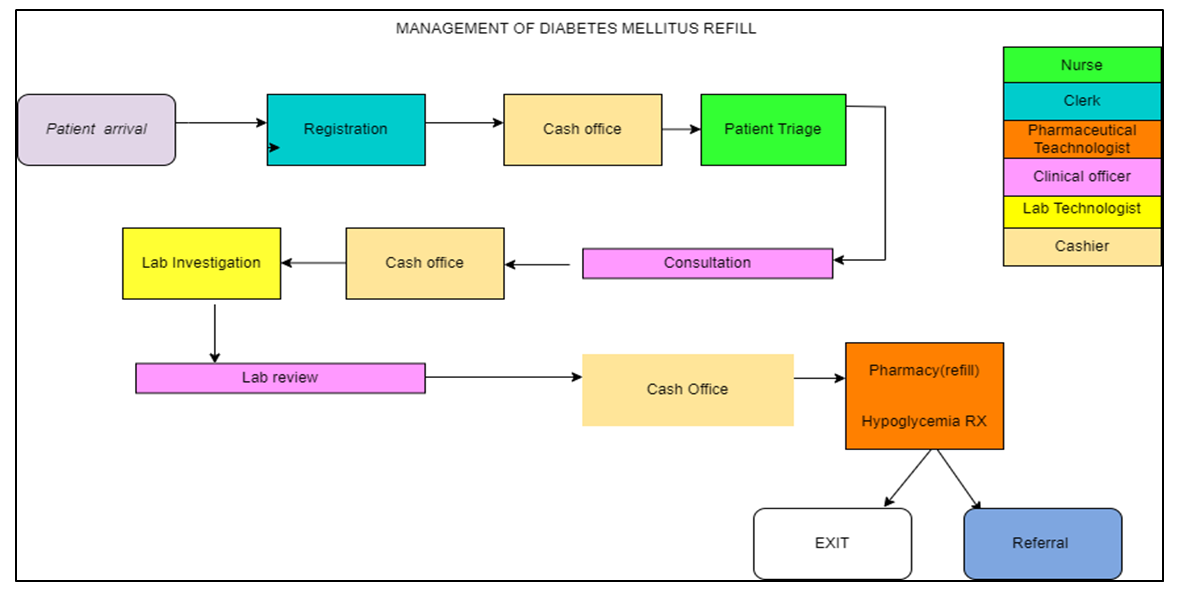 | Figure 5. Process Map of Diabetes Mellitus (DM) Management (Source: Author, 2023) |
|
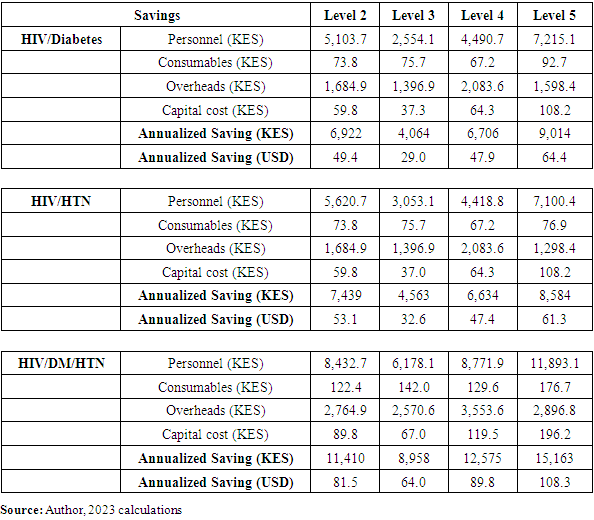
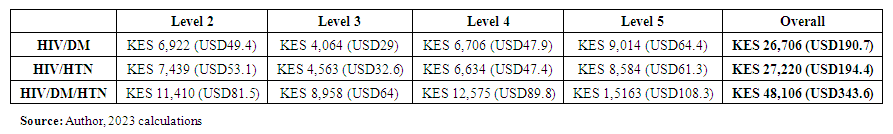 | Table 4. Summary Annual Average Saving per Unit Cost with Integration Approach |
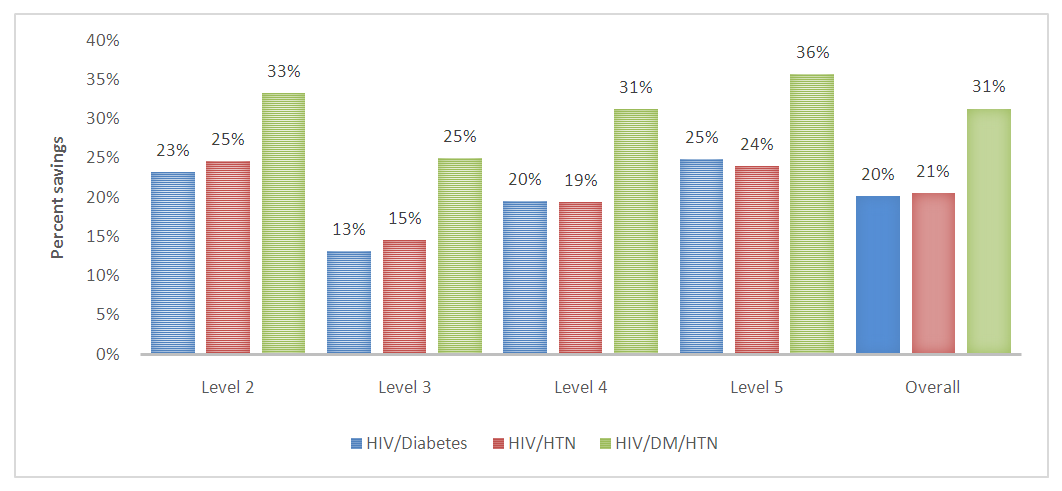 | Figure 6. Summary Annual Average Saving per Unit Cost with Integration Approach (Source: Author calculations) |
|
4. Discussion
- The study yields unique insights into HIV/NCD integration. The study findings presented highlight the significant cost savings achieved through the integration of HIV and non-communicable disease (NCD) services at different levels of care. The integration of HIV and NCD services has been demonstrated to generate cost savings across multiple levels of care. The cost savings per case, as shown in the findings, indicate that integrating these services can lead to efficient resource utilization and reduced healthcare expenditures. These finding aligns with that of Golovaty, Ilya, et al. who reported that HIV-NCD integration for the health system and patients increase efficiency of resource use and help patients remain in care by reducing costs and inconvenience for patients with multiple morbidities [15]. This cost-saving is crucial for healthcare systems aiming to provide high-quality care while managing limited resources and sustain services. Additionally, the cost savings are amplified with higher levels of integration. As the level of integration increases, the savings per case also increase. This can be attributed to the fact that higher-level facilities tend to have larger patient volumes and a broader catchment area [16]. This high patient flow allows them to benefit from economies of scale. They can negotiate better prices for medical supplies, drugs, and equipment due to increased purchasing power. This finding is consistent with that of Shiri, Tinevimbo, et al. who reported that HIV/NCD integration promote compliances, and may lead to increased economies-of-scale [17]. Additionally, a higher patient load enables efficient utilization of resources, such as expensive medical equipment or specialized staff, resulting in reduced per-patient costs. While level five facilities may generate more cost savings, it is important to note that the healthcare system requires a well-functioning network of different levels of care, including primary and secondary facilities. Each level plays a crucial role in delivering appropriate and cost-effective care based on the complexity and severity of patients' conditions. Effective referral systems and coordination among different levels of care are essential to ensure optimal healthcare outcomes and cost efficiency across the entire healthcare system.The integration of HIV and NCD services can promote a comprehensive and patient-centered approach to healthcare. An organization that embraces a team oriented organization culture have a higher likelihood of having a sustainable health services, enhancing continuous care even after the donors fully pull out.. This finding is consistent with that of Singh, Sabine, et al. who reported that Integrated services can save resources and allow for a more personalized approach to healthcare [18]. By addressing multiple conditions within a single service delivery model, patients receive more holistic care that considers their overall health. This integrated approach can lead to improved patient outcomes, better disease management, and reduced healthcare costs associated with treating complications arising from uncontrolled HIV or NCDs.Integrating HIV and NCD services streamlines healthcare delivery and optimizes resource allocation. The cost savings identified in the findings encompass various components such as personnel costs, consumables, overheads, and capital costs. Achwoka, Dunstan, et al. indicated that from the supply side, integration can reduce redundancies in resource limited settings. For example, leveraging existing infrastructure such as buildings, laboratory and supply chains can generate economic savings while joint supervision, training and mentorship has been shown to reduce demand on health workers’ time [19]. By eliminating redundancies and maximizing the use of available resources, healthcare systems can allocate saved resources to other areas of need, such as expanding access to care, investing in preventive measures, or enhancing healthcare infrastructure.The study was subject to one limitation, the assessment of the societal perspective was not included in this study, despite the potential savings that could be associated with patient transportation and patients' time. In conclusion, findings provide evidence to support the development and implementation of policies and programs that promote the integration of HIV and NCD services. Governments, healthcare organizations, and policymakers can use this information to advocate for integrated care models, incorporating them into national healthcare plans and guidelines. These policies can guide the allocation of resources and promote the sustainability of integrated services. Moreover, the integration of HIV and NCD services contributes to the overall strengthening of healthcare systems. Integrated care models require collaboration among different healthcare providers, disciplines, and sectors. This collaboration fosters a more coordinated and efficient healthcare system, ultimately benefiting the entire population, not just individuals living with HIV or NCDs. However, the successful implementation of integrated care will necessitate mobilization of additional funds to expand HIV treatment programs to include intensified screening and management of NCDs. Despite the growing prevalence of NCDs, the current funding allocated to NCD interventions are insufficient. It is also essential to consider the context in which these findings were obtained and adapt them accordingly to specific healthcare settings and populations. Additionally, ongoing monitoring and evaluation of integrated services are crucial to assess their long-term impact on patient outcomes, healthcare costs, and health system performance.
Declarations
- Ethical approval and consent to participate.Not applicable.
Conflict of Interest
- The authors declare no conflict of interest.