E. C. Merem1, Y. Twumasi2, J. Wesley1, D. Olagbegi1, M. Crisler1, C. Romorno1, M. Alsarari1, P. Isokpehi1, A. Hines3, G. Hirse3, G. S. Ochai4, E. Nwagboso5, S. Fageir6, S. Leggett7, J. Offiah1, S. Emeakpor8
1Department of Urban and Regional Planning, Jackson State University, 101 Capitol Center, Jackson, MS, USA
2Department of Urban Forestry and Natural Resources, Southern University, Baton Rouge, LA, USA
3Department of Public Policy and Administration, Jackson State University, 101 Capitol Center, Jackson, MS, USA
4African Development Bank, AfDB, 101 BP 1387 Avenue Joseph Anoma, Abidjan, AB, Ivory Coast
5Department of Political Science, Jackson State University, 1400 John R. Lynch Street, Jackson, MS, USA
6Department of Criminal Justice and Sociology, Jackson State University, 1400 John R. Lynch Street, Jackson, MS, USA
7Department of Behavioral and Environmental Health, Jackson State University, 350 Woodrow Wilson, Jackson, MS, USA
8Department of Environmental Science, Jackson State University, 1400 John R. Lynch Street, Jackson, MS, USA
Correspondence to: E. C. Merem, Department of Urban and Regional Planning, Jackson State University, 101 Capitol Center, Jackson, MS, USA.
| Email: |  |
Copyright © 2022 The Author(s). Published by Scientific & Academic Publishing.
This work is licensed under the Creative Commons Attribution International License (CC BY).
http://creativecommons.org/licenses/by/4.0/

Abstract
The outbreak of Covid-19 pandemic across the globe and the spillovers to Africa in the last several months triggered serious disruptions that grounded daily activities to a halt with serious threats to human life and the economy. This left serious implications in the natural resources sectors and the environment in many nations amidst countless mishaps involving the death of infected individuals. The pace of the diffusion over the short period around the world prompted immediate shutdown of economies in the face of substantial strain on the capacity of local health facilities to contain the spread. In the case of Africa, where most western observers were obsessed with predictions of an impending doom likely to overwhelm the continent’s fragile health sector already languishing in a perennial state of neglect. What seems overlooked stems from the effects of the pandemic on Africa’s environment and natural resources industry. Being a continent heavily reliant on revenues from the global export of resource commodities traded in the marketplace. The fiscal stress from the disruptions brought by C-19 pandemic for months grounded the activities in critical sectors like agriculture, mining, oil and gas and tourism germane to the economic survival of nations in diverse regions of Africa. Aside from the contraction in revenue generating potential in commodity trading and the low mortality level below the global average from the pandemic. The emergent fiscal shock remains evident in the continent’s largest economies and natural resource rich nations like Nigeria, South Africa, Angola, and the Democratic Republic of Congo. At the same time, the continent faces the threats of food insecurity in places previously saddled by drought. Compounding the matter is the deferral of proposed initiatives to upgrade petroleum infrastructure vital in yearly output. Aside the gravity, very little exists in current research on the situation. Thus, this enquiry will fill that void by analyzing the ongoing effect of C-19 pandemic on Africa’s environment using mix-scale techniques of GIS and descriptive statistics. Emphasis is on the issues, trends, factors, impacts, efforts, and future lines of action. Results from the analysis point to visible impacts across sectors with drops in the value of core natural resource indicators and the spreading of the pressures due to socio-economic, health, ecological and global factors. To deal with that, the paper proffered solutions ranging from the infusion of government stimulus packages, improved health facilities, the design of a comprehensive continental environmental health emergency info systems, the protection of natural habitats and conservation, digital monitoring of the natural resource sector activities and interactions with ecosystem and the introduction of an effective policy with immediate ban on the wildlife trade.
Keywords:
COVID-19 Pandemic, Natural Resources Sector, Africa, Regions, GIS, Impacts, Factors, Lockdowns
Cite this paper: E. C. Merem, Y. Twumasi, J. Wesley, D. Olagbegi, M. Crisler, C. Romorno, M. Alsarari, P. Isokpehi, A. Hines, G. Hirse, G. S. Ochai, E. Nwagboso, S. Fageir, S. Leggett, J. Offiah, S. Emeakpor, Examining the Effects of COVID-19 Pandemic on Africa’s Natural Resources Sector, Public Health Research, Vol. 12 No. 2, 2022, pp. 31-50. doi: 10.5923/j.phr.20221202.02.
1. Introduction
At the onset of the global outbreak of Covid -19 pandemic in late 2019. The continent of Africa known for its heavy dependence on natural resources exports saw major disruptions. This was prompted by the unwanted spill over into many sectors like agriculture, petroleum, tourism, mining, and others deemed critical to the economies in several nations [1]. Compounding the matter are the grounding of daily activities, economic downturn, and widespread uncertainties in the natural resource sectors of the nations in the continent given the limited demand for most commodities and the inherent price declines [2,3]. Since C-19’s diffusion pace globally resulted in the immediate shutdown of economies in the face of large strain on the capacity of local health facilities to contain the spread [4,5,6]. It is still worth saying that while the projected doom which many experts felt would overwhelm the capacity of Africa’s fragile health sector during the pandemic failed to materialize, pockets of the risks associated with the outbreaks clearly remained [7,8]. Looking at the spread of C-19 and the toll on communities, global growth, economies, and exposure of the continent’s natural resource sector to the fallout. There exists a sole focus on global pandemic readiness and the monetary losses inflicted on affluent economies. All these ignored the overstretched health systems, the deprivations, and over dependence of Africa on a very volatile commodity market linked to the growing C-19 uncertainties [9-15]. Accordingly, building on a premise geared at bolstering the health systems and the experiences from Africa’s previous responses to Ebola between 2014-2016. The continual observance of sustainable resources management principles in these settings given the projected drawbacks from current lock down, remains relevant despite the situation [16]. Seeing how the spill overs from C-19 pandemic devastated the economies of the different regions in the continent [17]. The World Bank projections, posits that the fiscal growth within the Sub-Saharan Africa (SSA) region dropped from 2.4% in 2019 to at least around -2.1% to -5.1% in 2020 [18,19]. While this hinged on the mitigation efforts to contain the impacts, the implications are that the SSA risked a major recession for the first time in over two decades [20]. Accordingly, the projected drops stem partly from the fiscal shocks triggered by the reduced earnings in resource dependent economies [21]. With the monetary jolts from the shocks reverberating visibly in South Africa, Nigeria, and Angola, Ghana, and the Democratic Republic of Congo. The other nations with heavy dependence on commodity export revenues with exposures experienced more challenges that coincided with the price collapse [22]. This occurred at levels which no one can ignore anymore given the threats posed to the economic mainstay of the nations. Considering that many nations from the Sahel to the Horn of Africa already suffer from perennial droughts and limited food shortages [23-25]. The situation became more compounded by the dreaded prospects of food insecurity in the agricultural sector [26]. Because of the threats of food insecurity [27], and the fact that, the burdens of pricey food items do not necessarily respect national boundaries [28]. The slow spread of this crisis into areas not known for it in the lower portions of west Africa like Ghana, Nigeria, and host of others, raised serious alarms among international organizations over the dangerous levels to which C-19 induced food scarcity was descending to in the absence of major actions [29-33]. As the situation unfolded further, the dire conditions of a block of smaller SSA natural resources rich economies (South Sudan, Sudan) and the major ones without special trade status accorded to other nations by China became a concern. From the heavy dependence of these SSA nations on Chinese exports. The limited commodity orders and deliberate dumping onto the Asian markets by their trade rivals in the Middle East, forced the SSA states into a corner with the dilemma of living on an indefinite economic life support [34]. In the same order, the crunch from the pandemic also disrupted physical development within the oil industry in a couple of nations. This includes several sidelined multibillion-dollar upgrades of petrochemical infrastructure essential for oil and gas production and global market competitiveness. While the nations affected extends from Nigeria to the Senegal-Mauritania Axis, Libya, and Angola. The shelved projects in these places and the inactivity from the lock downs, threatens community economic welfare [35]. With the greater metro areas of major cities (Lagos, Nairobi, Addis Ababa, Rabat and Guadeng) located in the West, East, North and South Africa the epicenters of the pandemic in Africa as of January of 2021 [36]. Africa’s natural resource sector continued to face the grim realities of C-19 pandemic in very serious ways with the once lucrative safari tourism on the verge of collapse from the lack of bookings from travellers grounded by the lockdown [37-39].This is so when one looks at the visual display in the plights of horticultural producers in Kenya discarding away global export bound floral products which nobody wants in the overseas distribution centers of the industry in Holland and Germany [40,41]. Aside from the practice of masked vendors on the streets in South Africa hawking their produce on trolleys and eager to earn a daily living in their search of customers amidst the lock down, the farm sector faces uphill battles [42,43]. In the case of Ghana, sadly, the lockdown by limiting movement, has negatively altered the accessibility of agricultural products and other farm services [44]. With most rural farmers unable to get into urban areas and mechanized farm equipment maintenance crews besieged by the problems of not getting the much-needed spare parts. These conditions in some ways discouraged marginal cultivators from engaging in the risks associated with the late planting of crops. Sadly enough, the chicken industry’s obsession with high demands and the assistance to survive, finds itself in a rather awkward battle. This involves an unusual position of fighting off the properly coordinated intense market competition from imported frozen poultry operators. As if such share of difficulties is not enough, in the same places, poultry feed remains pricey and hard to come buy as well in Ghana. This in turn compounded the situation for those involved in Ghana’s poultry sector during the lockdown [44]. Notwithstanding the gravity of the situation, very little has been done in current research to assess the situation in the continent among countries in the various regions under a mixscale model [45-49]. Accordingly, this enquiry will fill that void by analyzing the ongoing effects of C-19 pandemic on Africa’s environment using mix-scale techniques of Geographic Information Systems (GIS) and descriptive statistics [50-53]. Emphasis is on the issues, trends, factors, impacts, efforts, and future lines of action.The paper has five objectives and sections. Amongst the five sections in the paper, parts one to three contain the introduction, methods, and results along with the factors, impacts, and initiatives. Sections four and five offer highlights of the discussions and conclusions. Accordingly, the task of the first objective is to analyze natural resources potentials of Africa with GIS, while the second aim centers on identifying the threats posed by Covid 19 pandemic to the natural resource sector. Objectives three and four gauges the health risks, factors, and the future lines of action for turning the situation around. The fifth objective delves on the design of much needed mitigation tools essential for those charged with planning in the affected localities in the continent.
2. Methods and Materials
The study area of Africa (Figure 1) with a population of 1.3 billion people in March of 2020 and the 2nd largest continent covers 1/5 of the earth on a land area of 29,648,481 km2 [54]. It extends from the Atlantic in the West, the Mediterranean, on the North and Red Sea and Indian Ocean on the East and on the South by a mixing of the Atlantic and Indian Ocean. Endowed with the endless allure of diverse eco-zones and immense natural resources like gold, diamonds, copper, oil, and natural gas, farm products, and flowers. The lower and central parts are mega diversity states. In the zone, the tropical rainforest extends from the South to West Africa, as the Serengeti area includes parts of Tanzania and Kenya followed by the Desert ecosystems of North Africa [55-57].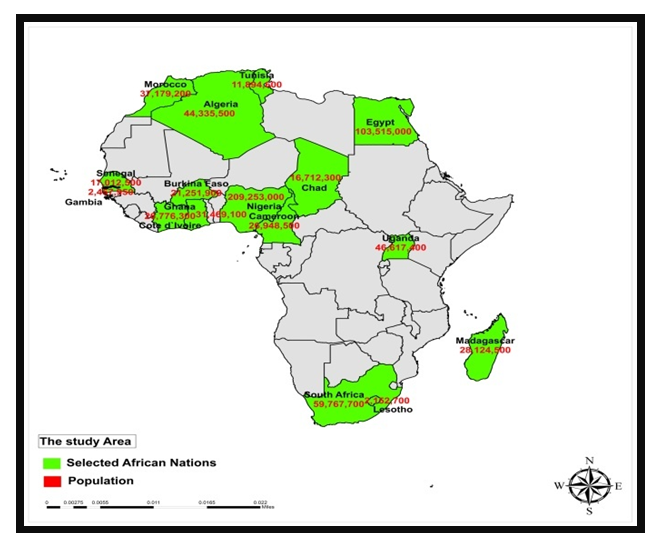 | Figure 1. The Study Area Africa |
Despite these amazing and enviable attractions along the complex ecologies of the regions [58], the rapid spread of C-19 pandemic across the globe forced African nations to gradually rethink and device containment mechanisms. This required adjustments with broad sectorial implications in the management of natural resources in the continent during the critical periods of the outbreak [59]. Consequently, Africa documented its first COVID-19 incident in Egypt during 14 February in 2020 [60]. From there on, about 52 nations have seen the emergence of more cases. Originally limited to the big-time capital areas, more cases are springing up in large quantity within several countries, and a variety of regions and provincial zones. As at the period of May 4 in 2020, the sum of proven COVID-19 incidents rose to 44,873 with 1,807 in fatalities. During the opening waves, the African nations accounting for the largest cases of infections consists of South Africa, Egypt, Morocco, and Algeria [61]. Nevertheless, the complete scale of the epidemic stayed unclear, with the numbers underreported and the substantial variability in the procurement of data a constraint [62]. In the process, the C-19’s pandemic aggressive fiscal footprint in the sector is impacting Africa’s natural resource output and earnings in various sectors from farming to ecotourism [63].In the face of such constraints, in places in West Africa including Ghana, the threats posed by lockdown within cities remains glaringly felt through the enforcement of public measures, seeing the way the impediment threatens the movements of food supply chain actors who bore the pains most directly. The previously fragile countryside-city food network was so adversely affected that it forced a small number of wholesalers into farming areas to purchase items. The severe declines, coupled with the presence of new food traders in local markets and the choice of several officials to shut down eateries, resorts, and more local restaurants vastly diminished the mass acquisition of fresh food items [44]. As a result, many female farmers halted the shipment of fresh items via small villages owing to concerns over the slow level of market activities in the purchase of fresh products due to lockdown measures. Whilst the people at the margin languished indoors on the orders of imposed safety measures. This impacted revenue generation and their purchasing capacity [44]. Due to the inadequacies emanating from the food allocation groups, costs increase slowly crept in. Accordingly, most citizens became discouraged from acquiring fresh produces [64]. Aside from Europe, where authorities saw little connection between COVID-19 and food. In the global south states like Nigeria, where over 200 million people heavily depend on their daily grocery supplies as part of the necessary food security chain important to the communities. The frequency of individual interactions involved, and the ecological settings were fuelling the transmission of the epidemic. In some cases, the transmission risks were traced to food producers and the processors. As a result, the biggest market in Lagos was shutdown indefinitely amidst the convoluted nature of social distancing in those settings [65]. In such a place, the ripples of the closures transcend neighbouring states and nations in several ways.
2.1. Methods Used
The paper uses a mix scale approach of descriptive statistics and secondary data connected to GIS. The spatial information for the research was obtained from various sources including the University of Maryland Online Data services, the African Development Bank, (ADB), United Nations Economic Commission for Africa (ECA) and the US Geological Survey (USGS) Mineral Resource System Online Spatial Data, The United Nations Food and Agricultural Organization (FAO), The UNFAO online statistical platform (FAOSTAT), The East African Community, the Southern African Development Community and The Economic Community of West African States (ECOWAS). Other sources consist of The USGS World Mineral yearbook international mineral, statistics, information, and databases. This was essential in the provision of solid mineral time series data for the periods of 2015-2021. Added to that are The International Monetary Fund (IMF), UN Conference on Trade and Development, Deutche bank, Mckinsey Quarterly, the World Nuclear Association and US Global investors and World Resources Institute. These groups of sources helped furnish the spatial info highlighting some of the strategic minerals shares from gold to copper and diamond. Elsewhere, the organization of petroleum exporting countries and the national petroleum firms furnished the needed oil and gas data as well. Given that some of these entities supplied the solid mineral time series data and economic geology index for the periods of 2015-2021. The array of demographic and C-19 health related information came through the UN High Commission for Refugees, the World Health Organization, The Africa Centre for Disease Control and Prevention (Africa CDC), Nigeria’s Coalition Against COVID-19 and The Johns Hopkins University. Aside from the group of agricultural and economic data from The United Nations Development Program, the World Food Programme (WFP), the African Union, UNFAO, the European Union, Nigeria’s Ministry of Agriculture and Rural Development, The Southern and Eastern African grain growers’ association, and The Kenya Flower Council. The World Trade Organization, the IMF, the World Bank, the Brookings Institution, the United Nations University Ghana and the Organization of Economic Cooperation and Development, (OECD) and the central banks ushered in the critical fiscal information. The geographic identifier codes for nations, cities and regions were used to geo-code the information contained in the data sets. This information was analysed with basic descriptive statistics, and GIS, with particular attention paid to the temporal-spatial trends at the national, regional, and state boundary levels. The relevant procedures consist of two stages.
2.2. Stage 1: Identification of Variables, Data Gathering and Study Design
The first stage involves the identification of non-fuel and fuel solid minerals, agricultural and health and demographic indices; land use and land cover elements and economic variables needed to assess the impacts of the losses encountered during the C-19 pandemic lockdown in places where natural resources assets abundance flourishes in the major producing zones of the continent. While these operations thrive through export, investments, tourism, consumption, distribution, and exchange. The solid mineral variables consist of non-renewables like precious metals, and rare earth minerals such as copper, diamond and gold followed by other types in the form of crude oil and natural gas. The actual listings of metals related variables ranges from world diamond production ranking, gold export, rankings and weight, copper exports, dollar value ($), mineral production, and African major gold exporters as percentage of GDP. Added to that, are petroleum energy indicators, rankings, capacity, oil production volume, budgeted oil price and fiscal position of oil-abundant countries, expenditure budgeted, oil related expenditure loss % of GDP, and Oil GDP % total. In the same vein, the socio-economic indices cover, dollar value in global shipments, total exports, % total, % change in export, commodity exports of Sub-Saharan African nations (% of GDP), international tourism receipts (% of total exports), contribution of tourism (% of GDP), population and growth rates. Additional data types consist of health variables pertaining to total fatality case rate, tests per 1000 of the population, the cumulative deaths per 100,000 NB, the cumulative incidence/100k NB, as well as pharmaceutical exports. There were also agroecological data on the volume of cocoa production, flower bouquet exports $value (US$), the number of flower farms, the number of people employed in the flower industry, the total volume of produced flowers and the number of safari operators. Given that the official boundary lines between the nations remained the same, a common geographic identifier code was assigned to each of the area units for analytical coherency.
2.3. Stage 2: Step 2: Data Analysis and GIS Mapping
In the second stage, descriptive statistics and spatial analysis were employed to transform the original socio-economic, land-use, and energy data into relative measures (percentages/ratios). This process generated the parameters for establishing the scale of Africa’s exposure and vulnerability to the escalation of numerus shock waves that unfolded. It is vital when looking at how the gravity of C-19 pandemic lockdown impacted the annual earnings of natural resource segments of the economies. This was the case seeing the scope of production slowdown in the absence of accessible markets and falling prices. With all these manifested via declining trades and investments, export, and import activities together with the deferred upgrades of sectorial amenities and the weak trade forecasts. The limited demands for natural resources, the actual menace of C-19 outbreak in key metro areas and the poor state of clean water access in places rattled by the pandemic and the blow suffered in the safari dominated tourism industry said it all. This was facilitated by measurements and comparisons of the trends over time. While this approach allows for change detection, the tables highlight stressors, indicators of declines in export and import, mineral and renewable resource consumption involving mining, petroleum and natural gas, agriculture as well as the demands and supply and the corresponding volumes of monetary investments in the natural resources sector. The remaining steps involve spatial analysis and output (maps-tables-text) covering the study periods, using Arc GIS 10.4 and SPSS 20.0. The spatial units of analysis consist of natural resources rich areas, and strategic minerals endowed sites across the continent, regions and nations from the North, West to East and the Southern tip of Africa. The geographic data for Africa, which covered national boundaries and regions, also includes ecological data of land cover files involving forests and farm spaces known for cocoa production, flower or horticultural activities and mineral and commodity production. The info also highlights mining activities from gold to copper and diamond along with paper, and digital maps from 2015-2021. The outputs of the spatial data were mapped and compared to see the dispersion of oil and gas production, socio-economic and physical and demographic and health indicators fuelling the uptick in C-19 pandemic spill overs. The step also covers the reasons for the declines in projected natural resource revenues, investments and economic downturn and the environmental health impacts tied to the tumble and shocks experienced in the natural resources sector of the nations in the various regions of Africa. With very slight knowledge of the gravity in the accumulated impacts of the C-19 pandemic lockdown. The GIS analysis provides a tool for better understanding of the spatial patterns of the risks posed to natural resources sectors. This is essential, given the shock waves directed at and endured by the fragile commodity resource dependent economies operating across the various regions in the continent of Africa.
3. The Results
This part of the research focusses on temporal and spatial analysis of the Covid 19 trends in the study area. Using descriptive statistics there is a prime focus on the analysis of natural resources production and earnings in the nations, the fiscal shocks, mineral resources output at the regional and state scales. The other components, cover the situation in nature tourism built on safari, and the agricultural sector made up of cocoa, and the flower exports renewable inventory and a comparative assessment. This is followed by the remaining parts of the section on environmental health analysis, the impacts on oil and gas projects, GIS mappings, and the acknowledgement of the factors associated with the C-19 shutdowns and the efforts across Africa and the various global agencies involved in disaster mitigation.
3.1. Natural Resources Production, Earnings
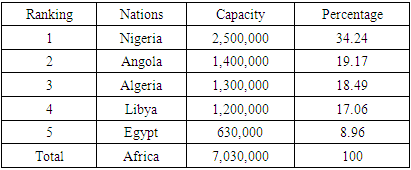
With abundant resources all over the continent, production not only surged, but note that the continent’s capacities in oil, minerals and agriculture stood firm in many nations before the disruptions. In the case of oil, given its essence in the African continent’s natural resource profile, and with majority of the nations, members of the OPEC block. The temporal display of the sectoral activities involves the operations in the top 5 nations based on the volume produced per day between 2015-2019. Out of the total of 7,030,000 million barrels per day (M/lbd), the nation of Nigeria at the number 1 spot accounted for 2,500,000 M/bld at a rate of 34.24% and a level far ahead of the others. With Angola as the 2nd largest source of oil responsible for 1,400,000 M/lbd worth 19.17% of the overall in the continent. The output levels of 1,300,000-1,200,000 M/lbd for the North African nations of Algeria and Libya ranked 3 and 4, reached 18.49%-17.06% between 2015 to 2019. The ancient state of Egypt as a non-OPEC member in the continental ranking of number 5, produced just 630,000 M/lbd which represents 8.96% in the total output among the producers. With ample resources all over the continent, production not only surged in 2010-2012, the continent’s capacities in oil, minerals and agriculture stood firm in many nations before the disruptions, as Nigeria accounted for 2.5M/bld and 34.24% of the 7.3 (M/lbd) in daily oil output from 2015-2019 in Africa (Table 1). Table 1. Top 5 Oil Producing Nations in Africa (/bld), 2015/2019
 |
| |
|
3.1.1. Fiscal Shock from Projected Oil and Gas Revenues
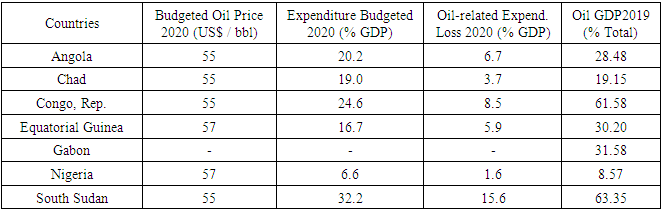
With the linkages between heavy dependence on oil and gas revenues and commodity price collapse amongst Africa’s resource rich nations, during COVID-19 pandemic outbreak, in 2020 apparent. Over that period, many nations in the dependency category from Angola to South Sudan mostly in the Sub-Saharan axis of Africa became deeply exposed to market volatility. Since the budgeted oil expenditures and fiscal profiles remains heavily tied to gas prices in these places. Looking at the key fiscal indicators made up of oil price, expenditures budgeted as percent of the GDP, the losses, and the proportion of oil in the GDP in 2019. Aside from the budgeted oil price values at an average of $55.66 per barrel in which neighboring nations of Equatorial Guinea and Nigeria projected $57 per barrel. The distribution of the budgeted expenditure for oil during in 2020 in the SSA nations shows greater exposure for the initial trio of states, most notably South Sudan, Congo Republic, and Angola. In these nations, expenditure rates ranged from 32.2, 24.6- 20.2% together with similar values of 19.0% and 16.7% for Chad and Equatorial Guinea. This is different when compared to Nigeria’s 6.6% as a proportion of the GDP during the same period. From there, similar patterns emerged in the oil related expense losses, as South Sudan, Congo Republic, and Angola at 15.6%, 8.5 -6.7% in the reported drops, outpaced Chad and Equatorial Guinea and Nigeria where the declines stayed in the order of 3.7, 5.9 to 1.6% respectively. Seeing that oil as percent of GDP total in 2019, revealed areas like South Sudan and Congo Republic where the index in the upper double-digit values exceeds 60% (63.35-61.58). The percent of oil in the GDP for the nations of Equatorial Guinea, Gabon and Angola and Chad estimated at 28.48%- 31.58% and 19.15% remains significantly high as well, despite Nigeria’s oil GDP ratio of 8.57% during the 2019 fiscal year. Along these lines, the budgeted expenditure for oil which did not materialize in 2020 in the SSA region shows visible exposures for the initial trio of states. This includes South Sudan, Congo Republic, and Angola with high expenditure rates (32.2, 24.6 - 20.2%) along with similar values (19.0% and 16.7%) for Chad and Equatorial Guinea compared to Nigeria’s 6.6% as a ratio of the GDP (Table 2).Table 2. Budgeted Oil Price and Fiscal Position of Oil-Abundant Countries in Sub-Saharan Africa
 |
| |
|
3.1.2. Mineral Resources Production and Exports
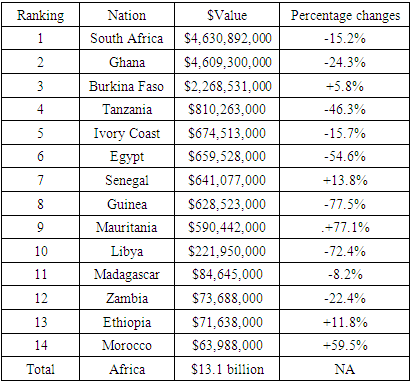
In the context of Africa’s mineral resource trade by nations based on the exports of gold, diamond, and copper during 2016-2019. It is evident that the continent has vast abundance considering the scale of activities and the frequency of appearance in the listing among some of the nation’s especially the Republic of South Africa. Turning to the order of activities in 2018/2019 in gold export. From a total sum of $13.1 billion dollars in which South Africa, Ghana and Burkina Faso raked in over $4.6-$2.2 billion dollars. The East African state of Tanzania in the 4th spot stepped up export with the generation of at least $810,263,000 in 2019 as Ivory Coast, Egypt, Senegal, and Guinea averaged more than 650,000000 million in gold exports. At that rate, the nearby state of Mauritania wasted no time in hitting the half a billion mark plus of $590,442,000 as Libya followed up with $221,950,000 million dollars’ worth of export items. In the same vein, the team of other gold producers including Madagascar, Zambia, Ethiopia, and Morocco ranked 11-14 in the listing, posted export values in the tens of million dollars totaling more than $200 million at an average of $73,489,750 million dollars (Table 3).Table 3. List of Africa’s Gold Exporting Countries In 2018/2019
 |
| |
|
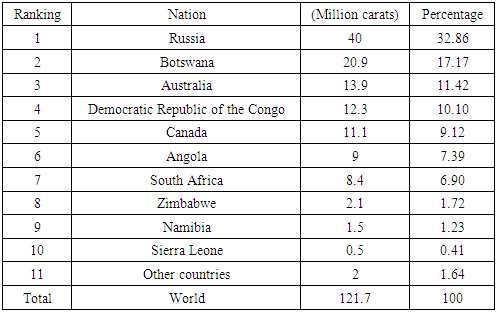
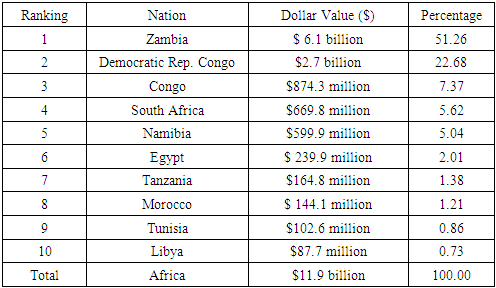
Of the top 10 diamond producers in a 121.7 million carats market in which Africa accounts for 7 of them. African producers from Botswana to Sierra Leone held 54.7 million karats at a rate of 46.83 44.92% of all the transactions globally (Table 4). The value of copper export out of Africa in 2018 also affirms the dominance of the copper belt power houses of Zambia and the Democratic Republic of Congo in the ranking. The duo in accumulating $6.1-$2.7 billion dollars, combined for 73.94% of the overall transactions in the continent. Closely placed in that category are Congo, South Africa, and Namibia with export values of $874.3 million to $669.8 million to $599.9 million representing 7.37%-5.62% and 5.04%. Egypt’s lone presence at number 6 in the ranking worth about $239.9 million and 2.01% seems within the reach of the other producers. This includes the nations of Tanzania, Morocco and Tunisia with export deals estimated in the hundreds of millions at a combined level of $411 million plus at an average of $137 million. The 10th ranked producer Libya out of North Africa, finished at $87.7 million and 0.73% of the volume of copper exports from the African continent (Table 5). Thus, the outlook for mineral export in 2016-2019 involving gold, diamond, and copper shows the prominence of South Africa, Ghana and Burkina Faso, Botswana, Sierra Leone, Zambia, and the DRC. Notwithstanding the huge dependence on these items in the respective nations as they often do. Such beliefs did not translate into fiscal surpluses considering the shocks from C-19.Table 4. World Diamond Production (million carats) in 2016
 |
| |
|
Table 5. Africa’s Copper Exports, 2018
 |
| |
|
3.1.3. Agricultural Production Cocoa and Flower Production
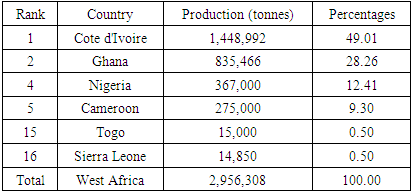
Being a major cocoa hub in the equator amongst nations of diverse ecosystems coupled with the increasing pace of cocoa farm operations, as evidenced in the continent of Asia and Central and South America. Significant amount of the world’s cocoa supply comes from the adjoining states of Ivory Coast and Ghana alone in West Africa. Since collectively, the two countries produce over 60 percent of the world’s annual requirements of the beans. Certainly, cocoa thrives exclusively and mostly along equatorial environments where the crop in the region depends on elevated temperatures. In the zone, cocoa also relies on rainwater to flourish, alongside the rainforest vegetation for ushering cover and shield from intense sunlight and destruction triggered by storms. In the actual global ranking of the 20 major cocoa producing nations, the West African region held the top 5 spots coupled with the 15th and 16th positions. The nations of Ivory coast and Ghana emerged as the first two with 1,448,992 to 835,466 tonnes while Nigeria and Cameroun remained at the 4 and 5 with 367,000-275,000 tonnes in cocoa production. Following them are neighboring Togo and Sierra Leone in the 15th and 16th positions, and responsible for 15,000 to 14,850 tones in world production (Table 6).Table 6. Top Cocoa Producing Countries In The World
 |
| |
|
Another dimension to the natural resources’ potentials of Africa involves the scope of the continent’s horticultural trade known for its prominence in the global export of flowers. Even if this came to a halt at the onset of C-19 pandemic. The overwhelming dominance of the East African region in the export of flowers is manifested by the 2019 export info. While this shows Kenya and Ethiopia as the 4th and 5th in the global rankings coupled with South Africa and Uganda in the 15th and 25th spots among the four leading nations. Going by the breakdown of floral exports in the fiscal year 2019, Kenya and Ethiopia took in serval hundreds of millions at about $709,402,000 to $241,270,000, whereas South Africa’s and Ugandan floral trade transactions mostly in the high and mid tens of million dollars amounted to $55,765,000-$24,335,000 million for the Sub-Saharan African states. To further buttress the growing capacity in floral trade in Africa, see the percentage gains of 23.4% -1.1% for Kenya and Ethiopia together with 2.8%-688.8% also for South Africa and Uganda, with the later experiencing the highest rally in flower exports in 2019. However, based on the fiscal shocks from the C-19 pandemic, both cocoa and flower exports out of Africa suffered massive setbacks amidst the ripple effects of global lock downs in the markets.
3.1.4. Safari and Nature Tourism
For years, embarking on an African safari trip has always been seen as a long-lasting experience for many people from all over the globe. This starts through individual travel agencies who book hundreds of thousands to millions of travelers eager to make the trips. With the Serengeti reserves in Tanzania known to have the largest concentrations of big animals in the planet. These attractions offer visitors the best captivating treats with guaranteed relaxations and entertaining atmosphere in some of the most luxurious resorts and hotels. Thus, having seen the way C-19 lockdown measures grounded international flights throughout the globe and the vulnerability of Africa’s tourism sector to those actions. The place of various facets of tourism and their role as the lifeline of many economies in the African continent in the period of C-19 pandemic is quite telling and should not be underestimated. With the tourism destinations mostly coastal and inland nations spread across many countries. The value of international tourism receipts as a percentage of the exports and the total contribution of tourism to the percent of the GDP merits some analysis. Of the top 5 nations (Cape Verde, Gambia, Ethiopia, Mauritius, and Seychelles) that dominate the international tourism proceeds as percent of their exports. The Cape Verde Island and Gambia in West Africa and Ethiopia along the Northeast Africa zone led by 54%, 48% and 46%, followed by the other duo of Island nations of Mauritius and Seychelles at 35%-38% (Figure 2). The other biodiversity hotspots like the Nile Basin nations of Tanzania, Rwanda, and Tanzania with Safari abundance in the areas of ecotourism, maintained sizable ratios of exports of 29, 27, to 20 in global tourism receipts. The remaining quintet of international sites (Madagascar, Uganda, Togo, Kenya, and Senegal) not only saw the percent of exports of 19 to 8, but most of the countries involved had identical receipts of 19, 18 and 17% in the respective percentages of their tourism exports (Figure 2).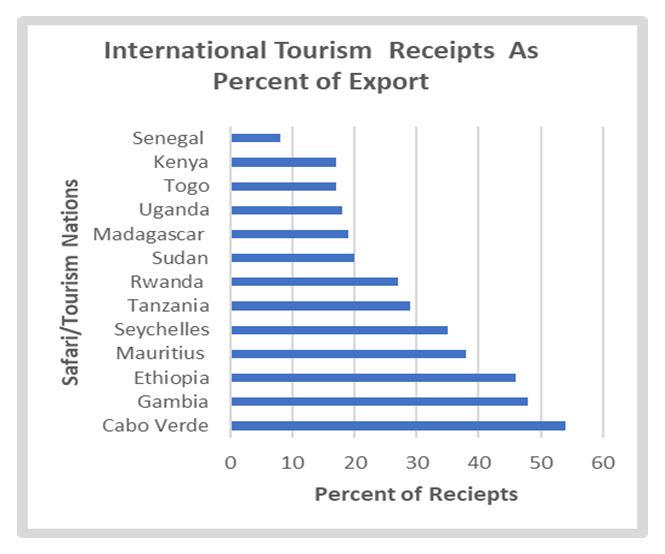 | Figure 2. International Tourism Receipts As Percent of Export |
In the case of the total contribution of tourism to the percent of the nations GDP, the Island states of Seychelles and Cape Verde as the top destinations hauled in more revenues representing 62 to 42 of their respective national incomes as the group of other 4 other nations made up of Mauritius, Gambia, Sao Tome and Principe and Namibia averaged 21.25% as well. From there on, six other nations (Lesotho, Madagascar, Senegal, Tanzania, Botswana, and Zimbabwe) listed in the mix also posted an 11% average as the total contribution of tourism. The six nations as manifested in the graphic, covers the mega safari destinations dominated by Kenya, South Africa, Uganda, Ethiopia and as well as the Comoro Island. The total values of tourism to the GDP of these places even though miniscule at 9% relative to the size of some of the nations involved. They are still relevant in the economies, and capable of rattling these nations in the absence of patronage driven by the C-19 lockdown (Figure 3). Surely, the economy and nature tourism in these nations suffered massive damages that may take years to stabilize.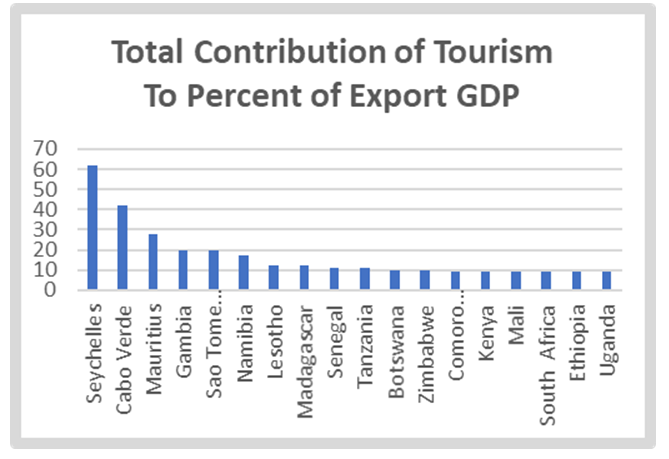 | Figure 3. Total Contribution of Tourism To Percent of Export GDP |
3.2. Environmental Health Analysis
From the surge in the outbreak of C-19 pandemic all over the nations and the regions in the study area. The continent of Africa saw an initial wave of casualties rooted in a mix of deaths and infections. While many feared over time that this could overwhelm the capacity of health sectors in the nations. It also opened debates over the viability of health infrastructure in the affected states to deal with the fallout from the lockdown. This happened in places where many citizens still lacked access to clean water and better sanitation. This part of the study covers the chronology of the disease outbreak, the water issues, and the health care situation together with the actual implications in the African continent.
3.2.1. Outbreak of C-19 Pandemic Among the Nations
The dangers of Covid -19 pandemic in Africa since the outbreak in 2019 till the third week of January 2021 reached about 3,388,139 cases and 83,862 fatalities. Of the at-risk nations in the continent in the first two weeks of 2021. The group of 4 nations; South Africa, Tunisia, Zambia, and Morocco dominates with 31,356 confirmed cases. At the individual country level, South Africa and Tunisia reported 21,980-4,170 at 70.09-13.29% (84%) of these incidents. This outpaces the figures for Nigeria, Zambia, and Morocco estimated at 1,867, 1,796 and 1,543 and 16.59% of almost the confirmed cases. At the major regional centers of the continent with most of the confirmed C-19 incidents. In early 2021, of the 697,847 cases, the region of Gauteng in South Africa had 361,881-180,204 of the exposures. This is equivalent to 77.67% of the risks in developing the ailment. Of these numbers, Gauteng, and Casa Settat individually accounted for 51.85% and 25.82% of these exposures. In the other regions mostly in East Africa, both the Addis Ababa-Nairobi axis with 74,056 to 41,983 of the incidents since the onset of the new year combined for 16.62% at 10.61to 6.01% ratios correspondingly. Further to the West coast of the continent, the Lagos region saw 39,723 of the cases at the equivalent rate of 5.69%. (Figure 4).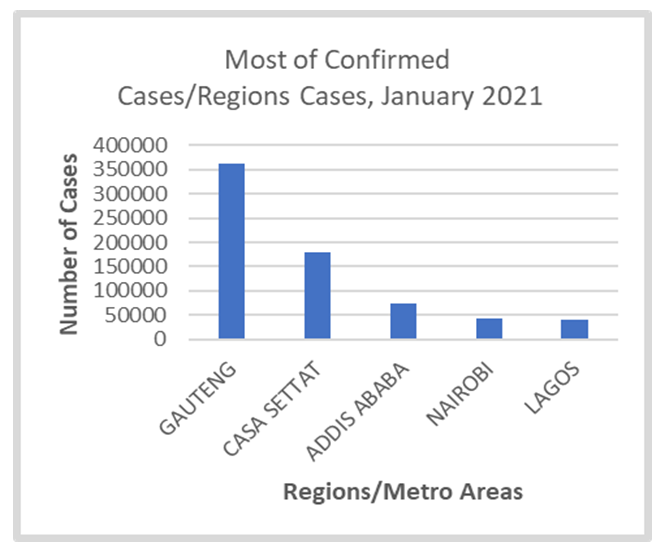 | Figure 4. Most of Confirmed Cases |
From the graphic display in place for the continent, the fatality case rate in the new year seems flattened in 17 nations. This started from Mauritius to Burundi but tipping up towards another group of 22 states, with the nations of Saharawi ADR, Egypt, Tanzania, and Chad reporting 15.38%, 7.08, 5.52%-4.13% to 3.7-3.24% of the incidents. The other places from Gambia, Zimbabwe, DRC, South Africa, Algeria to Angola labelled as heavily hit areas saw their rates move from 3.24 to 2.35. From the nations of Mauritius to Burundi, the case fatality rates stood at 1.8-0.14% (Figure 5).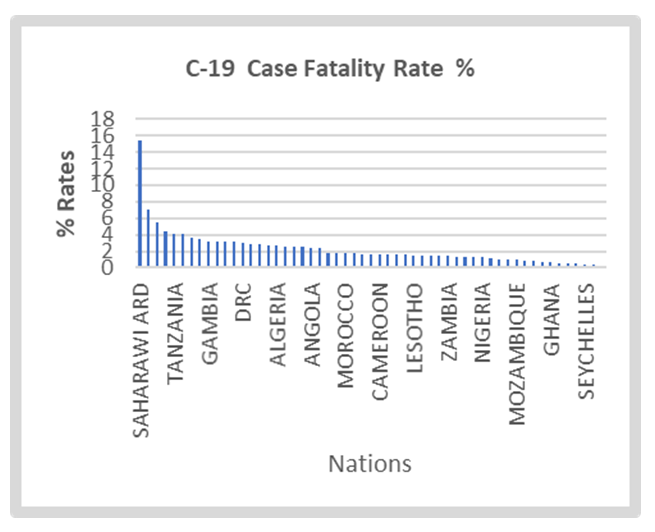 | Figure 5. The C-19 Case of Fatality Rate |
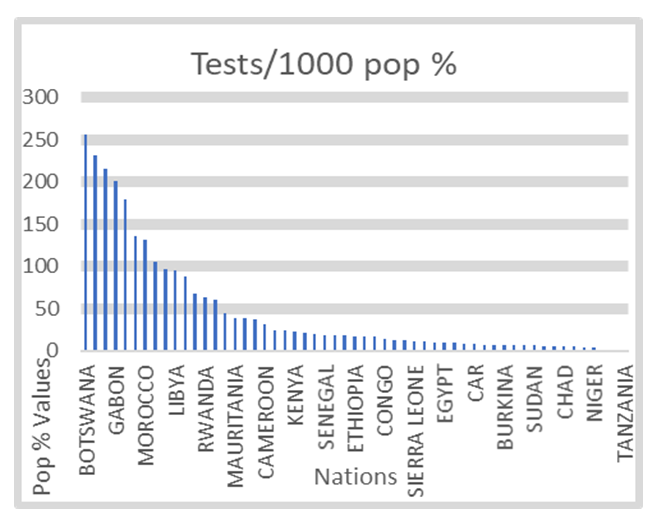
Consequently, the cumulative incidence at /100k NB puts the cases in South Africa as the highest at 2396 followed by the nations of Cape Verde, Libya, Tunisia, Morocco, Namibia, and Eswatini, where the case occurrences reached significant levels of 2230.17, 1705.15 and 1637.91. Out of an initial drop in the number of cases (of mostly below 1000). See that the C-19 exposures persisted with slightly identical case numbers of 972, 818.92, 591.7, and 591 for Seychelles, Botswana, Djibouti, and Sao Tome. Within the same order, came quick slides of 197.61, 179.55, to 158.66 as reported in Ghana, Gambia, and Egypt. This pattern not only extends further deep all through places like Congo, Ethiopia, and Guinea with up to 141.71, 120.69 to 106.43 in the cases. However, within the same period, a flattened curve emerges indicative of the incidents at 85.2, 40.29 to 0.84 in values all through Uganda, Mali to Tanzania (Figure 6). Along those lines, the cumulative deaths per 100,000 NB underlines the high rates (68.98, to 51.6, 3 and 32.71-26.32) for South Africa, Tunisia, Eswatini and Libya. The next batch of the cases covers Morocco, Cape Verde, Namibia, and Mauritania with fatality levels of 22.14, 20.33, 11.96 to 8.72 (Figure 7). These numbers dropped notably in the middle from Mali to Burundi by 1.68-0.02. tests per 1000 of the population (Figure 8). Furthermore, the nations of Botswana, Mauritius Seychelles, Gabon, and Cape Verde, South Africa and Morocco lead the rest of the continent by notable margins (of 255.8, - 231.8, and 215, to 201, 179.7, 135.7 131.1) in the tests per 1000 of the population. In the same period, note that the limited test levels of 24.2- 0.1 based on the info on the graph extends far deeper from Ghana to Tanzania (Figure 8).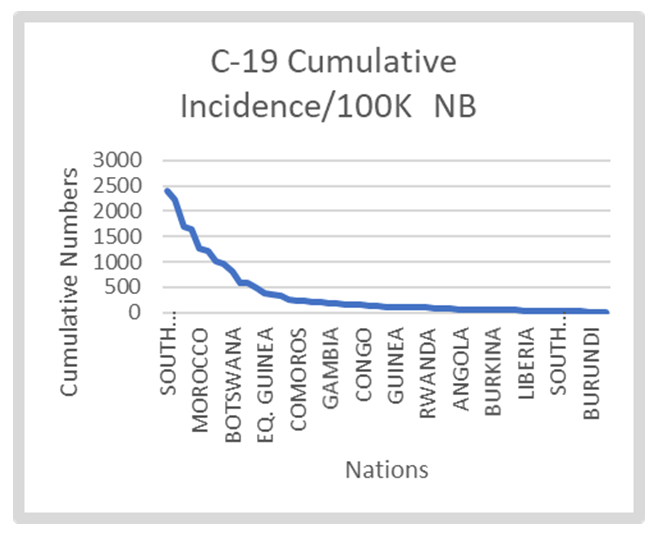 | Figure 6. C-19 Cumulative Incidence/ 000 |
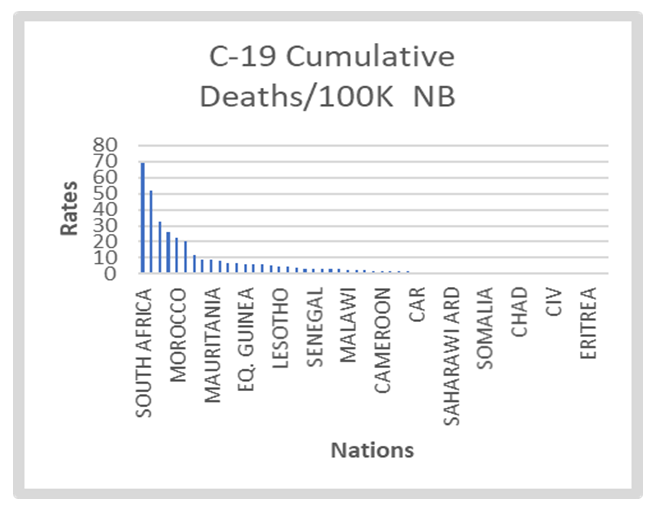 | Figure 7. C-19 Cumulative Deaths |
 | Figure 8. Tests per 1000 of Population Percentage |
3.2.2. The Percent Lacking Water and Health Care
To really comprehend the scope of COVID-19 pandemic outbreak and the effects on the natural resource sector of the continent. It is essential to consider the prevailing situation based on a set of health indices germane to the quality of life and the conditions of citizens in the fight against the spread in the first group of 14 nations. Having seen the significance of water in ensuring daily cleaning of contaminated surfaces. Let no one overlook the essence of adherence to hand washing routines after contacts with other people. Being fully required in public places and most households for safety, it turned out vital in containing C-19 spread. With the trend spanning from the west coast to the lower South region all through Guinea in the West coast to Tanzania in the East. The graphic information depicting the lack of water access and limited health care distinguished under the colors of blue and orange offers a shocking portrait of the disparity situation in the continent. The countries of Guinea, Gabon, Togo, Cameroun, Ivory coast, Madagascar, and Niger had the highest percentage of citizens lacking in these indicators than most of their neighbors. With between 60-70% of Guineans classified in the category of those in lack, Gabon and Togo followed up at similar levels of 60-67 % of citizens without medical care and another 69-55% deprived of clean water in the periods 2016-2018. Even at that, the same challenges are common in the French speaking zone of west Africa where Cameroun and Ivory coast held similar scores of 54% -60-58% in the main deprivation indices of folks classified as frequently without health care and portable H20 (Figure 9).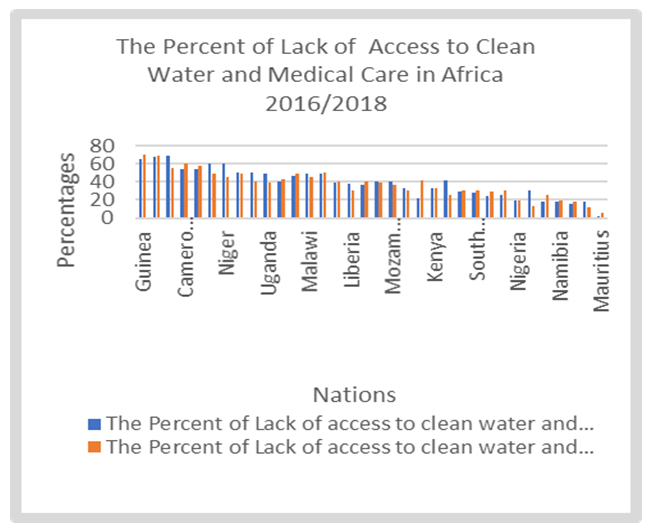 | Figure 9. The Percent of Lack of Access to Clean Water and Medical Care |
Not surprisingly, both Madagascar and Niger Republic showed considerable levels of health and water deprivations at both 60% to the mid and high forty percent (of 45-49). In as much as Benin, Senegal and Uganda all combined for total percentage averages of 49.66-42.66% elsewhere. In the group of 17 other nations ranked in the lower medium levels from Eswatini, South Africa to Botswana, the average percentage for both water and health deprivations remained at 36.11 to 36.64 correspondingly. Among the lower cadre of nations (Nigeria, Morocco, Cabo Verde, Namibia, Sao Tome and Principe, Ghana, and Mauritius), classified as having overall averages of 17.2-15.8%, the island nation of Mauritius accounted for the least cases in limited access to medical care and clean water estimated at 2 to 5%. Nigeria, despite its size and the level of income inequity still finished at 19%. Considering the foregoing trends, it is worth noting that throughout the continent, in the 2016/2018 periods, close to 38.6%-37 of citizens in most nations lacked access to a doctor and clean water (Figure 9). With the level of disparity in clean water and health care access that way in Africa in the face of the risks involved. Knowing the essence in C-19 pandemic mitigation, then it is safe to say, that the continent of Africa really “dodged a big bullet” for not suffering the huge casualties the detractors had hoped for in the process.
3.3. Impact Assessment
Considering how the devastations brought about by C-19 lock down wreaked havoc in the economy and environment of most natural resources’ dependent nations in the regions of the study area. The gravity of the damages suffered in these places overtime in the form of impacts continues to reverberate across nations. In the process, the spill overs carried huge ripples beyond national borders and onto the orbit of international capital to the detriment of Africans in their ability to harness natural resources. This consists of physical factors rooted in the deferment of oil and gas projects, to the dip in nature tourism and economic downturn.
3.3.1. Suspension of Major Fossil Fuel Projects/Physical
The evidence of the actual physical impacts of C-19 lock down has been felt all over the regions in Africa through the abrupt deferment of key oil and gas infrastructures germane to the export and daily production in the oil sector. With no choice left, these nations were forced into a corner requiring emergency measures likely to cripple their respective economic life support, they would not have undertaken under normal circumstances. Given the impacts, low prices not only forced the closures in liquefied natural gas (LNG) terminal deals in Egypt, in 2020, Exxon Mobil's multibillion $ investments in a similar venture were shelved in Mozambique. Elsewhere, Nigeria took the same path with delays on a huge LNG program worth billions of dollars Similarly, British Petroleum also pushed up the delivery of similar deals to 2023 in the Senegal-Mauritania axis. There is no question about it, the effects of C-19 pandemic took a deep toll on the viability of the continent’s energy sector in almost every region. In the process, it did take not take long enough until Egypt found itself in a situation that required the difficult decision of shutting down a vital shipping cargo outlet because of an all-time price decline in Liquified Natural Gas (LNG) prompted by C-19 pandemic. To that effect, the Egyptian LNG terminus was kept out of service due to the exposures on export bound shipments till the second half of July in 2020. Even the efforts to revitalize the Damietta Segas LNG Terminal did as well diminish, amidst the difficult fiscal situation for the LNG program designers. With the fallout not confined to only one place. Mozambique’s share of the liability came with the news of onsite interruption of construction activities by crew members during March 21, 2020. This came as a precautionary measure given the broad exposure to the virus together with a severely collapsed international gas market transactions. As the setback unfolded, it led to the suspension of the final investment decision (FID) US$30 billion Rovuma LNG Terminal project by Exxon Mobil in the country. Given the gravity of the disaster, further along in the West coast of the continent. By April 2 of 2020, Nigeria’s LNG sponsors declared that the development of a US$10 billion Train 7 project at the nation’s LNG Terminal could see delays till the 3rd quarter of 2020. Under similar circumstances, in the Southwest nations of Mauritania and Senegal as of April 7, of 2020, a department under British Petroleum stated plainly of the unavoidable delays of about 12 months in completing the Greater Tortue Ahmeyim LNG. In as much as, the 2.5 million tons per year (MTPA) facility is jointly held by Mauritania and Senegal, the anticipated time frame for project completion still runs until 2023.
3.3.2. Safari, Nature Tourism, and the Ecology
At the height of the C-19 pandemic outbreak, the 8th monthly assessment of 294 safari excursion operatives in Africa continued to show key drops. This involves a sharp 75% decline in activities with major effects on Africa’s US$12.4 billion safari tourism sector. Aside from the manifestation of a seemingly minor uptick under past reviews in which limited group of firms saw rising requests and reservations. However, the total decreases remained a colossal concern as the C-19 epidemic hovered on with a severe fiscal effect on Africa's multibillion dollar safari industry.Considering that many tourism operatives reported notable cuts in the reservation numbers deemed unmanageable in the long-term viability over the life of any firm. While it so turned out, that this is quite consistent with present projections. This amply reflects the outcome of past assessments before some light returns for quite a few safari firms as the effects of C-19 pandemic in the tourism hubs like Tanzania reached economically damaging levels. In a nation where the tourism sector provides many jobs to vast segments of the populace. Many of the safari firms lacked viability under prevailing circumstances with the employees living from hand to mouth and unable to afford the necessities of life like shelter and nutrition. Despite such deplorable conditions, and the way C-19 pandemic impacted over 80% of most safari operatives in Tanzania, and other associated industries. The fact that most operators still longing for a return to normalcy in the upcoming travel seasons are hopeful, stands as a testament to the market’s viability whenever C-19 stress eases. Yet, the total number of firms estimated at 90% suffered some ¾ reduction in their reservations that should have been completed during that stage of the year in a normal season. Regrettably, while the safari tour market situation in Namibia has not been promising enough, reservations for 2020 were deferred to 2021. In the case of Kenya, in the latter part of 2020, most tour groups had requests for bookings in 2021, but they were still at levels deemed inadequate.
3.3.3. Economic and Drops in Agricultural Exports
Regarding the pandemic exposures, the exports of farm products faced serious interruptions and several supply-chain problems. This turned overly bleak within Kenya’s flower industry, that virtually crumbled after the closures. However, the shipments of various produces in the form of vegetables, nuts, coffee, and cocoa became impacted along the way. Being part of the emergent concerns, this stems from weak demand from lockdowns within Europe, North America, and India. While this caused the closure of coffee joints, shops, and eateries together with processing amenities in the nation of India. In certain situations, the matter seemed compounded by distribution network challenges. The case in point comes from how the deferment in global air travel led to 75% drop in freight volume, and a surge in shipment expenses for Kenya’s horticultural industry. This negatively affected the sectors capacity to meet demands. From what unfolded so far, the likely fiscal shock waves encompass diminished orders for farm items across the continent of Africa, the interruption of marketing and daily businesses associated with the shipments of farm harvests, and the blow to farm output. In the process, the controls enacted to eradicate the diffusion of the coronavirus triggered interruptions in farm distribution networks. This prompted the dual edged dangers of worsening hardships and starvation among communities at the margin. Considering that many individuals in the countryside depend on agriculture as the basis for nutrition and additional revenue. Just know that the farming sector accounts for 65%-75% of employment and internal markets. Yet, some of the government actions initiated across the continent to contain C-19 impacted the farming community and the transportation of goods in ways that limited agricultural supply chain activities. With Accessibility to major trading centers impaired, the capacity to purchase and market the items was virtually impeded. This occurred as desperate farmers were compelled to trade away their products at solely cheaper fees. In other words, those farmers heavily hit by the lockdown were forced to sell their produce at giveaway prices. For that, it is unsurprising that countries such as Kenya considered major exporters of vegetables and flowers to states in the European Union, bore the brunt of diminished orders for their products in the face of C-19 lockdown, hence the fiscal damages.
3.4. GIS Mapping and Spatial Analysis
The GIS analysis consists of the visual display of spatial patterns underscoring the geographic dimensions of C-19 related indices relevant to the analysis. This consists of the different parameters of environmental, economic, biological, and medical markers built on exports of bio-pharm products, the spread, reported incidents and cumulative cases among nations and the deaths under corresponding levels across space. The other components cover public health care, natural resources development, and the trends in most natural resource’s rich nations of Africa over the years. Consistent with the spatial distribution of C-19 effects are the trajectory of bleak trade, the locations of suspended oil and gas projects, crude oil production and significant exposures synonymous with their natural occurrences and availability. With these attributes fully analyzed given their relevance across the regions and the potentials in Africa. The info expressed through geo-analytics under many scales and colors symbolize the potentials of the sector as well. Pinpointing the spatial-temporal dimensions of the capacity across the nations in space using GIS as the analytical tool, is clearly important in highlighting the potentials, risks, and the exposures in Africa amidst the spread of C-19 pandemic. From the gravity of what transpired, the dilemma of the continent stems partly from a perceived lack of preparedness to absorb the shock, and the inadequacies of medical facilities and the local pharmaceutical industry in meeting the needs of the population. To that effect, the dependency of African countries seemed fully exposed from the spatial distribution of pharmaceutical and medical products via imports, knowing their significance in the mitigation of C-19 symptoms. From the map, the bulk of those imports seemed fully concentrated in various places with much of that in the EU and India at 51.5% -19.3%. Next to that are trio of other nations made up of China, United States, and the United Kingdom where the import levels reached estimated proportions of 5.2,4.3 to 3.3%. What this means is the strong dominance of the west in the supplies of medical and pharmaceuticals to Africa (Figure 10). Based on the content of the 6 covid indices displayed under the legend box of the map, the oval green shaped objects of various sizes represent the cumulative incidence of cases associated with the pandemic from 100,000 to 1. In lieu of the trends as displayed, the vast proportions of cases under the 100,000 K-category are fully clustered along the Southern and Northern African axis. This represents a big contrast with minimal and average concentrations in the East Africa zone, Central Africa, Horn of Africa, together with West Africa (Figure 11). The breakdown of the epidemic spread across the geographic areas, puts the cities and provinces of the countries of South Africa, Egypt, Morocco, Tunisia as well as Ethiopia along the Northeast Africa zone to be at risk. Aside from the meagre clusters of cases on the west African sub region. From thereon, the spots on the map fades gradually towards neighbouring nations. The number of confirmed covid 19 cases per country also in the brown color affirmed the predominance of areas in South Africa and Morocco in the reported outbreaks of the disease with visible spread throughout North Africa to the Horn of Africa side of Ethiopia with limited presence in the central Africa region (Figure 12). While in the same order, emerges the incidence of deaths represented in red balls of various dimensions (Figure 13). The health spending portrayal as a percentage of the GDP seemed quite disparate in a dismal way, not enough to sustain the demands in Africa (Figure 14).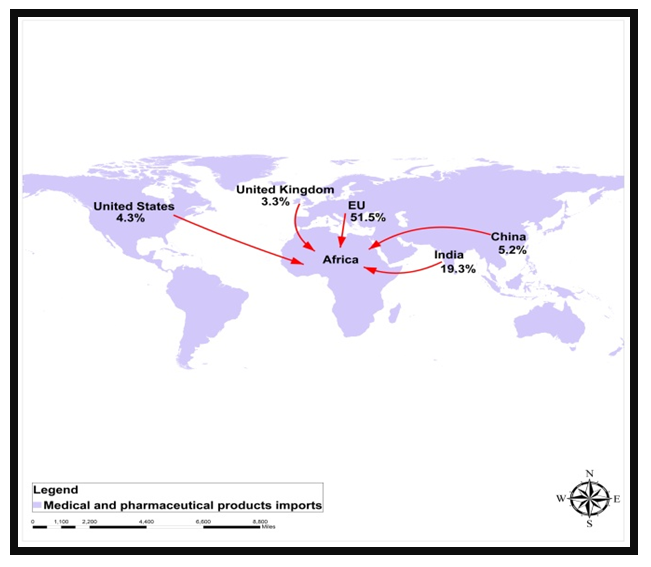 | Figure 10. Medical and Pharmaceutical Imports |
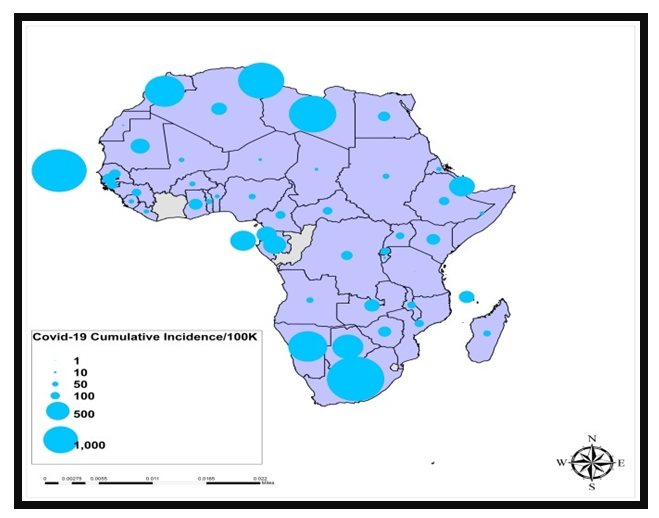 | Figure 11. C-19 Cumulative Incidence |
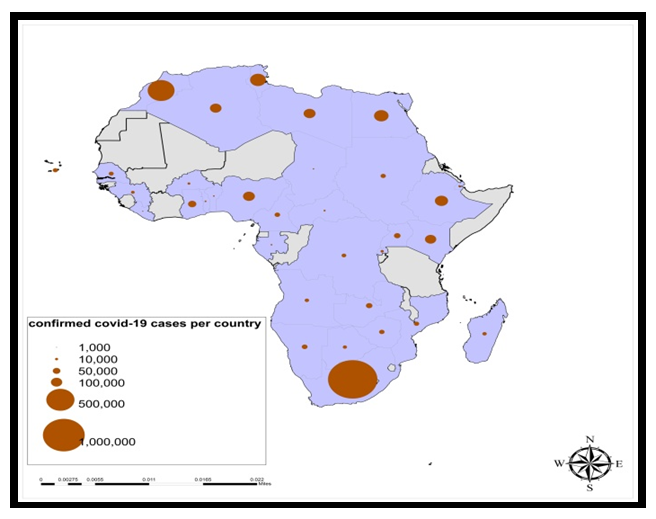 | Figure 12. Confirmed Cases Per Nations |
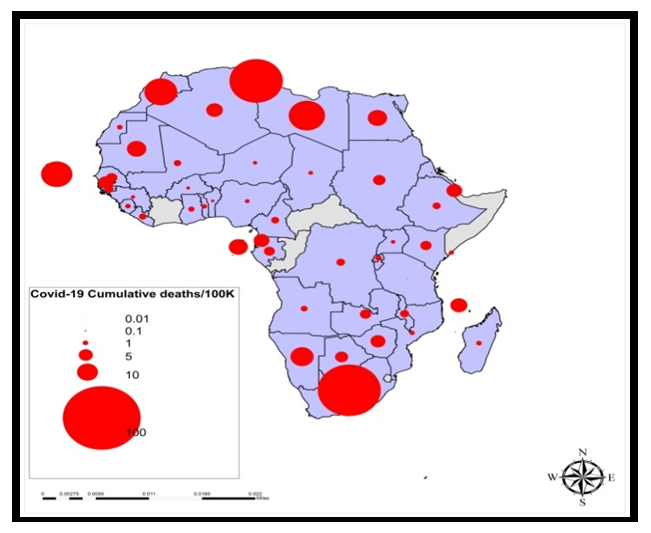 | Figure 13. C-19 Cumulative Dealths |
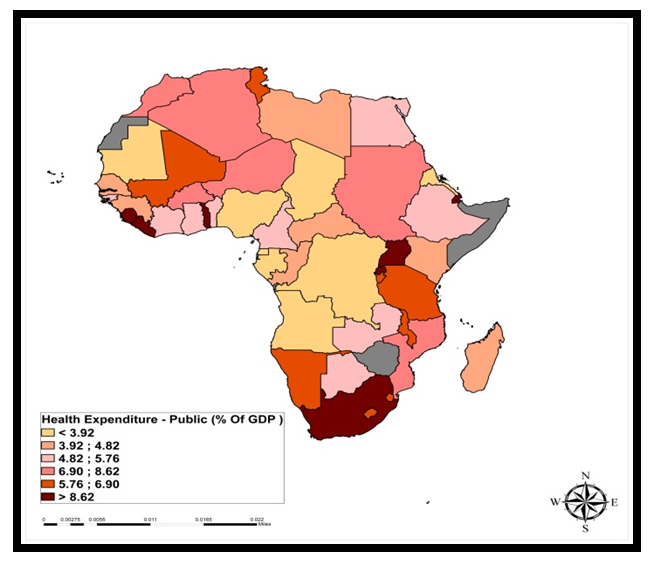 | Figure 14. Public Health Expenditures |
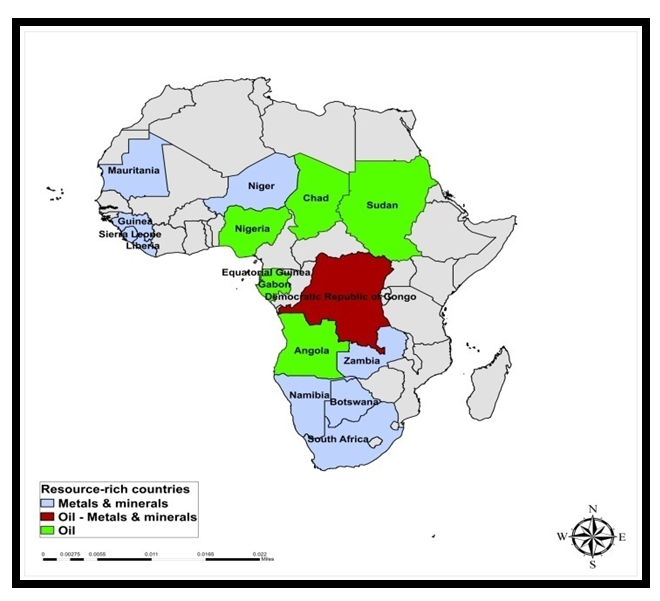
In a way, the geography of natural resources shows the scope and variety of spread pattens across different countries. From the spatial evolution, both oil and precious metals and minerals denoted in blue and red appears heavily diffused across the various sub regions. Of these places, while the profile of the continental oil hubs includes a spread out from North Africa, west, central and the portions of Southwest Africa. The flourishing presence of precious metals in space held firm in South and East Africa together with a few clusters in west Africa. The same goes for the distribution of metals and minerals in west Africa and the South African zones. Also, note that cotton for textiles is surely intact and mostly distinguished in yellow along a few patches on the map in North and west Africa. At the same time, the food /drinks hubs in light green looked faintly distributed along the shores of west Africa and the horn of Africa (Figure 15). There are also key actors in the major resource rich spots in the sub-Saharan areas, fully affected by the volatility of trade during the C-19 pandemic. Of these areas, consider the vast potentials of those nations (in light blue and red and light green) in assets ranging from metals, minerals, and oil. In the continent, the Democratic Republic of Congo in red leads the rest with the abundance of 3 major assets most notably oil, metals, and minerals deep into the central African region. In a similar vein, the neighbouring places such as Nigeria, Chad, Sudan, Gabon, and Angola stood out as the hubs for oil, while seven others from Mauritania to South Africa held very rich deposits of metals and minerals as well (Figure 16).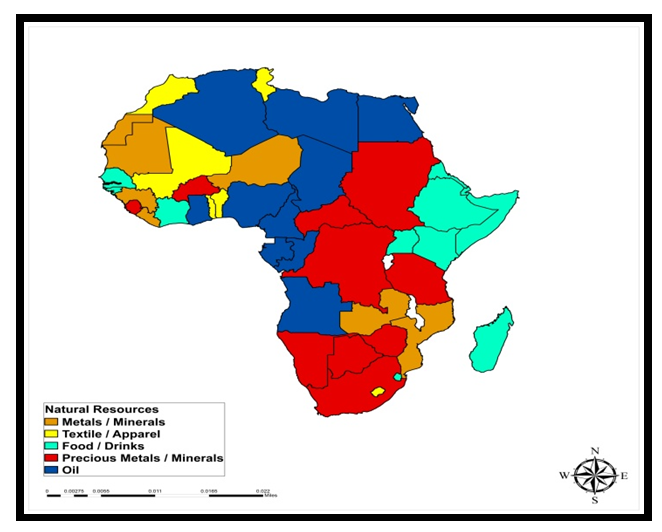 | Figure 15. Natural Resources Distribution |
 | Figure 16. Resources Rich Countries |
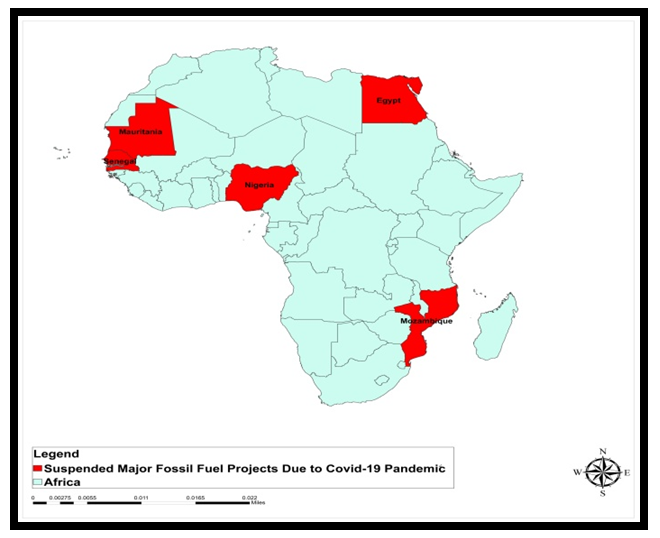
Aside from the pattern of projections pertaining to the bleak nature of trade forecasts for other hydrocarbon sensitive economies and raw materials in Africa. The map shows that the anomaly transcends the economies of Algeria and Libya in the North. This was followed by Chad and Nigeria in the west, together with the central states of Equatorial Guinea, Gabon, and the nation of Angola (Figure 17). The stress on the economies of the continent can be further buttressed by the spatial distribution of suspended major fossil fuel projects due to Covid -19 pandemic. Since some of the affected places are scattered around countries on the upper part of the map beginning with Egypt, 3 nations in west Africa (Mauritania, Senegal, and Nigeria) and Mozambique in the South Africa region also fall into that category (Figure 18). Furthermore, the spatial concentration of crude oil production volume per day, shows the dominance of Nigeria in dark blue, and closely followed by the likes of Algeria and Angola in the Southwest Africa region as well as Libya and Egypt (Figure 19). There were also additional exposures in commodity exports in the sub-Saharan Africa (Figure 20). 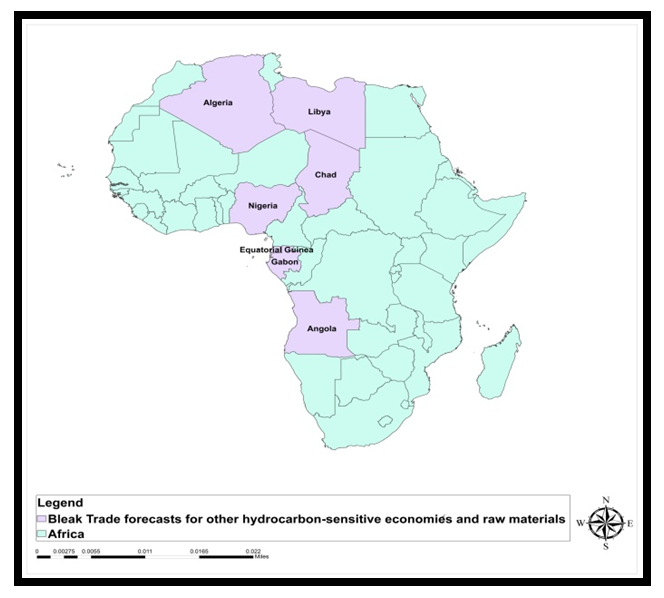 | Figure 17. Spatial distribution of Bleak Trade |
 | Figure 18. Suspended Major Fossil Fuel Projects |
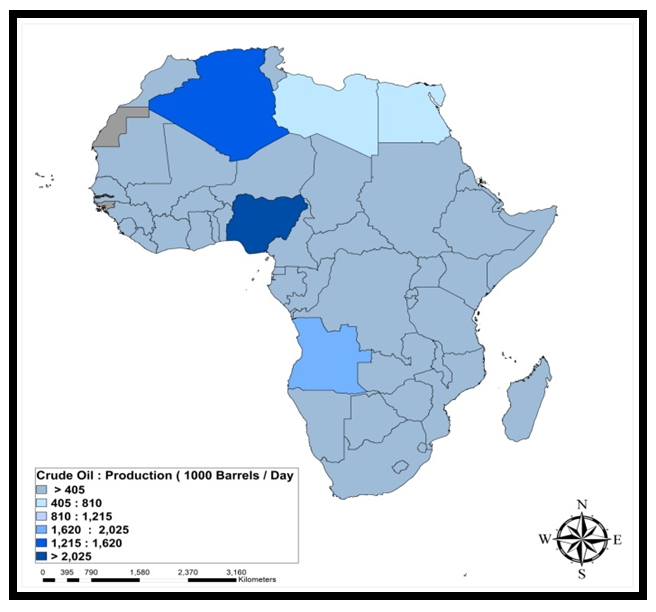 | Figure 19. Crude Oil Production |
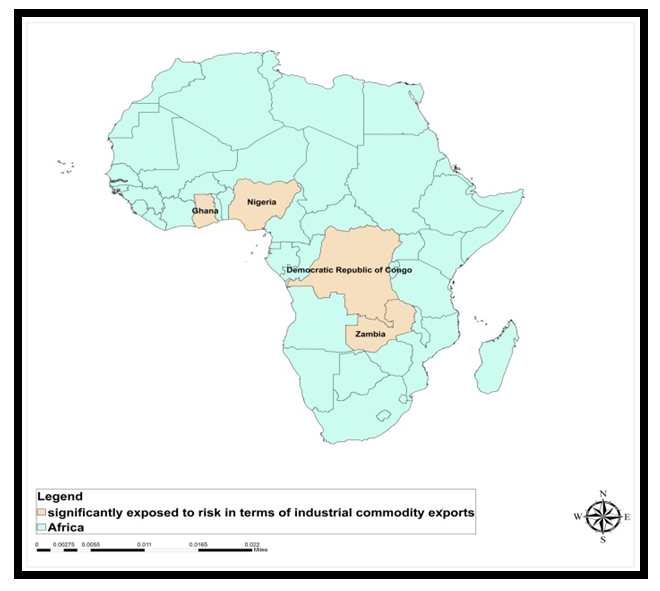 | Figure 20. Signficnant Exposures |
3.5. Factors Shaping the Battle With C-19 Pandemic
The important elements shaping the response to C-19 pandemic outbreak in Africa did not occur in isolation. They are linked to previous experience, partnerships, socio-economic, and biological and physical elements. These factors are described below one after the other.
3.5.1. Experience From Previous Pandemics
Africa’s familiarity in handling previous epidemics like HIV/AIDS and Ebola quickened trainings heavily reliant on innovative plans. This involved adherence to systematic response mechanisms for tracking, therapy, quarantine, and care giving for the sick. Accordingly, the nations garnered experiences from the past pandemics to involve groups by sharing info on the disease effects. While some had to adjust and adopt community strategies to craft an African approach aimed at fighting the pandemic. At the outbreak of the Ebola pandemic in West Africa, part of the common roots in the swift increase of the virus came from the distrust of the authorities, and this impacted the community support. The partnerships with community conflict resolution facilitators, trustworthy and esteemed civic representatives, coalesced the citizens and health providers. Being based on information sharing regarding the epidemic and the way it diffuses. The eradication of misinformation, mainly in isolated communities was prioritized also. Since E-trade seems to be changing the touch of African markets, nearly all the nations have adopted electronic tech, based on keyboard powered dealings. In fact, the recourse to digital cash transfers in East Africa, helped in decreasing C-19 diffusion.
3.5.2. Innovations and Partnerships
The scope of COVID-19 and Africa’s rapid measures were quite pronounced and cannot be discounted. This comes from the evidence across various areas in sub-Saharan Africa (SSA). Out of concerns over the aggressive spread of the virus in Senegal in the western zone. Many local digital start-ups who injected ingenuity used 3D printing to create facial safeguards and ventilator tubes. In Nigeria, the coalition against C-19 assembled financial groups to sustain public safety through the acquisition of PPE. Elsewhere, South Africa used cell phones to enhance contact tracking efforts, coupled with telemedicine for all. Still, while the African civil society backers and the firms forming unparalleled alliances to combat the virus. The African Influencers for Development initiative, through the UNDP, gathered health experts with money and infrastructure. Equally, as the Ethiopian high-tech experts abroad teamed up with the government to design contact tracking devices, public enlightenment, and data compilation. The UN organized other initiatives via the WHO, the World Food Programme (WFP), the African Union and Africa CDC, to deliver the required medical supplies to African nations battling C-19 pandemic.
3.5.3. Socio-Economic Demography and Policy
The epidemic has impacted affluent and impoverished nations in the same way as well. However, among places previously battling with poor conditions and hardships, C-19 is generating additional dangers of insecurity. In the Democratic Republic of the Congo, strict travel restrictions along with prevalent food insecurity before, but now at unprecedented levels because of famine, flood, and pest diseases, are compounding the situation. Furthermore, in the SSA side, the epidemic seems to be biting hard at places known to be facing huge climate change induced economic damages from irregular rainfall to desertification. Just as the disaster relief actions to eradicate C-19 moved assets further out of pesticides use in crop management amidst locust invasions in the Horn of Africa. In areas previously ravaged by fighting and where survival plans hinged on migration. The C-19 restrictions have not only trapped many in war torn zones from moving to safe places. But millions could be forced to migrate from their places of domicile in the Sahel zone due to dwindling incomes and insecurity from C-19 and climate change risks.
3.5.4. Health Biological and Physical Elements
Additional elements worthy of note encompasses the capacity of pre-existing defensive immunity reactions. These are linked to prior experiences to different virus and BCG inoculation, a vaccine for combating TB administered after birth across Africa. The exhaustive assessment covering 55 nations, (63%) of the globe’s population found considerable relationships between growing BCG treatment at the formative stage of life and positive effects to C-19 exposure. Given that genetic element could as well be vital. The currently, identified haplotype (set of genes) linked with bigger probability of severity and evident in 1/3 of south Asian genomes and 8% among Europeans seems virtually non-existent in Africa. Since this and unknown elements like possible variations in upward mobility remain at the center of current study. The essential likelihood which rests on the community health measures of African nations, rooted in prior exposures was instrumental in preventing the spread at levels below the rates in regions across the globe. Additionally, there are also those who blame wildlife trade as well.
3.6. Efforts and Initiatives
Seeing the record spread of C-19 pandemic at the initial stage globally and the occasional spike in the emergence of new variants over time sporadically in nations heavily dependent on natural resources to generate revenues. The current initiatives, among multilateral entities and state institutions in Africa sparked a turnaround. Accordingly, measures are being taken by government entities and other actors to mitigate the dangers of C-19 pandemic.
3.6.1. Initiatives of Global Multilateral Agencies
With the global scope of the pandemic outbreak. International agencies like the FAO and the World Bank emerged as an integral part of the mitigation measures through the coordination of various plans. FAO on its part, recently made public its comprehensive C-19 mitigation action and rehabilitation scheme. This is intended at preventing a worldwide food scarcity during the pandemic and later, as it embarks on short to longstanding growth plan in self-sufficiency in food production and nourishment. The organization seeks $1.2 billion in fresh ventures to sustain the scheme. The novel collaborative program seeks to alleviate the current effects of the epidemic while bolstering longer-term flexibility of farm production and incomes. In the face of the pandemic outbreak, the World Bank Group initially injected US$14 billion rapid accessible fund. With time, the agency used about US$160 billion in total assets as part of its reaction to the disaster in the coming year and 3 months. The first phase of 25 programs was aimed helping with credit lines valued at US$2 billion to aid nations (including 10 in the African continent). The belief is that such a measure would be a vital component of the international plan to lessen the effects of C-19 on the continent’s marginal population.
3.6.2. Government Institutional Efforts In Africa
The activities of many organizations in Africa have been felt in the moves towards the containment of C-19 pandemic. For that, entities like The East African Community, the Southern African Development Community, the Economic Community of West African States, and the Intergovernmental Authority on Development initiated projects in their various zones. In the process, when the initial cases of C-19 emerged in Africa on February 14, 2020. the African Union stepped up through a common continent-wide plan followed by the simultaneous actions of the nations and the regional trading blocs, by creating a common health program. Accordingly, the Africa Centres for Disease Control and Prevention (Africa CDC) started with the collection of actual time data, in partnership with the World Health Organization (WHO). As part of the mission, The Africa CDC’s novel Collaborative initiative on Accelerated COVID-19 Testing (PACT), screened about 10 million citizens in 72 weeks. Additionally, the African Development Bank (AfDB) is also aiding African nations and the industries with a view to minimizing the monetary and societal effect of C-19. This comes under the Feed Africa Response to Covid-19 (FAREC) plan aimed at offering aids for nations to assist growers buy farm materials during the crisis.
4. Discussion
The study emphasized the ongoing influence of C-19 pandemic on Africa’s natural resources sector. This primarily centred on how the initial global spill overs of the pandemic outbreak affected the natural resources industry across the subregions. With the nations and their institutions rattled vastly. They were besieged by the prolonged threats of fiscal shocks injected into the respective economies as shown by the widespread losses in revenue and drops in projected in oil and gas earnings and the budgets. Accordingly, this not only revealed the heavy dependence of African nations in the mineral, tourism, and agricultural subsectors to the orders placed from foreign nations. But it showed the regions heavily hit and those reeling from the deferred multibillion $ infrastructure upgrades in the oil sector, crucial to the fiscal welfare of Africa. The key revelation from the study, involves the links between C-19 outbreak, the natural resources sector, socio-economic, health and physical factors.Since the C-19’s spread resulted in shutdowns and a strain on health facilities, the doom many experts projected would overwhelm Africa failed to fully materialize, but the risks remain. For that, the fiscal growth in Sub-Saharan Africa (SSA) dropped from 2.4% by 2019 to at least -2.1% to -5.1% in 2020. The projected drops stem from the reduced revenues in nations from South Africa, Nigeria to Angola and others deeply reliant on commodity export revenues that saw price collapses. While on the 4th of May in 2020, the sum of proven C-19 incidents rose to 44,873 with 1,807 deaths. The nations of South Africa, Egypt, Morocco, and Algeria scrambled to contain the opening waves of the disaster. To track the scope of C-19 effects on Africa’s natural environment amid concerns on fatality risks, fiscal shocks, dips in tourism, declining orders in minerals, and farm products and the other challenges. The enquiry used mixscale tools of descriptive statistics and GIS with data involving a variety of socio-economic and physical and environmental indices made up of oil production, flowers, and others. From the results, production not only surged, but the continent’s capacities in oil, minerals, farms, and tourism stood firm before the disruptions. The same thing holds in the farm sector where Africa’s largest floral producers in Kenya discarded those items given the low demands from the lockdowns in the EU. For that, farm exports reflect barely 20% of the 60 tons of cut flowers typically exported daily. The GIS analysis of the patterns ushered insights into may things including the spatial dispersion of C-19 epidemic risks indices comprising of cases, incidents, deaths, national health expenditures, crude oil mineral output and distribution. The spatial analysis also reflects the visual presentation of the areas affected by the suspension of mega fossil fuel projects in the affected spots from North, South, to West Africa. With all these linked to socio-economic and physical, medical/biological factors. The results point to abundant minerals, contractions in revenues, sectorial impacts, and spatial dispersal of the trends. For remedy, the enquiry offered solutions ranging from economic stimulus, market diversification, design of health information system to the promulgation of effective policy.
5. Conclusions
This enquiry analysed the ongoing risks and the impacts of C-19 pandemic on Africa’s natural resources sector with valuable insights specified in the following order. a) abundant natural resource potentials in Africa; b) mitigation measures evident; c) impacts obvious; d) activities prompted by many factors; e) mix scale model very effective. Seeing the characterisation of Africa as frontier of nature stretched over mega diversity eco-zones bestowed with precious assets such as gold, diamonds, oil, and copper. The sheer presence of vast farm produce made up of cocoa, flowers, and timber in large scale integrated into the orbit of global capital, reinforces the unsurprising way C-19 rattled the sector. The assortment of these rare natural assets in Africa and their appeals to clients indicates the occurrence of these items exclusively in specific nations and regions from the East to North Africa. Aside the considerable presence of banquet flowers mainly in Kenya, Ethiopia, Tanzania, Uganda, and South Africa. The vast capacity of farm items and oil and gas activities in 6 other nations are central to the daily commodity trading in the global marketplace given their values. So, assembling info on rare assets central to speculative capital amidst the fiscal shock in the natural resource sector remains crucial. This is so, as planners depend on steady snapshots on opening and closing info of rare assets in verifying the state of the sector for investors during emergencies like C-19. Seeing the damage which C-19 pandemic meted on the African environments and society. The pace of interventions from global, multilateral, and African institutions exemplifies genuine commitments to fight the pandemic. Being a move from all fronts in different parts of Africa, germane to the economy given the fiscal shocks. The initial measures on the agricultural side from FAO started with a broad scheme anchored in food security and abundant capacity. Elsewhere on the fiscal part, the World Bank Group injected billions of dollars as available pool of cash in response to the pandemic that benefited 10 Africa states. In as much as state entities from regional trading blocks, the AU, the ADB and African CDC stayed active during the prime phase of the outbreak via contingency measures. The Africa CDC accelerated C-19 testing, to screen millions of citizens. In showing the scale of such institutional response to C-19 crisis, in a novel way, the enquiry provides the preamble for entities involved to fully evaluate their performance and intents. This will enable them to learn from how their plans were executed on the ground.The ecologic, physical, and economic and sectoral implications of C-19 pandemic on Africa’s natural resources were obvious. With the deferral of key fossil fuel projects crucial to the economic lifeline of many. Multiplicity of nations (Egypt, Mozambique, Nigeria, and Senegal-Mauritanian axis) suffered unexpected fiscal blows. In a similar vein, C-19 also made its presence felt in the eco-tourism sector, as the globally esteemed US$12.4 billion safari and nature tour industry in Africa saw huge declines in business at the rate of 75%. This came with the huge effects resulting from the ban on air travels, empty resorts, and job losses. The pandemic effects on the farm sector were so bad that the enforcement of lock downs worsened the precarious situations as it created unwanted exposures to food insecurity vulnerability with farmers unable to move items around. In the process, Kenya’s export bound flower trade completely collapsed as horticulturists were forced to discard them. The compilation of such natural resource index herein, offers the much-needed reference tool vital for managers, and investors focused on gauging the gravity of C-19 on the sector and economy based on impact analysis.Essentially, the research stayed on target in locating the physical, socio-economic, and health elements germane to the crisis. This was manifested through among other things including partnerships and Africa’s experience in dealing with past pandemics. Knowing how the epidemic impacted nations through deaths, infection rates and cases. The restrictive nature of lock downs as part of the emergency plans instituted under policies and laws in the nations collectively, compounded the situation. In building on Africa’s experience, the authorities capitalized on their familiarity in responding to past disasters such as AIDS and Ebola. This bought Africa some time in mobilizing the needed resources and the capacity to create an enabling environment for the training of personnel, patient care and isolation, borrowing from the existing template. As much as biological and ecological factors offered Africans the natural defensive immune mechanism which others lack. The bunch of innovative measures that came from partnerships and collaborations involving many institutions both local, global, multilateral, and regional, helped Africa dodge the bullet and the doom her detractors were expecting and praying for.Furthermore, the uses of mix scale methods as analytic device were quite effective. Applying the model made up of descriptive statistics and GIS mapping as analytical tools ushered new modes for evaluating continental, regional and national natural resources capacity and the risks. The model was quite useful in identifying the study area and spotting the trends, together with the collection of info on the elements and variables from rare mineral production to crude oil, flower exports and tourism receipts. While this method stayed quite critical in serving researchers involved in geo-spatial assessment in natural resources planning. The GIS analysis shows the concentration and locations of rare natural resources capacities throughout Africa along with clusters of areas vulnerable to volatility and risk exposures regarding exports. Consequently, the GIS mapping proved its essence in highlighting the dispersal of C-19 cases, and the spatial path of bleak trade forecasts and deferred mega fossil fuel projects. The capacity of GIS in pinpointing the spatial dimensions of these trends, increases awareness of their presence in the identifiable spots in the continent.Considering the gravity of C-19 pandemic outbreak and the dangers it posed to the viability of Africa’s natural resources sector and the hubs harnessing these assets across the nations and the questions raised. It is conceivable that managers will be pressed in future to answer queries critical to risks management, and the interactions between C-19 outbreak, economy and the ecosystem. The questions revolve around which pandemic related problems will Africa’s natural resources sector face over time? How will it impact continual supply and distribution? What factors will influence future disasters? Drawing from these queries, creates openings for research and practice to assert the basis of health safety, better sharing of info and people centred health emergency laws and integrated regional environmental health and natural resource info system to serve Africa.
References
| [1] | VIrusha, Subban. (2020 March). The Impact of COVID-19 on African Trade. Johannesburg, SA: Africa Portal SIIAF. |
| [2] | OECD. (2020). COVID-19 and Africa: Socio-Economic Implications and Policy Responses. Paris, FR: OECD. |
| [3] | Africa News. (2020 March). When Covid-19 and OPEC Price War strikes Africa’s Oil & Gas Sector. APO Group. |
| [4] | Marius, Oosthuizen. (2020 October). Impact of COVID-19 in Africa: A Scenario Analysis to 2030 Affiliations. Retrieved September 5th 2020 From https://hdl.handle.net/10520/EJC-1fd9f859d. |
| [5] | Kelly, Alexander. (2020). Impact of COVID-19 in Africa: A Severe Setback For Development. Tilburg University. Retrieved September 5th, 2020, From https://phys.org/news/2020-08-impact-covid-africa-severe-setback.html. |
| [6] | AFP and Macu. (2020 December). Covid-19 Takes its Toll on African Economy. MNA International Health Shotdowb. |
| [7] | Allan, Olingo. (September 2020). Africa: Low Covid-19 Impact On Africa Baffles Scientists. Retrieved September 5th 2020, From https://allafrica.com/stories/202009070824.html. |
| [8] | Kevin, Marsh. (2020 October). Scientists On How Africa Has So Far Weathered the Worst of Covid-19’s Health Impact. Oxford, UK: The Conversation University of Oxford, African Academy of Sciences. |
| [9] | Africa Center for Strategic Studies. (2020). Mapping Risk Factors For The Spread of COVID-19 In Africa. Retrieved September 5th 2020, From https://africacenter.org/spotlight/mapping-risk-factors-spread-covid-19-africa/. |
| [10] | AUC. (2020). Impact of the Coronavirus (COVID 19). On The African Economy. Addis Ababa, Ethiopia: African Union Commission. |
| [11] | Howard, B. (2020). African Governments Failing In Provision of Water and Sanitation, Majority of Citizens Say. Retrieved September 5th 2020, From http://985.so/kn9z. |
| [12] | IMF. (2020). IMF Regional Economic Outlook: Sub-Saharan Africa: COVID-19: An Unprecedented Threat. Washington, DC: International Monetary Fund. |
| [13] | McKinsey. (2020). Tackling COVID-19 In Africa. Retrieved September 5th 2020, From https://www.mckinsey.com/featured-insights/middle-east-and-africa/tackling-covid-19-in-africa. |
| [14] | ECA. (2020). Economic Impact of the COVID-19 on Africa. Retrieved September 5th 2020, From http://www.uneca.org/sites/default/files/uploaded-documents/stories/eca_analysis_-_covid-19_macroeconomiceffects.pdf. |
| [15] | Oxford Economics. (2020). African Giants Stumble Due to Covid-19 Pandemic, Oxford, UK: Oxford Economics. |
| [16] | Gatiso, T.T. (2018). The Impact of The Ebola Virus Disease (EVD) Epidemic on Agricultural Production and Livelihoods in Liberia. PLoS Negl Trop Dis. Retrieved September 5th 2020, From doi:10.1371/journal.pntd.0006580. |
| [17] | Fiscal Effects On Previous Gains. AERCA (2020). Retrieved September 5th 2020, From http://985.so/knem. |
| [18] | Zeng, Doug. (2020 June). How will C-19 Impact Africa’s Trade and Market Opportunities? Washington, DC: The World Bank. |
| [19] | The World Bank. (2020). Africa's Pulse: Assessing The Economic Impact of Covid-19 and Policy Responses In Sub-Saharan Africa. Washington, DC: The World Bank. |
| [20] | Africa Insiders. (2020 March). Africa Insiders: The Covid-19 Recession Is Going to Hurt. London, UK: African Arguments, Royal African Society. |
| [21] | Andy, Aston. (2020 March). COVID-19: Managing The Operational Impact In The Natural Resources Industries. Retrieved September 5th 2020, From http://985.so/kn91. |
| [22] | Fatima, Denton. (April 2020). Will COVID-19 Leave Fuel-Rich African Countries Gasping For Breath? Accra, Ghana: The Institute for Natural Resources in Africa, the United Nations University. |
| [23] | Simeon, Ehui. (2020 May). Protecting Food Security In Africa During COVID-19 Africa In Focus. Washington, DC: The Brookings Institute. |
| [24] | Merem, E. C. (2020). Issues In Transboundary Water Use In The River Nile Basin Area of Africa. World Environment. 10:2: 27-44. |
| [25] | Merem, E. C. (2018). Appraising Variations In Climate Change Parameters Along The Lower West African Region. Journal of Safety Engineering. 7:1: 1-19. |
| [26] | Merem, E. C. (2019). Regional Assessment of the Food Security Situation in West Africa with GIS. Food and Public Health. 9:2: 60-77. |
| [27] | Wells, Laura. (2020) Study Identifies Dire Economic Impact of COVID-19 in Africa. Baltimore, MD: John Hopkins University, Communication Center. |
| [28] | Gillian, Pais, (2020 June). Safeguarding Africa’s Food Systems Through and Beyond The Crisis. Nairobi. Kenya: McKinsey and Company. |
| [29] | FAO (2019). New Report Identifies 27 Countries Heading For COVID-19-Driven Food Crises. Rome, Italy: Food and Agriculture Organization (FAO) and World Food Programme (WFP). Retrieved September 5th, 2020, From http://www.fao.org/news/story/en/item/1298468/icode/17. |
| [30] | FAO. (2020 July). Food and Agriculture Organization (FAO) Launches The New COVID-19 Response and Recovery Programme. Rome, Italy: FAO. |
| [31] | Egboboh, Cynthia. (2020 June). AfDB, FAO Advocate Digitalisation of Agriculture Value Chain To Spur Green Revolution for Africa. Businessday. |
| [32] | Dongyu, Q.U. (2020 May). Task Force Focusing On Impacts Of COVID-19 On Africa’s Food Security Begins Work. Rome, Italy: FAO. |
| [33] | FAO (2020 July). Coronavirus – Africa: Food and Agriculture Organization (FAO) – led global COVID-19 Food Coalition gains momentum. FAO: Rome Italy. |
| [34] | Morné van der Merwe. (2020 March). South Africa: The Impact of COVID-19 on Key African Sectors. Johannesburg, South Africa: Global Compliance News. |
| [35] | Yasser, Elnaggar. (2020 December). Impact of COVID-19 Pandemic on Major Fossil Fuel Projects. Global Energy Monitor. |
| [36] | Moro, Cedric. (2021). Covid Africa Open Data Dashboard. African CDC. Addis Ababa, Ethiopia. |
| [37] | Töre, Özgür (2020 October). New Survey Reveals Massive Impact of COVID-19 on Africa’s Safari Industry. FTNews. |
| [38] | Phillip, Xolisa. (2020 June). South Africa vs Coronavirus: Billions Already Lost in Tourism. Johannesburg, South Africa: Africa Report. |
| [39] | African Union. (2020 April). Impact of the Coronavirus (COVID-19) on the African Economy. Addis Abba, Ethiopia: African Union Report, African Union. |
| [40] | Plaut, Martin. (2020 March). Flowers and Horticultural Industry of Kenya. Word Press. |
| [41] | Africa News (2020 July). COVID-19 Impact On Agriculture: Assessment of Recovery Efforts. Africa News. |
| [42] | Mkhabela, Thulasizwe. (2020 March). How Covid-19 Is Impacting on SA’s Agriculture. Johannesburg, South Africa: Agricultural Research Council. |
| [43] | Oberem, Peter. (2020 May). The Impact of Covid-19 on South Africa's Agriculture Economy.CR Tables a Plan For Recovery. Retrieved September 5th 2020, From https://www.msn.com/en-za/news/other/the-impact-of-covid-19-on-south-africas -agriculture-economy/ar-BB14MC3s. |
| [44] | Abroqua, Samuel (2020). Impact of COVID-19 on Ghana’s Agriculture – In the Eyes of a Youth Farmer. Impakter. |
| [45] | Merem, E. C. (2021). The Assessment of China’s Scramble for Natural Resources Extraction in Africa, World Environment. 11:1: 9-25. |
| [46] | Merem, E. C. (2021). Analyzing the Environmental Risks from Electronic Waste Dumping in the West African Region, Journal of Health Science.11:1:1-16. |
| [47] | Merem, E.C. (2021). Analyzing the Use of Genetic Modified Organisms (GMOs) in Agriculture in the US Midwest Region, Food and Public Health. 11:1: 1-17. |
| [48] | Merem, E. C. (2021). The Regional Assessment of Groundnut Farmland Use in Northern Nigeria, International Journal of Food Science and Nutrition Engineering. 11:1: 1-19. |
| [49] | Merem, E. C. (2018, February). Analyzing the Tragedy of Illegal Fishing by Foreign Vessels on the West African Coastal Region. Proceedings of the 26th Joint Conference of National Association of African American Studies (NAAAS). Dallas, TX. |
| [50] | Merem, E.C. (2019). Regional Assessment of Climate Change Hazards in Southern Nigeria with GIS. Journal of Safety Engineering. 8:1: 9-27. |
| [51] | Merem, E. C. (2019). Regional Assessment of the Food Security Situation in West Africa with GIS. Food and Public Health. 9:2: 60-77. |
| [52] | Merem, E. C. (2019). Analyzing Land Use and Change Detection in Eastern Nigeria Using GIS and Remote Sensing. American Journal of Geographic Information System. 8:2: 103-117. |
| [53] | Merem, E.C. (2018, March). The Analysis of Food Security Trends In The West African Region. Proceedings of the Association of Social and Behavioral Scientists (ASBS), INC Conference. Nashville, TN. March 2018. |
| [54] | Innes. John. (2020). Africa: Continent. Chicago, IL: Encyclopedia Britannica. |
| [55] | Merem, E. C. (2018). Assessing the Menace of Illegal Wild Life Trade In the Sub Saharan African Region. Advances in Life Sciences. 8:1:1-23. |
| [56] | Desjardins, Jeff. (2015 December). Infographic: Visualizing Chinese Investment in Africa. Vancouver, BC: Visual Capitalist. |
| [57] | Merem, E. C. (2020, March). The Assessment of China’s Scramble for Natural Resources Extractions In Africa. Proceedings of the 16th International Symposium on the Recent Advances in Environmental Health. Jackson, MS. 2020, March 29-April 1. |
| [58] | Merem, E.C. (2018). Assessing the Menace of Illegal Wildlife Trade In the Sub Saharan African Region. Advances in Life Sciences. 8:1:1-23. |
| [59] | Merem, E.C. (2021, February). Analyzing Issues in Africa's Natural Resource Sector: The Case of COVID 19 pandemic Impacts. Proceedings of the 30th Joint Conference of National Association of African American Studies (NAAAS). Dallas, TX. February 16, 2021. |
| [60] | Evans, David (2020April). The Economic Impact of COVID-19 in Africa: A Round-Up of This Week’s Analysis. Washington, DC: Center for Global Development. |
| [61] | OECD (2020 May). COVID-19 and Africa: Socio-economic Implications and Policy Responses. Paris, FR: OECD. |
| [62] | The United Nations (2020 May). UN Policy Brief: Impact of COVID-19 In Africa. New York, NY: The UN Communications Department. |
| [63] | Delport, Jenna. (September 2020). Home Africa By Region How COVID-19 Has Impacted Africa’s Wealthiest Countries by GDP. News Africa. |
| [64] | Bettridge, Judy. (2020). Responding to COVID-19: Future Impact On Animal-Source Food Supply In Africa. J, NRI News. |
| [65] | Abayomi, Louise. (2020). Responding To COVID-19: The Role of HACCP In Addressing Virus Transmission in Nigerian Food Systems. Kent, UK: University of Greenwich Natural Resources Institute. |

 Abstract
 Reference
 Full-Text PDF
 Full-text HTML