Amina Shehu Bature1, Lawal Anako Opotu2, Noma Mounkaila1
1University of Medical Sciences and Technology, Khartoum, Sudan
2Department of Applied Chemistry, Kaduna Polytechnic, Kaduna, Nigeria
Correspondence to: Lawal Anako Opotu, Department of Applied Chemistry, Kaduna Polytechnic, Kaduna, Nigeria.
| Email: |  |
Copyright © 2021 The Author(s). Published by Scientific & Academic Publishing.
This work is licensed under the Creative Commons Attribution International License (CC BY).
http://creativecommons.org/licenses/by/4.0/

Abstract
This study examined water supply and sanitation situation in selected areas in Kaduna metropolis in the Northern part of Nigeria. 297 households were randomly selected for the study. Data was collected using pre-test structured questionnaires and observational checklists, covering specific concerns on Knowledge, Attitude and Practice (KAP) on Water, Sanitation and Hygiene (WASH). The survey shows that majority of households in the study areas have access to improved water facilities and 90% of the households in urban and urban slums have access to improved sanitation facilities. Hand pump, privately owned boreholes and tube well are the major sources of water supply accounting for 34.5%. Many households do not have access to treated water from Kaduna State Water Board. Among the 297 surveyed households, only 53 households were connected to piped line water from the water board. Based on the World Bank classification of access of below 200 meters as accessible while greater than 200 meters is regarded as inaccessible, a lot of the sampled respondents in the study area do not have easy access to potable water supply in terms of distance. Most of the water sources are within 500-meter radius although majority of the respondents spend not more than 15 minutes for water collection. The survey has also revealed that, 90% of the households in urban and urban slums have access to improved sanitation facilities but majority of the facilities were constructed by private individuals. It is therefore recommended that the private sector should be involved in water supply in the areas of fund mobilization for the construction, maintenance, rehabilitation and expansion of water supply and sanitation facilities in Kaduna metropolis. Government agencies responsible for the provision of water supply and sanitation facilities should be adequately funded and equipped to carry out their services to the people in order to achieve the goal 6 of the Sustainable Development Goal by the year 2050.
Keywords:
Water Supply and Sanitation (WSS), Waste Disposal, Service Provision and distance covered, Water use, Water resources
Cite this paper: Amina Shehu Bature, Lawal Anako Opotu, Noma Mounkaila, Evaluation of Water Supply and Sanitation Situation in Kaduna Metropolis in Northern Nigeria, Public Health Research, Vol. 11 No. 1, 2021, pp. 1-14. doi: 10.5923/j.phr.20211101.01.
1. Introduction
Clean and accessible water are desired for all parts of the world that we live in. There is sufficient fresh water on the planet to achieve this. However, due to bad economics or poor infrastructure, every year millions of people, most of them children, die from diseases associated with inadequate water supply, sanitation and hygiene. Water scarcity, poor water quality and inadequate sanitation negatively affect food security, livelihood choices and educational opportunities for poor families across the world. Drought afflicts some of the world’s poorest countries, worsening hunger and malnutrition [1].Globally, 663 million people and 1-in 10 lack access to safe water. 2.4 billion people and 1 in 3 lack access to a toilet. Twice the population of the United State lives without access to safe water. One third of the global population lives without access to a toilet [2]⋅ More people have a mobile phone than a toilet [3]. A review of rural water system sustainability in eight countries in Africa, South, and Central America found an average water project failure rate of 20-40% [4].Globally, one third of all schools lack access to safe water and adequate sanitation. In low and middle-income countries, one third of all healthcare facilities lack a safe water source [5]. The water crisis is the number one global risk based on impact to society (as a measure of devastation), as announced by the World Economic Forum in [6].Water supply and sanitation in Nigeria, the largest African country and the continent’s biggest oil exporter, are characterized by low levels of access to an improved water source and limited access to improved sanitation. Responsibility for water supply is shared between three levels of government (Federal, State and Local). The Federal government is in charge of water resources management while state governments have the primary responsibility for urban water supply. Local governments together with communities are responsible for rural water supply. The responsibility for sanitation is not clearly defined. Water supply service quality and cost recovery are low. Water tariffs are low and many water users do not pay their bills. Service providers thus rely mostly on occasional subsidies from government to cover their operating costs. Investments in water supply are mainly financed by foreign donors and fall short of what is required to achieve significant increase in access to safe drinking water [7]. Water supply is seen as the available water provided to fulfil a particular need; if the need is domestic, industrial, or agricultural, the water must fulfil both quality and quantity requirements. Several types of water supply projects include wells, dams, or reservoirs. Of all municipal services, provision of portable water is perhaps the most vital. All people depend on water for drinking, cooking, washing, wastes disposal and other domestic needs. Water supply systems must meet requirements for public, commercial, and industrial activities. Provision of daily water needs is a burden on households with inadequate services in a number of ways, in addition to the direct health threats. Often, water has to be carried long distances to the house, which takes time and effort, a burden borne mainly by women and children. In urban and urban fringe areas, water is often only available from vendors at a price, which is usually several times more expensive than the water provided through formal services, and it is usually of poor-quality. Inadequate water supplies are both a cause and an effect of poverty [8].With the growing population of Kaduna metropolis, pressure on water supply is being mounted in some parts of Kaduna metropolis. The provision of water supply and sanitation services and their management facilities have not kept pace with the ever-increasing population. The remarkable population growth translates to ever-increasing pressure on water supply and sanitation services. Linkages between water supply and sanitation (WSS) and a cluster of key sectors, including health, education, agriculture, and environment are intuitively obvious, and documented with varying precision in different developing countries. Some of the data and project experience in Nigeria in these sectors suggest clear linkages between poor WSS standards and decline in health, education and productivity. Specifically, these include low enrolment in schools, particularly of girls who must spend time collecting water, higher crime against women due to lack of toilet privacy, as well as the more obvious impacts of disease, higher infant mortality, high absenteeism in schools and at work, and lower productivity.The demand for fresh water is fast increasing at a rate greater than the world’s population growth. We need water for food production, energy, industrial and domestic uses. The world is facing an increasing pressure from these demands, which is worsened by growing population [9]. Water scarcity affects more than 40% of people around the world, an alarming figure that is projected to increase with rise of global temperatures as a consequence of climate change. Although 2.1 billion people have gained access to improved water and sanitation since 1990, dwindling supplies of safe drinking water is a major problem impacting every continent [10].In 2011, forty-one countries experienced water stress; ten of them are close to depleting their supply of renewable freshwater and must now rely on non-convectional sources. Increasing drought and desertification is already exacerbating these trends. By 2050, it is projected that at least one in four people are likely to be affected by recurring water shortages [10].Over 630 million people in the world are still living without access to clean water. Around 2 million people in the world still required access to improved sanitation, especially girls and women who are the most vulnerable. And more than 840,000 people die each year from water-related disease. Almost 2 in 3 people who need safe drinking water survive on less than $2 a day. In many developing countries, millions of women spend several hours a day collecting water from distant, often polluted sources. Every minute a child dies of a water-related disease. Diarrhoea caused by inadequate drinking water, sanitation, and hand hygiene kills an estimated 842,000 people every year globally, or approximately 2,300 people per day. More than half of all primary schools in developing countries don’t have adequate water facilities and nearly two-third lack adequate sanitation [11]. Clean water is one aspect of improving sustainable food production in order to reduce poverty and hunger. More than 80% of sewage in developing countries is discharged untreated thereby polluting rivers, lakes and coastal areas.Nigerians are facing acute shortage of potable water in spite of claims by some state governments that funds are being allocated to solve the problem. Eliminating inequalities would help Nigeria out of poverty and achieve their full potential to live healthy and productive lives. Walking, queuing and carrying jerry cans in search of water is often a job that is not paid and not recognized, it wastes time and hinder productivity for many women and girls. 57.7 million Nigerians do not have access to safe drinking water, while thousands of children die every year from diarrhoea caused by unsafe water and poor sanitation. More than 130,000 Nigerians die of water-borne diseases, as a result of inadequate provision of safe drinking water and sanitation [9].In Kaduna State, the major water supply problems faced by the households include inadequate supply, distance to the source of water supply and irregularity in supply from the sources as well as water being supplied from various sources. The implication of this is that although the various sources of water supply in the study area include hand dug wells, boreholes, Kaduna State Water Board, water vendors and streams, differences in the sources vary significantly from area to area.The risk of various sanitation related infections and diseases are high due to the poor methods of solid waste disposal. The implication of the poor solid waste disposal methods by households is that; people who live close to waste dumps are exposed to various health risks such as malaria, bad odour, cholera, diarrhoea, hepatitis B and dysentery. It also causes serious environmental problems such as ground water pollution, poor environmental quality and aesthetics, and air pollution, as confirmed in a study carried in Ambo town, Ethiopia [8]. In the face of all of these, Kaduna state has no clear sector programme at state and local government levels, to generate data base systems for water supply and sanitation.The importance of water and sanitation to both urban and rural dwellers cannot be over emphasized. Access to water and sanitation are points of concern worldwide. Kaduna metropolis is an urban area full of socio-economic activities and needs economic transformation. This research is to evaluate access to water and sanitation in the study area. The study would be of benefit to the Kaduna State Water Board Management, as the findings would supply update information on access to water and sanitation from the selected areas. The community concerned would benefit because the result of the study would help to reveal the WSS needs of the area and this may facilitate the improvement of water quality by reducing pollution, eliminating waste dumping and minimizing release of hazardous chemicals and materials and thereby improve quality/standard of living in the area. The study would also provide reference material and extend the knowledge of water supply and sanitation in the study area.The research question that guided the study is; what is the water supply and sanitation situation in parts of Kaduna Metropolis?The term ‘water’ includes water required for domestic consumption and ‘sanitation’ refers to personal hygiene, disposal of human and animal excreta, liquid waste and household solid waste. The ‘situation’ has been used to reflect the present levels of demand and supply of water and sanitation in the household. The term ‘status’ is used to assess the adequacy and quality of water and sanitation services. It also accounts for trends related to services for demand and supply at the household.The researchable issues that follow from the research question are:1. Demand for water (purpose, seasonal variations, and notions of quality associated with the purpose for which water is required);2. Sources of water (different water sources, trends in water availability, relationship between sources and purpose for which water is required);3. Accessibility of water (social and economic accessibility to water);4. Adequacy of water (extent of demand-supply gap and its seasonal variations);5. Quality of water (notions of quality, levels of awareness on quality of water);6. Sanitation (sanitary practices of household, perception on hygiene and sanitation).The findings are to update information on access to water and sanitation in the study area and help to reveal the WSS needs of the area and facilitate the improvement of water quality by reducing pollution, eliminating waste dumping and minimizing release of hazardous chemicals and materials and thereby improve quality/standard of living in the area. The study focused principally on water for domestic consumption and sanitation related to personal hygiene, solid and liquid waste generated by households and inquiry selected areas based on the sampling plan of the study.
2. Materials and Methods
Research DesignA survey approach was adopted with a descriptive cross-sectional design, in addition to in-depth interviews and on-site observations. The purpose of this study was to assess the water supply and sanitation situation in selected areas of Kaduna Metropolis. The household interview consists of responding to a household questionnaire, an interviewer personal inspection of water and sanitation facilities, hand washing and hygiene behaviour of the respondents (preferably the adult responsible for water use in the house).Study PopulationThe population of Kaduna State according to 2006 census stands at 6,066,562. Kaduna metropolis is the capital city of Kaduna state. It is made up of two main Local Government Areas (LGA); Kaduna North, and Kaduna South, but also extends to Igabi and Chikun Local Government Areas (LGAs). The parts of Igabi that falls within the metropolis are; Rigasa, Rigachikun and Mando while Zokoriko, Kudende, Nassarawa, Gonin-Gora, Ungwan/Romi, Ugwan/Yelwa, Ugwan/Sunday, Kujama, Rido, Sabon Tasha, Ugwan/Boro, Narayi, Ungwan/Magero and Bayan Dutse are the parts of Chikun Local Government Areas (LGA) respectively. Kaduna state (Fig. 1) is located between latitude 9° and 11° North and longitude 7° and 9° East while the Metropolis is located between latitude 10° 28' and 10° 37' North and longitude 07° 19' and 07° 31' East. The Metropolis occupies an area of about 260km2; the distance between the eastern and western limit of the city is approximately 13.7km [12]. Kaduna North has an area of 72km2 and a population of 357,694 at the 2006 census, Kaduna South has an area of 59km2 and a population of 402,390, Igabi stands at 430,229 and Chikun stands at 368,250 [13].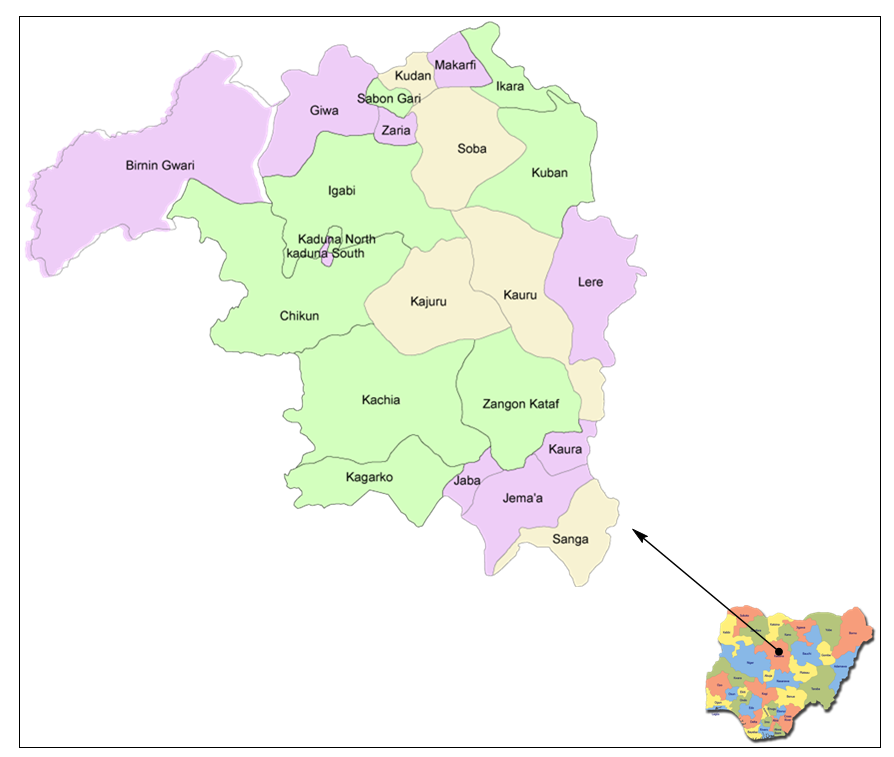 | Figure 1. Map of the study area showing the selected sampling site (Kaduna North, Kaduna South, Igabi and Chikun) in Kaduna metropolis |
Sample Size and Sampling TechniqueThe sample size was generated using the following formula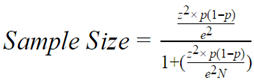 where z = standard normal score corresponding to 95% confidence level = 1.96; p = proportion of the population for the study area = [(6,066,562)-1] 1,558,563 = 0.2569; N = Universal population [total population of the coverage area] = 1,558,563; and e2 = Margin of error [square root of 2] = 5% (0.05). Substitution of the values in the equation for sample size produced n = 297. Households were selected using simple random sampling technique.Research InstrumentThe instruments for data collection include a survey questionnaire and observational checklist. The survey questionnaire was developed covering specific concerns on access to water, sanitation and hygiene facilities, including health and hygiene practices. These instruments were pre-tested in the selected areas of Kaduna Metropolis. Modification of the instrument was done based on the pre-test.Data NeededThe questionnaire was designed to solicit information on bio-data of the respondents on access to water supply, sanitation and hygiene facilities, including health and hygiene practices. On the questionnaire, section 1 consists of bio-data of the respondents (respondents profile), section 2 consists of 22 items inquiring about the household water supply and practices. Section 3 consists of 22 items inquiring about sanitation practices and section 4 consists of 13 items inquiring about the disease morbidity/mortality and management. While, section 5 consists of 4 items inquiring about hand washing practices and section 6 consists of 4 items inquiring about the hygiene messages and sources.Method of Data CollectionKaduna metropolis comprise of two main Local Government Area Councils; Kaduna North and Kaduna South. However, part of the metropolis extends to Chikun and Igabi Local Government Areas respectively. This study was conducted through an in-depth interview, administration of questionnaires and observational checklists. Households were randomly selected. Before the commencement of the survey, an informed consent was given to solicit for the respondent support and cooperation. One questionnaire was administered to each selected household to elicit basic demographic details, household water supply and practices, sanitation practices, disease morbidity/mortality and management, hand washing practices, hygiene messages and sources. An on-site observation was carried out which was recorded on the observational checklist. Information was obtained on the availability of water, hygiene and sanitary practices of households. No incentives were offered to respondents for participation in the survey.
3. Results
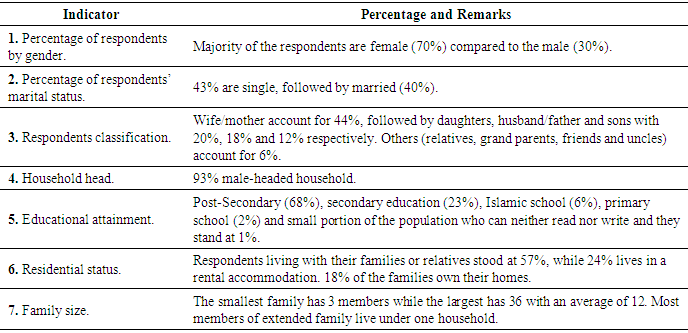
The Knowledge, Attitude and Practices (KAP) Survey covered 297 households in Kaduna Metropolis of Kaduna State in Northern part of Nigeria. The findings cover water, sanitation and hygiene including morbidity and mortality of diarrhoea and malaria and the demographic profile of the population.Demographic Profile of RespondentsThe basic profile of the respondents captured gender, marital status, age, household head, educational attainment, residential status and family size (Table 1). There were 297 household respondents interviewed from 8 communities representing 4 local governments in Kaduna Metropolis of Kaduna State in Northern part of Nigeria.Table 1. Demographic Profile of Respondents
 |
| |
|
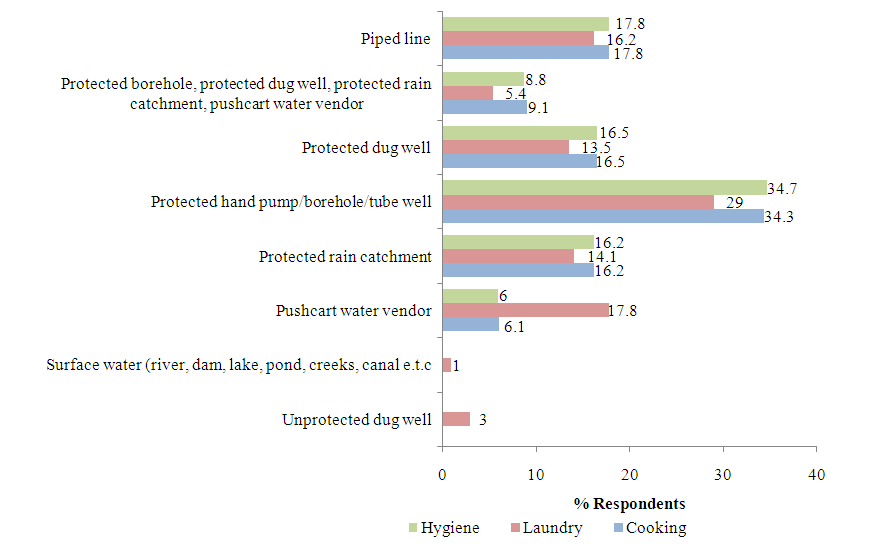
Household Water Supply & Practices This section presents water sources for drinking and other domestic uses, water collection, distance of water points, water containers, water treatment, water consumption and expenditures, and water point maintenance.  | Figure 2. Drinking Water Source |
 | Figure 3. Water Source for Domestic Use |
Table 2. Water Consumption, Maintenance of the Container and the Water Points
 |
| |
|
Sanitation PracticesThe sanitation practices surveyed are family latrine use, type of latrine, distance of latrine, reasons for not having latrines, baby’s faeces disposal and solid waste management.Diarrhoea Causes, Malaria Morbidity, Management and PreventionThis section discusses how the respondent population manages diarrhoea, what people perceive as the causes of diarrhoea and what they do to prevent diarrhoea occurrence, interpretation of malaria, age groups affected by malarial disease and people’s belief on the cause and prevention of this mosquito-transmitted disease.Table 3. Diarrhoea Causes, Malaria Morbidity, Management and Prevention
 |
| |
|
Hand Washing PracticesThis section presents practices on hand washing, agents used, reasons for not washing hand with soap and availability of hand washing facilities at home.Table 4. Hand Washing Practices
 |
| |
|
4. Discussion
The survey was conducted in the sampled areas in Kaduna metropolis of Kaduna State in the Northern part of Nigeria. It provides data on community access and practices related to water, sanitation and hygiene. A total of 297 households were interviewed. Households were selected randomly in Kaduna metropolis. During the survey, it was discovered that out of the 297 surveyed households in the study area, majority of the respondents were females (70%) compared to the males (30%) and most of the respondents at 43% are single, followed by married, 40%. Only a small fraction of the respondents were widows/widowers. Most household selected an educated person because they think they are the most suitable to answer the questions, and women were mostly the respondents during the survey. This may be because they are the once that stayed long at home because the men always go out to work. More than half of the respondents attained post-secondary school at 68%. The trend shows that only few people hold primary education. There are a substantial number of people who has secondary education (23%) which is followed by people that attained only Islamic schools and primary schools at 6% and 2% respectively. There is a small portion of the population who can neither read nor write and they stand at 1%. Access to WaterThe findings of the survey show that majority of households in the study areas have access to improved water facilities. Hand pump, privately owned boreholes and tube well are the major sources of water supply while dug well, Kaduna State Water Board (KSWB), pushcart water vendors and spring are other main sources of water for drinking. This simply implies that a large proportion of households in the sample areas get their water from protected sources. Water for domestic purposes (cooking, laundry and hygiene activities) is mainly from protected hand pump, borehole and tube well. Most of the respondents collect water from protected sources (piped line, protected dug well, protected rain catchment) for their domestic use. Usage of protected dug wells takes an average of while meagre draws water from unprotected hand dug wells. Some respondents collect rainwater during raining season from protected rain catchment area. Few people collect water from unprotected dug well and surface water for laundry use only. It was noted that not all the respondents that buy water do it on a regular basis but they do buy water if they feel that other sources of water supply are not enough or are not clean enough for consumption.It was observed that children have the biggest responsibility for collecting water for the households. The study found that boys, girls and in some households both boys and girls combined collect water for use. Boys are tasked ordinarily to collect water as against girls. Next in line are adult women (12.5%) with adult males having 10.4%. Only 6.7% of the households disclosed that water is delivered to them (Fig. 4). In some households that use boreholes and have water running in their taps, in most cases the boys are the once responsible for pumping water to the tank. These data support the gender debate that is seeking to create a balance in the responsibility for water collection for both females and males. The data is also a proxy to gender work load at community level. 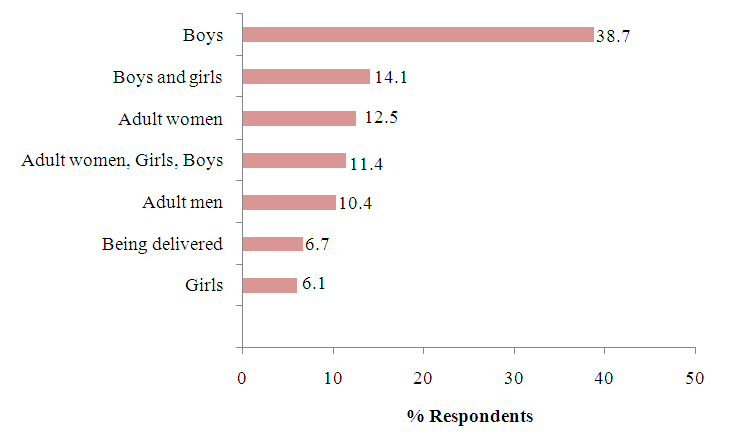 | Figure 4. Responsibility for Water Collection |
Given that water is quite close to majority of the respondents, most of the water sources are within 500-meter radius and respondents spend not more than 15 minutes for water collection. The time spent on water collection depends not only on distance but the queue and flow rate at water points. However, distance has been found to be a major indicator of time that respondents allot to collecting water from the water sources. A reasonable access according to [14] in the urban areas is a distance of not more than 200 meters from the house or a public stand post while in rural areas reasonable distance implies that the members of the household does not have to spend a disproportionate part of the day fetching water for the family’s needs. The World Bank classifies access of below 200meters as accessible while greater than 200 meters is regarded as inaccessible. From the study, it can be affirmed that majority (82%) of the respondents do not have access to potable water based on the [15] classification in terms of distance (Fig. 5a). The consequence of this is that a lot of time that should be used for other things are lost in the process of searching for water.The time spent for fetching water is calculated on the basis of both going to the water source and returning to the dwelling place. The long hours spent in collecting water have an impact on children and particularly the boys whose education suffers as a result. This affects them in various ways. They may get to school tired and are not able to concentrate fully in class. They may have limited time to have a recreation and only a little time to enjoy as free time. Jerry cans and buckets are the common containers for water collection. Though water collected through the use of the bucket is at a high risk of contamination when not properly taken care of, because of its wide mouth. At least 32% of the population stored water inside drum/barrel, and some used jerry cans, while others stored in bottles for easy storage inside the refrigerators (Figure 5e). 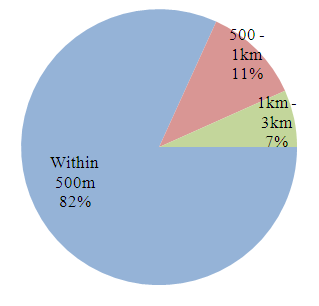 | Figure 5a. Distance of water source |
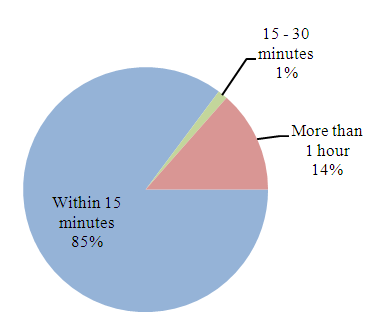 | Figure 5b. Time Spent in Collecting Water |
 | Figure 5c. Water Treatment |
 | Figure 5d. Water Treatment Type |
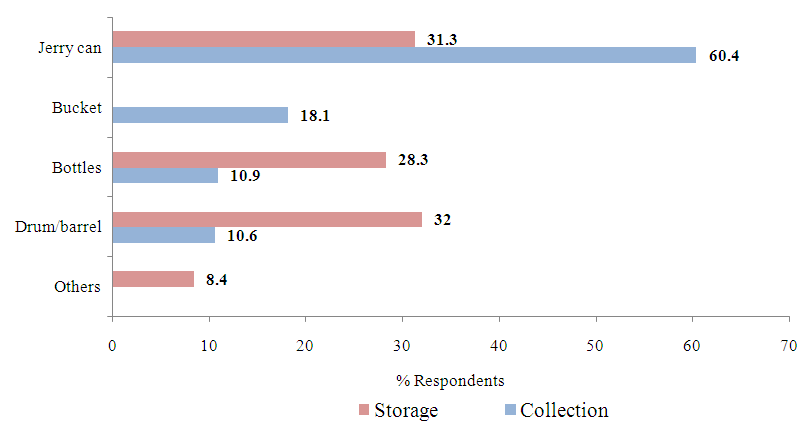 | Figure 5e. Water Collection and Storage Container |
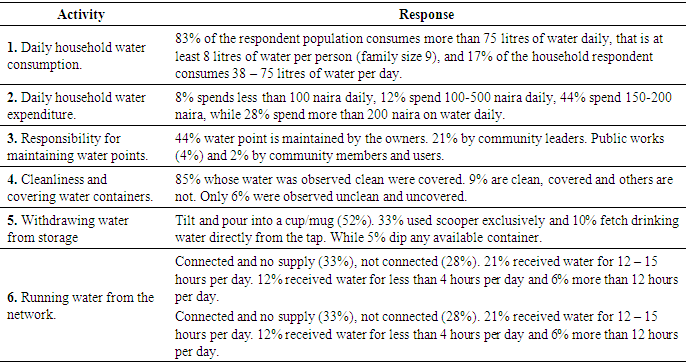
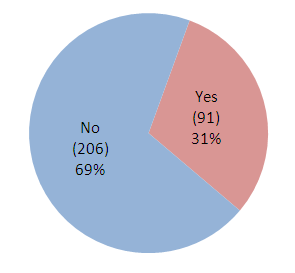
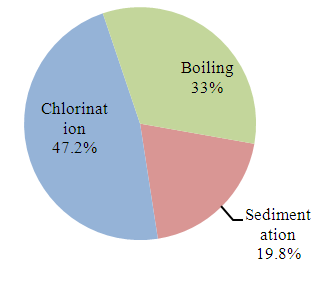
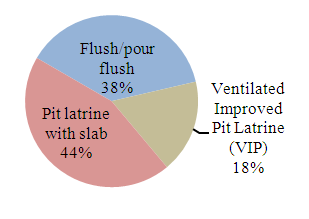
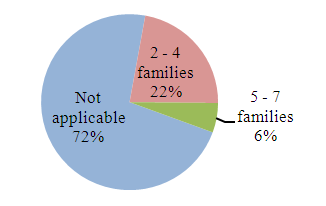
A majority representing 69% does not treat their drinking water (Figure 5c). For the remaining 31%, chlorination (47%) is the most common method of treatment (Fig. 5d). Most of the population that does not treat their water believes that water is safe for consumption and for domestic use. Other reasons are that water treatment is expensive and some respondents do not know how to treat water. Only little of them believe that water is safe because they are already used to it. The implication of higher percentage of residents not treating water before use is that they are prone to water-borne diseases like typhoid, cholera and dysentery. This is in support [16] that the 2010 outbreak of cholera and gastroenteritis in some states in Nigeria was attributed to rain which washed sewage into open wells and ponds, where people obtain water for drinking and household needs.More than three quarter of the population consumes more than 75 litres of water per family per day, that is at least 8 litres of water per person for family size 9. 73% of the households pay for their water, with 8% spending less than 100 naira daily, while the rest spends up to 200 naira or more per day. On the other hand, the 27% privately owned boreholes, used dug well, fetches from neighbours or community stand pipe.Almost half of the water points are maintained by the owners (44%). Others are managed by community leaders representing 21% and public works (4%). Community members and users were not frequently mentioned during the survey (2%) (Table 2).Covering and cleaning of water containers are consistently practiced. Based on observation, there were a high proportion of households whose water was observed clean and covered (85%). Tilting and pouring water into a cup (52%) was the main practice of drawing drinking water (Table 2). Among the 297 surveyed households only 53 households mentioned that they were connected to piped line water from water board. There was no supply for 33% of the population; the remaining 67% have access to running water for less than 4 hours per day and some 12-15 hours per day or more.Sanitation PracticesMajority (90%) of the households in urban and urban slums have access to improved sanitation facilities (Fig 6a). Majority of these facilities (75%) were constructed by individuals. Almost half of the facilities (44%) are classified as pit latrine with slab while other types include flush/pour flash (38%) and ventilated improved pit latrine (VIP) (18%) (Figure 6b). Many households share latrines (Figure 6c). For those who have no latrines, the most common methods for defecation include the use of public latrine. Most households (58%) were unable to reveal the reason why they do not own family latrines, while the remaining 42% says that it is expensive to have family latrines.Baby’s faeces are mainly thrown into the toilet (72%) (Fig. 6d), others thrown into garbage pit (22%) and 6% thrown in the bush. Households’ wastes are generally thrown in a waste bin and sac, before it was disposed to the public disposal area (80%) (Fig. 6e) and some disposed to waste burning area (19%).Lack of proper waste disposal system in the study areas leaves the inhabitants with no choice than to dispose both their solid and liquid waste either into water channels or open spaces indiscriminately. Dumping of refuse into water bodies contaminate the water making it unsafe for human consumption while dumping in open spaces leaves the environment very untidy. Others that disposed waste in water bodies blocks the channels giving rise to flooding and stagnant water arising from this becomes the harbour for breeding mosquitoes. Among the surveyed households only 26% rear animals/poultry (Fig. 6f). Most of the population (61%) sweep the animals/poultry excreta once daily (Fig. 6g), others sweep twice daily and some twice a week. Half of the respondents disposed animal/poultry excreta in public disposal area (50%). 30% of the respondents use it in the farm as fertilizer, while others throw it in garbage pit or bury. 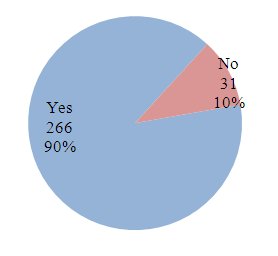 | Figure 6a. Access to Family Latrines |
 | Figure 6b. Types of Latrine |
 | Figure 6c. Proportion of respondents that Shared Latrine |
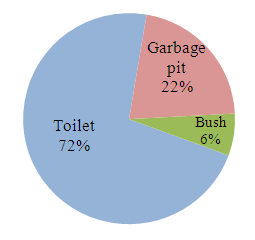 | Figure 6d. Disposal of Baby's Faeces |
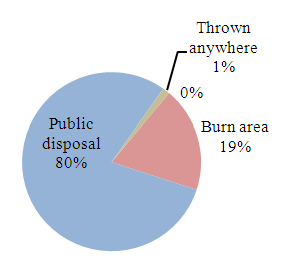 | Figure 6e. Household Waste Disposal |
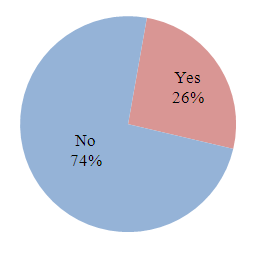 | Figure 6f. Rearing of Animals or Poultry |
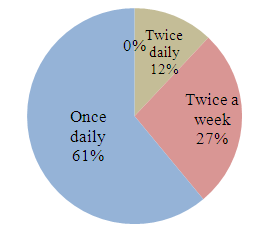 | Figure 6g. Sweeping of Animal/poultry excreta |
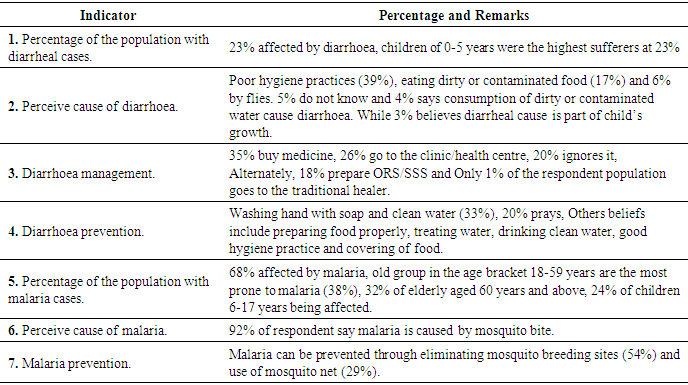
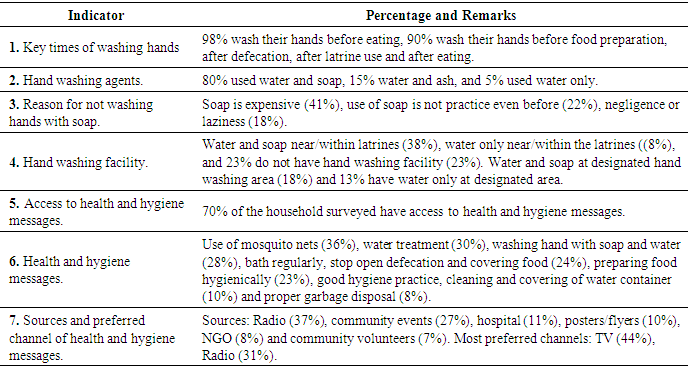
Diarrhoea Morbidity and MortalityDiarrheal cases were reported by 23% of the surveyed households, affecting mostly children between 0-17 years (44%) and this weakens their potential to reach a healthy adult age. There were low cases of diarrhoea in families with improved sanitation facilities (90%) compared to those with unimproved sanitation facilities (10%). Among the 62 population who had diarrhoea, 11 people were reportedly dead. Respondents believe that the causes of diarrhoea include poor hygiene practices (39%). Followed by eating of dirty or contaminated food (17%). Only 6% says diarrhoea is caused by flies. 5% do not know what exactly causes diarrhoea and 4% says consumption of dirty or contaminated water cause diarrhoea. While 3% believes diarrheal is part of child’s growth. Most people suffering diarrhoea is because most pipes are often laid in drainages and whenever there is a leakage on those pipes most people tend to consume contaminated water and this may give rise to an outbreak of cholera and diarrhoea.The most common practice of managing diarrhoea is to buy medicine (35%) and 26% go to the clinic/health centre if diarrhoea persisted. While 20% ignores in the hope that it will stop without taking any medication. Alternately, people also prepare ORS/SSS for the family member having diarrhoea. Only 1% of the respondent population goes to the traditional healer. They believe that diarrhoea can be prevented through washing hand with soap and clean water (33%). 20% believes that with prayers they cannot be affected by diarrhoea. Other beliefs include preparing food properly (10%), treating water (9%), and drinking clean water (5%). Few people (4%) say that they do not know how to prevent diarrhoea disease. Only 3% believed that good hygiene practice and covering of food (1%) prevent one from diarrhoea disease. The study revealed that protected water sources have less cases compared to unprotected water facilities.Malaria Morbidity and MortalityMalaria was included in the study because of its high prevalence in Nigeria, which affects every section of the population, though it is not necessarily directly related to water, sanitation and hygiene promotion. It has a co-relationship between the presence of water and seasonal changes. Young children who have malaria are prone to nutritional deficiencies. Diarrheal disease can also complicate malaria, thus putting all sufferers of malaria at a much higher risk than perceived.There was a high prevalence of malaria among households, as 68% of all households surveyed reported cases of malaria. However, the cases reported were clinically diagnosed. Malaria affects people across all ages, with 38% of old group in the age bracket 18-59 years being the most prone to malaria as indicated in (Table 3), with 38% of the cases, followed closely by elderly aged (60 years and above) (32%). 24% affected by malaria are children aged 6-17 years and the least affected by malaria are young children aged 0-5 years. There were 31 reported cases of malaria mortality with adult 18-59 years (4 out of 31 adult) representing 12.9%. The remaining 87.1% were unable to reveal those that were dead due to malaria.Most respondents believe that the main cause of malaria is mosquito bites which account for 91.6%. Respondents believe that malaria can be prevented by eliminating mosquitoes breeding site (58.5%), use of mosquito net (33.1%) and proper hygiene (8.5%).Handwashing PracticeThe most frequent key times of washing hand as mentioned by the respondents include; before and after eating, after defecation, after latrine use, before food preparation and post cleaning time which account for 90.2%. Other important critical times with very low ratings include washing hand after handling rubbish, after handling baby faeces and before feeding children (8.4%), while few (1.3%) of the respondents mentioned that they only wash hand before eating (Table 4).Hand washing with soap and water was widely practiced as claimed by 80% of the respondents, though there is considerable number of people that wash hand with water and ash (15%). Hand washing with water only was practiced by 5.9%. For the 5% of the respondents that do not wash hands with soap, they stated that soap is expensive (41%). There are those that do not wash hand with soap because it has never been their habit and practice (22%), while others say negligence or laziness stopped them from washing hands with soap (18%) and 19% gave other reasons (Table 4).Based on the observations shown in (Table 4), the study reveals that 38% of the household have water and soap near/within the latrine. 23% do not have visible hand washing facility. There were 18% of the respondents who keep water and soap at a designated hand washing area, while 13% keeps water only. Only 8% was observed to have kept water only near/within the latrine.The study does not conduct full time observation of the hand washing practice. The survey therefore uses proxy indicators such as the presence of water and soap near or within the latrine vicinity and presence of water and soap at the designated household hand washing area for people washing hands after latrine to test the practice. At least 5% of the household does not wash hands with soap after latrine use.Unlike in camp settings, where one can easily observe people using latrines, it is rather difficult in community settings to do so. For protection and privacy issues, observation of respondents using latrines and washing their hands after use was not carried out.Health and Hygiene MessagesRespondents were asked if they heard messages in the last three months before the survey was conducted. Among the 297 surveyed household, 70% had access to health and hygiene messages as indicated in Figure 4.48, with 30% stating that they do not have access. Figure 4.49 displays a wide array of health and hygiene messages that respondents recalled from the last three months before the survey. No single message dominates the graph. Use of mosquito nets messages leads the trail with 36%, followed by water treatment with 30% and washing hands with water and soap standing at 28%. Other frequently mentioned messages include messages about bathing regularly; stopping open defecation and covering of food which accounts for 24% and this is closely tailed by preparing food hygienically (23%). Other messages that were mentioned include, practicing of good hygiene (10%), cleaning and covering of water containers (10%) and proper disposal of garbage (8%).Radio turns out to be the number one source for passing messages to respondents (37%). Followed by community events (27%) and clinic and hospital (11%). 10% frequently stated posters, clinics, radio, TV and SMS/Phone. While 8% mentioned NGO and community health volunteers (7%).Respondents were also asked about their most preferred channels to receive hygiene messages. Table 4 highlights the popular responses indicating TV (44%) as most preferred followed by radio (31%). Though mentioned with lower percentage, some channels that could be explored in the future are, distribution of flyers, use of brochures and printed materials (10%), house visit (7%), announcement in schools and hospital (4%), and some preferred that hygiene messages should be passed through mosques and churches (4%) since they are places where most people go to worship.
5. Conclusions
Both urban and rural dwellers in Kaduna metropolis obtain water from protected drinking water sources such as hand pump, borehole and tube well. The second leading source of drinking water is piped line. Some fetch their drinking water from protected dug well. While some buy their drinking water from pushcart water vendors others prefer bottled or sachet water. This survey has revealed that many of the sampled respondents in the study area do not have access to potable water supply in terms of distance, based on the World Bank classification of access of below 200-meters as accessible while greater than 200 meters is regarded as inaccessible. Most of the water sources are within 500-meter radius although majority of the respondents spend not more than 15 minutes for water collection. 90% of the households in urban and urban slums have access to improved sanitation facilities. Majority of the facilities were constructed by individuals. There were low cases of diarrhoea in families with improved sanitation facilities compared to those with unimproved sanitation facilities. There was a high prevalence (68%) of malaria among the surveyed households, as majority of all households surveyed reported cases of malaria.
6. Recommendations
Based on the findings of this research, the following are therefore recommended:i. There should be constant monitoring of the rate of population growth so as to enable the government to be able to plan ahead in order not to face problems relating to water supply and sanitation as a result of rapid urbanization.ii. Government agencies responsible for the provision of water supply and sanitation facilities should be adequately funded and equipped to carry out their services to the community. iii. Proper maintenance of equipment at the water works should always be carried out. iv. Private sector should be involved in water supply in the areas of fund mobilization for the construction, maintenance, rehabilitation and expansion of water supply and sanitation facilities in Kaduna metropolis.v. Boreholes should be drilled in areas that do not have enough water for consumption, and proper survey should be carried out to ensure that the areas chosen for drilling of the boreholes are suitable so that the problem of low yield will not arise.vi. The communities need to be enlightened on the dangers of poor sanitation in their neighbourhood. vii. Women should be empowered to act as trainees on health issues.viii. Media should be used in sending educative messages to people.ix. There should be awareness campaigns regarding health issues related to water and sanitation.
References
| [1] | SDG (2016) Sustainable Development Goals, 2016. |
| [2] | WHO/UNICEF Joint Monitoring Programme: wat/san categories 2015. |
| [3] | International Telecommunication Union (ITU), 2015. The World in 2015 ICT Facts and Figures. |
| [4] | Lockwood and Smits, (2011). Supporting rural water Supply. Moving towards a Service Delivery Approach. |
| [5] | World Health Organization (WHO) and UNICEF Joint Monitoring Programme (JMP), 2015. Progress on Drinking Water and Sanitation, 2015 Update and MDG Assessment⋅ |
| [6] | World Economic Forum, 2015. Global Risks 2015 Report. |
| [7] | UNICEF and WHO, (2012). Progress on drinking water and sanitation: 2012 update. |
| [8] | Shanmugham, S, Solomon, B.T. (2011). An assessment on the status of water supply and sanitation in Ethiopia: A case of Ambo town. Journal for Sustainable Development in Africa 13(1): 23-43. |
| [9] | Ajide Felix, Nan, April 11, 2016. “Nigerians groan under hardship of acute water shortage." |
| [10] | United Nations Development Programme, 2016. |
| [11] | Burgers, Lizette. “Background and Rationale for School Sanitation and Hygiene Education. “UNICEF. May 2, 2015. |
| [12] | Ajibuah, J.B (2008). Ethno-Religious conflict and Residential Segregation in Kaduna Metropolis. |
| [13] | “Post Offices-with map of LGA”. NIPOST. Retrieved 2009-10-20. |
| [14] | WHO/UNICEF Joint Monitoring Programme (JMP) (2010) for Water supply and Sanitation, retrieved on April 12, 2012. |
| [15] | World Bank: New Project to Bring Clean Water to 50,000 Households, 22nd April, 2010. |
| [16] | Adagbada, O. A, Adesida, S.A, Nwaokorie, F.O., Niemogha, M.T, Coker, A.O (2012). Cholera Epidemiology in Nigeria: an overview. The Pan African Medical Journal. 12:59. |

 Abstract
 Reference
 Full-Text PDF
 Full-text HTML