Victor B. Olaseni , Yemi S. Onifade
Department of Physics, Federal University of Petroleum Resources Effurun, Effurun Delta State, Nigeria
Correspondence to: Victor B. Olaseni , Department of Physics, Federal University of Petroleum Resources Effurun, Effurun Delta State, Nigeria.
| Email: |  |
Copyright © 2020 The Author(s). Published by Scientific & Academic Publishing.
This work is licensed under the Creative Commons Attribution International License (CC BY).
http://creativecommons.org/licenses/by/4.0/

Abstract
Two methods were used to investigate the presence of contaminants plume around a central pit latrine system in Ugbomro Community in Effurun-Warri city, Delta state and the two methods employed in the study area were geoelectrical method (using 2 Dimensional electrical resistivity surveys) and physiochemical method. Four traverses with lateral distance of 30m were acquired on the field with 2m electrode spacing, the Vertical electrical sounding (VES) was also employed in the study area so as to determine the geoelectric section and depth of aquifer level around the latrine system. The geophysical investigation was carried out using Wenner array configuration i.e. Omega 1000 terrameter, while DiproWin Inversion software was used for processing the four traverses that were covered so as to delineate the plume and probable trend of migration of leachate in the study area. The physiochemical analysis was carried out on water samples collected within the study area. The 2-D inversion model for traverse 1 revealed that the zone with low resistivity value of 31Ωm was indicated in the topsoil which falls within the lateral distance of 16m to 20m at a depth of 4m. The map of traverse 2 indicated low resistivity of 56Ωm at the lateral distance between 2m and 7m at the depth of 5m. Also, the top soil of traverses 3 and 4 indicated low resistivity value of 30 Ωm and 26 Ωm respectively which occurred between the lateral distances of 8m and 13m and 16 m and 28 m respectively at the depth of 2m. These low resistivities are suspected to be leachate saturation that leaked from the central pit latrine system. The study also revealed that other physiochemical analysis which includes pH, Electrical Conductivity, Total Suspended Solid (TSS) and heavy metals lie within standard value of World Health Organization. The Vertical Electrical Sounding results showed that the depth of aquifer in the study area is in third layer which is the fine sand layer at the depth of 16.5m. Therefore, the study showed that leachate exists in all traverses at the top soil layer which is not deeper than 5m to the subsurface; hence, the results of both physiochemical, VES and geoelectrical investigations indicated that leachates has not yet pose any threat to the quality of the subsurface groundwater (Aquifer). However, it is recommended that a periodic geophysical investigation should be carried out in the study area at a later time.
Keywords:
Wenner array, Pit latrine system, Leachate, Aquifer, 2 Dimensional, VES
Cite this paper: Victor B. Olaseni , Yemi S. Onifade , A Combined Approach for the Mapping of Contaminants Plume Around a Central Pit Latrine System in Ugbomro Community, South-South Nigeria, Public Health Research, Vol. 10 No. 2, 2020, pp. 71-77. doi: 10.5923/j.phr.20201002.05.
1. Introduction
Water is well-thought-out as one of the most vital natural resources to man because of all its essential uses to human. Since water is life and it ensures healthy living but due to the urbanization and industrialization of the society, the only safe haven which is ground water has been gradually polluted over the years due to many sources of contamination [1]. Contaminants formation formed when the percolation water liquefies the resolvable components out of the material and this is usually seriously contaminated and comprises of complex waste water that is very difficult to deal with [2].Research found out that less than 30% of Nigerian cities are aided by communal water schemes. This fact remains true and is evident in Effurun-Warri and its environs where private wells and boreholes ownership are common. The ongoing rapid urbanization and industrial development in Effurun-Warri town and its environs has led to the increase in the production of domestic and industrialized wastes, and this has enhanced the pollutant concentrations by leaking from the buried reservoir into the subsurface-groundwater resources. Therefore, periodic examination to ascertain the quality of the groundwater is indispensable. The fact that most of the water consumed does not undergo treatment by the controlled body, this now makes it pertinent to regularly conduct and monitor geo-physical, electrical, chemical and biological analysis. However, the possibility of ground water contamination by pit latrine system is supreme where the latrine system is very old (minimum of 20years) and not properly maintained regularly, also in areas where the bedrock is cover by little or no soil [4]. A pit latrine system is intentionally made to treat human waste and a well-functioning system reduces organic matter, microbes, and most cations. Subsurface sewage disposal system is one of the major sources and most frequently reported reasons of ground water contamination [5]. Once underground water is contaminated, it is very difficult, time consuming and expensive to clean up and the time and cost of clean-up depends on the extent of contamination even a small amount of contamination can be costly to clean up. [6] used 2 Dimensional imaging and physiochemical analysis to map contaminant plume around a septic tank within the staff quarters in University of Benin, Nigeria. From the research he found out that there was strong evidence of topsoil contamination in traverses 1, 2 and 4 and this constitutes the contaminated shallow water zone and this low resistivity zone, occasioned by the suspected infiltration of contaminants from the old septic tank. This pollution can be in the form of solid waste or in the liquid or gaseous forms. The most common is the liquid that can easily penetrate or permeate the solid; it flows down into the aquifer system [7]. Also, from the research there is low pH values of water samples collected within the study and it falls between 5.62-5.84; which is below 6.5-8.5 as recommended by WHO and this shows a clear evidence of water pollution [8].In this regard the effects of leaking septic tanks on quality of groundwater in Effurun-Warri Municipal is necessary since it is sitting on a highly porous and permeable geologic setting with the highest transmissivity coefficient. It is necessary to investigate this anomaly by employing some geoelectrical, physio-chemical analysis and vertical electrical sounding to ascertain the geo-electric sections of the rock units. This will give insight of the effects of leaking septic tanks within the Municipal which is the purpose of this study. That is why a combined geophysical and physiochemical approach is needed to study the central pit latrine system of Ugbomro community that has not been properly maintained with the aim to investigate the impact of leachate effluent from the latrine system on groundwater quality (see figure 1).
1.1. Statement of Problem
To know if the study area has been contaminated due to the infiltration of the leachate plume from the pit latrine system and to know the extent of the suspected contaminant plume that leaked from the latrine system to the subsurface.
1.2. Aim and Objectives
The aim of this study is to map out contaminant plume around a central old pit latrine system in Ugbomro community.The objectives of this research are to;- Acquire data using the 2D electrical resistivity imaging.- Use the required geographical inversion software for processing of data acquired so as to delineate the plume and probable the trend of migration.- Carry out physicochemical analysis of water sample collected in the study area and compare it with the WHO standard.- know the depth of aquifer in the study area using vertical electrical sounding (VES)- Identify the extent of contaminant to as to ascertain the possible threat in study area.
1.3. Study Area
The research work was conducted around a large central pit latrine system in Ugbomro Community, Uvwie local government, Effurun Delta state as shown figure 1. It was found out during reconnaissance survey that the pit latrine system in the community is above 30 years of existence without proper maintenance. The geological area is basically a sedimentary area located in South-South geo-political zone of Nigeria and it is bounded by longitude N005° 50’ 34.1” and latitude E005° 50’ 0.33” and is about 6m above sea level. The Niger Delta extends from longitude 3.5E to 8.45E and latitude 4.5N to 5.65N and covers an area of approximately 36,260km and is third largest Delta in the world. The sampling sites were identified as with coordinates of longitude N05°34’10.1’’ and latitude: E005°50’04.0’’ and elevation of 22.97 ft.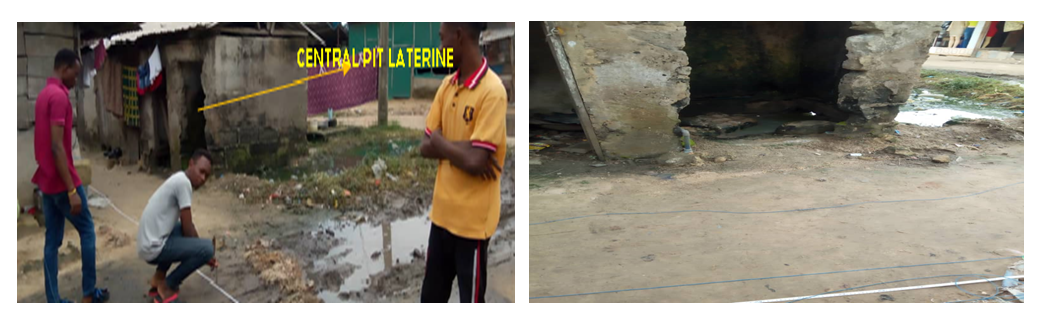 | Figure 1(a,b). (a)Area of study showing personnel during acquisition of data around the central pit latrine (b) one of the entrance to the pit laterine system |
2. Mathematical Theory
The basic and fundamental equation for resistivity survey is derived from Ohms law as shown in figure 2 which states that when a current I flows through a conducting body, it sets up a potential difference V between the two ends of the body, equation 1 shows the relationship between the current and the potential difference [3] | (1) |
Where I is current and V is the potential difference Removing proportionality sign, | (2) |
The value of this constant is a measure of the opposition (resistance) the conductor offers to the flow of current, Where the unit of I is in amperes and V is in volts, R is in ohms (Ω). The figure 2 shows the four electrode spread consisting of two current electrodes and two potential electrodes. 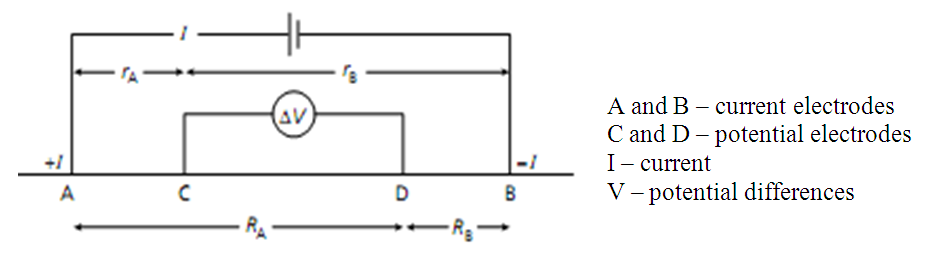 | Figure 2. Generalized form of the Electrode Configuration Used in Resistivity Measurement [3] |
However, the Resistance (R) is proportional to length (L) divided by area (A) (i.e. in equation 3). | (3) |
Removing proportionality sign in equation 3, | (4) |
Where:  is the resistivity and the unit is in ohm-meter (Ωm)
 is the length of wire in meter
 is the cross sectional area of the wire
 is the resistance in ohmThe conductivity, σ, is defined as
 | (5) |
Unit of conductivity is siemens / meter  Using the above relationship,
 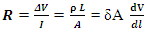 | (6) |
 | (7) |
The equation 7 is the equation for finding the resistivity of a homogenous isotropic medium, provided the geometry is simple such as cube, cylinder, and parallel pipe among others. | (8) |
Where  is current density that is in vector equivalent, ohms law defined as:
 | (9) |
Where  is the electric field [3].In order to derive a ground apparent resistivity
  in terms of geometric factor
  from figure 2, the current electrode A and B act as source and sink respectively. At the detection electrode C the potential due to the source A is
  while the potential due to the sink at C is
  is giving the combined potential as:
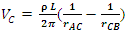 | (10) |
In the same way the potential at D is: 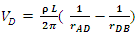 | (11) |
Thus the potential difference measured between C and D is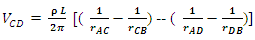 | (12) |
The ground apparent resistivity  can be expanded as
 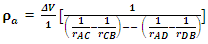 | (13) |
 | (14) |
From equation 14, Where  and
and  is a geometric factor and is dependent upon the spatial arrangement of electrodes for specific arrays.However, apparent resistivity can be defined as a bulk average resistivity of all soils and rock influencing the current. It is calculated by dividing the measured potential difference by the input current and multiplying by the geometric factor specific to the array being used and electrode spacing.
3. Methodology
3.1. Data Acquisition
The 2 Dimensional data were acquired from the study area using Omega 1000 terrameter with the Wenner array configuration. Vertical electrical sounding (VES) was carried out in the study using Schlumberger configuration so as to determine the depth of aquifer and probably geoelectric section around the latrine system. The thickness and depth of aquifer inferred from VES were used to know the suspected lithology. The 2-D data with four profiles lines were acquired with 15 electrodes separated by 2m interval with a maximum spread of 30 m.
3.2. Data Processing
DiproWin Inversion software was used as iteration software for processing and inverting the 2 Dimensional data acquired; the software was used in order to ascertain the areas of anomalies (concentrations) and also to delineate the extent of leachate plume. The VES was plotted on bi log graph and resistivity model curve (master curve) and later used WINRES software for iteration processing, so as to delineate the number of layers, resistivity, geo-electric section and aquifer zone.
3.3. Collection of Water Samples for Physiochemical Analysis
Water samples were collected from the borehole that is less than 10m to the study area using a rinsed plastic bottle and stored in a cool environment before analyzing them in laboratory. The following parameters were determined from the physiochemical analysis of the water sample collected using conductivity meter and pH meter. The physical parameters are pH, Total Dissolved Solid (TDS), Electrical Conductivity (EC), Chemical Oxygen Demand (COD), hardness of water, heavy metals and Dissolved Oxygen.
4. Discussion of Results
4.1. Results for 2-D Electrical Resistivity and VES
After data acquired from the field has been processed and inverted using DiproWin Inversion software, maps in figure 3 to 6 were generated. 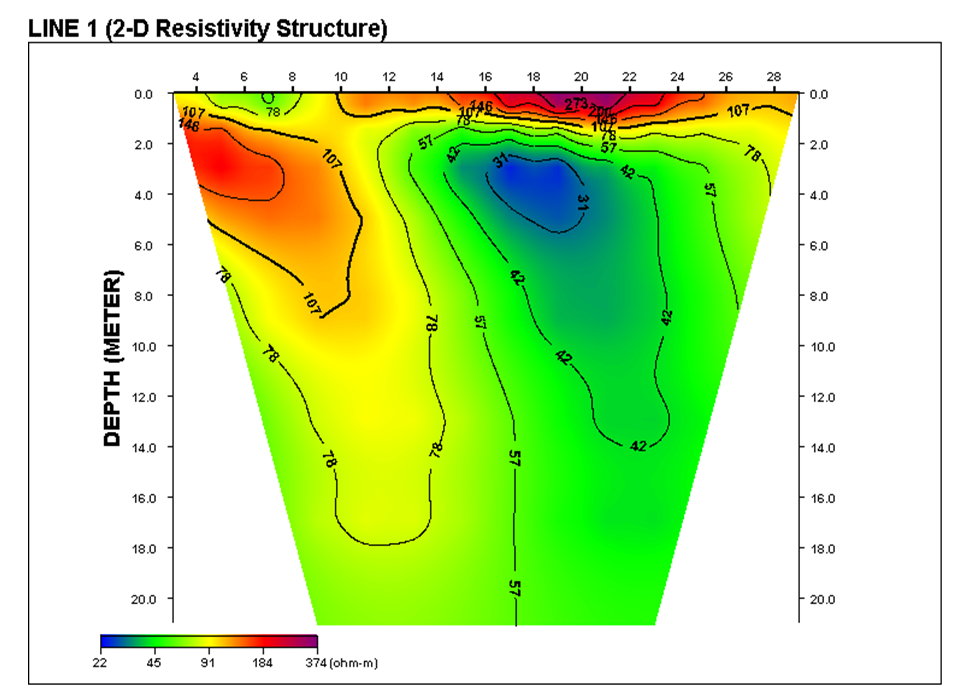 | Figure 3. 2-D Electrical Resistivity Image of Traverse 1 |
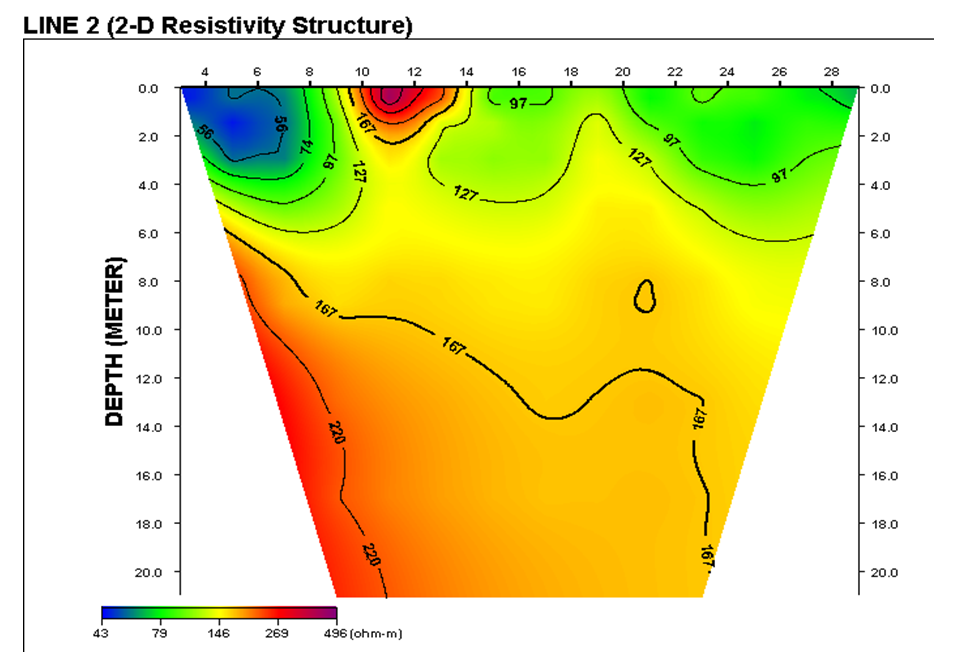 | Figure 4. 2-D Electrical Resistivity Image of Traverse 2 |
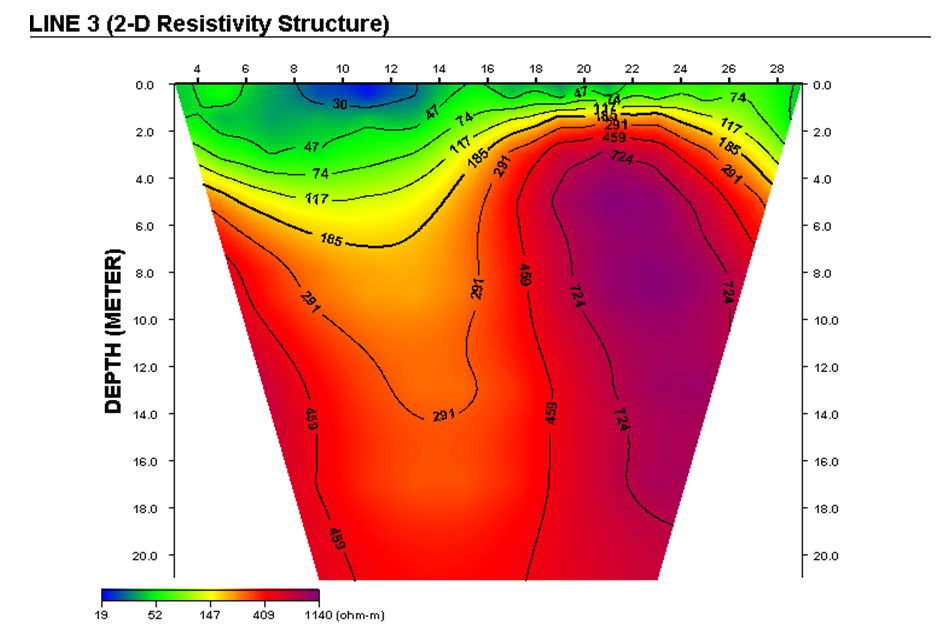 | Figure 5. 2-D Electrical Resistivity Image of Traverse 3 |
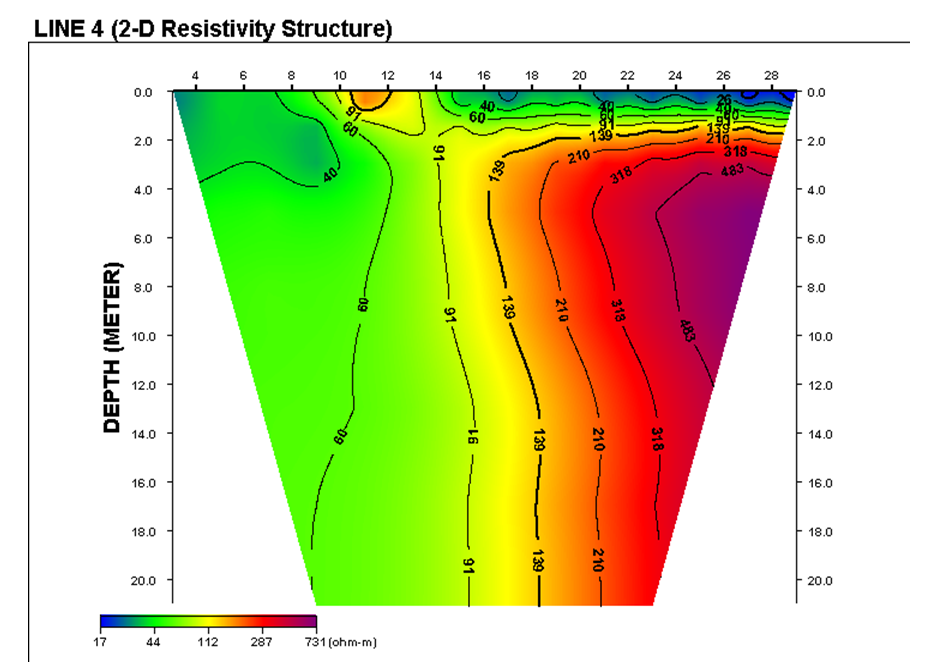 | Figure 6. 2-D Electrical Resistivity Image of Traverse 4 |
4.1.1. Maps of 2-Dimensional Electrical Imaging of Traverse 1 to 4
Figures 3 to 6 show the maps of the true resistivity structure of the subsurface in the study area. These maps are displayed as cross sections of the true resistivity distribution of the subsurface with depth along each of the sections.
4.1.2. Discussion of 2-Dimensional Electrical Imaging of Traverse 1 to 4
2-Dimensional resistivity section was conducted around a central pit latrine system in Ugbomro community. The Figures 3 to 6 show the maps of the four traverses that were conducted around the pit latrine area with a maximum lateral spread and depth of 30m and 25 m respectively. The lateral distance is represented by the horizontal scale on the section while the depth to the subsurface in meters is represented by the vertical scale. The legend at the bottom of each map shows the resistivity value of all the colors in the resistivity structure and the resistivity structure of each map shows some low resistivity layers along each profile. From the figure 3 which is the first traverse, the inversion model shows low resistivity value (bluish region) of 31 Ω m along the lateral distances between 16m to 20m at a depth of 4m to the subsurface. The image of traverse 2 in figure 4 indicate low resistivity value of 56Ωm at the lateral distance between 2m and 7m and at the depth of 5m. Also, in figure 5 the horizontal distance between 8m and 13m of traverses 3 also indicates low resistivity value of 30 Ω m while the traverse 4 in figure 6 displays its own low resistivity value of 26 Ω m at the lateral distances between 16 m and 28 m. The low resistivity values of both traverse 3 and 4 occur at the same depth of less than 2m to the subsurface. All these low resistivities values are suspected to be leachate saturation that leaks from the old central pit latrine system.
4.2. Map and Discussion of Vertical Electrical Sounding (VES) in Study Area
The Vertical Electrical Sounding was also conducted in the study area so as to determine the geoelectric section and depth of aquifer level around the latrine system. This is necessary for us to know if the leachate plume that leaks from the pit latrine system has reached the aquifer level.The map of the Vertical Electrical Sounding in figure 7 shows an HQ type curve (P1>p2>p3<p4) with resistivity varying from 3070.7 to 3301.8
 and thickness ranging from 1.6m to 10.2m showing a four layer-earth. The four (4) lithology layers of this study area are top soil, sand, fine sand and clay and the aquifer is located in the third layer which is the fine sand layer at the depth of 16.5m.
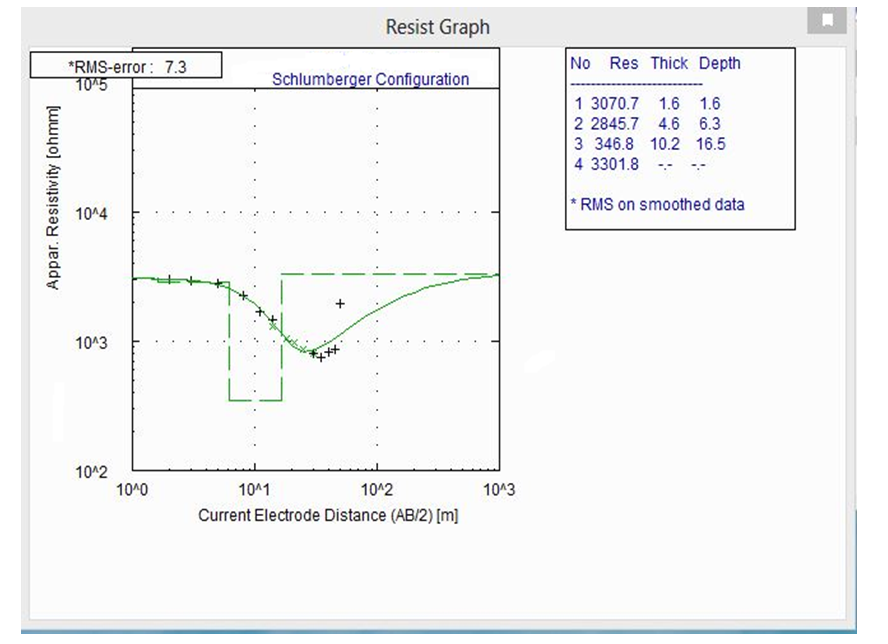 | Figure 7. VES Curves showing the Depth and Geoelectric session of the study area |
4.3. Discussion of the Results of Physiochemical Analysis of Water Sample in the Study Area
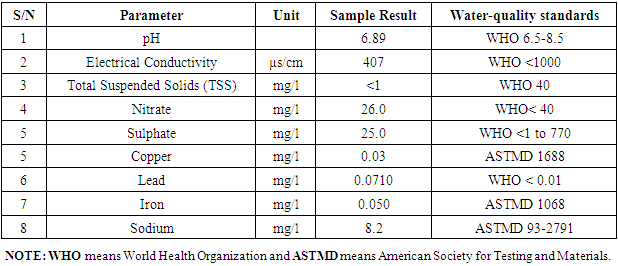
The quality and progress of underground water contamination can be monitored through physiochemical parameter such as pH, electrical conductivity, total suspended solids, etc. The table 1 below shows the result of water samples collected from the borehole located within the study area.Table 1. Physiochemical analysis of the water Samples
 |
| |
|
4.3.1. Discussion of the Results of Physiochemical Parameters
pH can be defined as the measure of the intensity of acidity or alkalinity and the concentration of hydrogen ion in water. From table 1, the pH value of the water sample collected is 6.89 and this implies that the value is within the limit recommended by the WHO as shown in the table 1. Also, as shown in table 1 above, all the results of other physiochemical analysis which includes Electrical Conductivity, Total Suspended Solid (TSS), and heavy metals lie within the water quality standard as recommended by WHO and ASTMD. This implies that the groundwater in the study area is not contaminated.
5. Conclusions
The 2-Dimensional resistivity structure has provided adequate resistivity information on both vertical and lateral view in the study area and its consequences. The inversion model in all traverses has revealed that the top soil of the study area has low resistivity values that are less than 50 Ωm, which denoted that a decomposed organic materials known as leachate plume can be found at the depth that is less than 5m to the subsurface. Whereas the depth of aquifer in the study area is 16.5 m as revealed by Vertical Electrical Sounding (VES) and this can be found in third layer which is the fine sand. Also, all the values of the physiochemical analysis of the water collected in the study area fell within the water quality standard as recommended by WHO and ASTMD.Therefore, it can be concluded that leachate plume existed at the top soil in all traverses acquired around the pit latrine, and these contaminants can be found at the depth that is less than 5m to the subsurface. Hence, the results of both physiochemical analysis, VES and geoelectrical investigations indicated that leachates have not yet pose any threat to the quality of the subsurface groundwater (Aquifer). However, it is recommended that a periodic geophysical investigation should be carried out in the study area at a later time.
References
| [1] | Adekunle AA, Badejo AO, Oyerinde OA. Pollution Studies on Ground Water Contamination: Water Quality of Abeokuta, Ogun State, South-West Nigeria. Journal of Environment and Earth Science (2013). |
| [2] | Asibor G, Edjere o and Ebighe D. Leachate Characterization and Assessment of Surface and Groundwater Qualities Near Municpal Solid Waste Dump Site at Okuvo, Delta State, Nigeria (2011). |
| [3] | Kearey P., Brooks, M. and Hill I. An Introduction to Geophysical Exploration second edition. Blackwell Science Ltd, USA (2002). 125. |
| [4] | Kaplan, B.O. Septic Systems Handbook. Lewis Publishers. Chelsea, (1987). |
| [5] | Noss, R.R., and M. Billa. Septic System Maintenance Management. Journal of Urban Planning and Development. 114: 73-90 (1988). |
| [6] | Olaseni, V.B., Onifade, Y. S. and Baoku, I. G. 2-D Electrical Resistivity Survey and Physiochemical/Microbal Analysis of Groundwater around the Central Septic Tank within Female Hostels, University of Benin, Ugbowo Campus, Benin City, Nigeria. FUPRE Journal of Scientific and Industrial Research. Vol.2, (2), 64-77. |
| [7] | Samake M, Zhoughua T, Hlaing W, M’Bee I, Kasereka K. Assessment of groundwater pollution potential of Datong Basin, Northern China. Journal of Sustainable Development (2010). |
| [8] | V.B Olaseni, Y.S. Onifade, J.O. Airen and O.M. Alile. Geoelectrical Subsurface Imaging for the Mapping of Leachate and Contaminant Plume around Septic Tanks within the Staff Quarters in University of Benin, Benin City, Nigeria. Asian Journal of Physical and Chemical Science 5(4): pp1-10 (2018). |

 Abstract
 Reference
 Full-Text PDF
 Full-text HTML