E. C. Merem1, Y. A. Twumasi2, J. Wesley1, D. Olagbegi1, M. Crisler1, C. Romorno1, M. Alsarari1, P. Isokpehi1, A. Hines3, G. S. Ochai4, E. Nwagboso5, S. Fagei6, S. Leggett7
1Department of Urban and Regional Planning, Jackson State University, 101 Capitol Center, Jackson, MS, USA
2Department of Urban Forestry and Natural Resources, Southern University, Baton Rouge, LA, USA
3Department of Public Policy and Administration, Jackson State University, 101 Capitol Center, Jackson, MS, USA
4African Development Bank, AfDB, 101 BP 1387 Avenue Joseph Anoma, Abidjan, AB 1, Ivory Coast
5Department of Political Science, Jackson State University, 1400 John R. Lynch Street, Jackson, MS, USA
6Department of Criminal Justice and Sociology, Jackson State University, 1400 John R. Lynch Street, Jackson, MS, USA
7Department of Behavioral and Environmental Health, Jackson State University, 350 Woodrow Wilson, Jackson, MS, USA
Correspondence to: E. C. Merem, Department of Urban and Regional Planning, Jackson State University, 101 Capitol Center, Jackson, MS, USA.
| Email: |  |
Copyright © 2020 The Author(s). Published by Scientific & Academic Publishing.
This work is licensed under the Creative Commons Attribution International License (CC BY).
http://creativecommons.org/licenses/by/4.0/

Abstract
At a time of mounting fears over the risks of tainted food and the environmental health impacts, people are embracing organic farming in record numbers. The way such alternative food items are displayed in grocery stores in every zone in the country gives credence to the growing acceptance. Since its emergence, organic farming has gained formidable foothold in the Western region where California towers above everyone and other parts of the US. Considering the reasons that originally fueled organic farming and the proliferation across the country, access to more varieties of produces are helping supplement output originating from conventional sources. Further along these lines, elements located within the organic farm structure from size of land area, cropland and food types have increased over time. While the surge in organic farmland use stems from socio-economic forces, ecology and policy factors, very little has been done in assessing the changing trends and the state of organic farm operations using a mix scale technique. Added to that, the guiding standards shaping the regulatory components of organic farm produce and the potentials are barely known. For that, this research will fill that void by focusing on organic farming activities in 10 states in the Western region with emphasis on the issues, trends and factors using secondary data under mix scale techniques of GIS and descriptive statistics. The results point to visible changes in farmland indicators from cropland, food types to output volume in organic farm operations coupled with dispersion of emergent spatial patterns highlighting the extent of organic farmland use and the evolution of other indicators across the states using GIS. Realizing that the changes surrounding organic farming activities in the study area emanate from socio-economic and physical elements, the paper offered seven suggestions to strengthen the sector. The recommendations ranged from the need for a periodic tracking of farm operations to the design of a regional organic land use and food index.
Keywords:
Organic farming, Issues, GIS, Western region, Changes, Factors, Spatial analysis, Land use
Cite this paper: E. C. Merem, Y. A. Twumasi, J. Wesley, D. Olagbegi, M. Crisler, C. Romorno, M. Alsarari, P. Isokpehi, A. Hines, G. S. Ochai, E. Nwagboso, S. Fagei, S. Leggett, Analyzing Organic Food Farming Trends in the US Western Region, Public Health Research, Vol. 10 No. 2, 2020, pp. 41-57. doi: 10.5923/j.phr.20201002.02.
1. Introduction
Beginning in the initial phase of the1980s, organic farming has seen massive evolution and novelty in the US and around the globe [1,2,3,4,5,6,7]. Many analysts have associated the United States (US) government 1980 policy and support for organic foods as the key enabling force behind much of the push for it [8]. Said that, one need not lose sight also as to how the growing appeal of organic philosophy all through the decades of the 1960s and 1970s facilitated the essential groundwork that moved organic farming on top of the US legislative priority during the opening decade of the 1980s [9]. Even though during the 1970s, improved ecological consciousness and customer needs coupled with the widespread convergence of the ideas that drove the advances in the organic sub sector in that era, the emergent movement encountered mounting challenges [9,10]. For communities who lacked the capacity to cultivate organic food for consumption in such settings, it was frequently problematic to track the item credibly, given the limited guidelines on what really constituted organic food [11,12,13]. Yet, the preference for the adoption of organic food stayed on the upside amidst numerous justifications surrounding it, both in the early years and the present times [14,12]. This seems to have occurred despite mounting changes in many indicators and factors germane to the sector in the Western region [9,15].Considering the inherent the economic potentials together with ecological benefits embedded in organic agriculture [12,13,16,17,18]. There exists a rising segment of food experts, conservationists, state bureaucrats, growers within cities and the county side, that were becoming far more concerned and startled about the probable susceptibility to the fossil fuel dependent structures of operations that nowadays shape conventional American farming [19]. Accordingly, in the last four decades, mainstream agriculture has become heavily more reliant on hydrocarbon based, agro-chemicals and nutrients to sustain crops and ensure plant safety [19]. This emanates from the sudden outbreak of diseases and viruses known to constitute dangers to productivity. Undoubtedly, such energy-intense farm infrastructure has considerably accelerated the agricultural output in the nation. Still, the abruptly ever-increasing productivity expenses from daily operations and fluctuating supply of available energy in the form of petroleum and farm nutrients and agrochemicals, prompted a significant preference for affordable and more ecologically benign production system like organic agriculture [20]. Just as the seeming deterioration and shortfalls in soil yield all over the US have been felt in farming circles due to extreme erosion, chemical outflow, and damages from deficits in loss of soil organic material. The impairment of environmental quality from sedimentation and pollution of natural waters by agricultural chemicals rank high as huge concerns. The potential hazards to human and animal health and food safety from heavy use of pesticides, have also deepened interest in organic farming systems of food production [19]. Thus, conceptually, organic agriculture refers to a way of farming which has a positive impact on the ecosystem while addressing economic and social needs essential to the sustainable development of rural areas as well as environmental protection [11,5,12]. In that way, organic producers often shun the use of synthetic chemicals, antibiotics, and hormones in crop and livestock production by depending on biological pest management, cover crops, and other ecological approaches as alternatives [14,1,21]. Research has also linked these activities with many advantages, made up of minimal chemical residues in food and water, lesser energy use and enriched biodiversity [19,22,21,23].At a time when citizens health all over the country are threatened by the ecological risks of foods laced with noxious chemicals. Organic agriculture has seen massive growth and innovation in the United States and all over the world since the 1980s followed by a huge rally from 2007-2016 [24]. Since then, the idea of producing and eating food cultivated by ‘non-chemical’ methods became more attractive to a certain component of American society starting in the 1960s. Accordingly, people are embracing organic farming in record numbers given the visible displays in grocery stores nationwide and through export markets [24]. Until just recently, it was left to the states to define what constitutes organic food and what criteria growers need to fulfil to be certified with little uniformity. However, by 1990, only 22 of the 50 states had the laws in place to regulate the sector [11]. Due to these problems, the rationale behind the emergence of organic food has been questioned by those who felt such a shift towards it could make people starve. Even at that, organic products continue to grow in the United States at an estimated value of $43.2 billion in 2015 [11,25]. But nowhere has organic farming gained a formidable foothold than the Western region of the country where California now towers above its immediate neighbors and other parts of the United States in every category [15,25,18,9]. However, in the literature very little has been done in assessing the changing trends in organic farm activities in the Western region of the US using a mix scale technique [26,27,28]. Furthermore, when broken across regional lines, the West still showed noticeable dominance compared to the other parts of the country. This is often overlooked in the literature. Considering these voids, this research assesses the status of organic farming in the Western region with mix scale models of GIS and descriptive statistics [29,30,31,32]. Thus, regional analysis of organics remains vital due to their role in food security attainment and sustainable use of the agricultural land base of the region [9]. In terms of objectives, the paper has five aims, and these includes the first two based on the need to explore the issues in organic farmland use and to analyze the state and status of the sector in the US Western region. The others are to assess the changes in non-conventional farm indicators within the states and to identify factors behind the emergence and success. The last objective delves on the focus to design a decision support tool for policy makers. On the organizational side, the paper is divided into five parts made up of introduction, methods, results, discussions and conclusions.
2. Methods and Materials
The study area contains the 10 states of Arizona, California, Colorado, Oregon, Montana, New Mexico, Nevada, Utah, Washington and Wyoming in the US western region (Figure 1). The area has over 70 million people and it is situated along the Pacific North west, and the Desert Southwest ecozone that stretches through 945,800.81 square miles area from Northern Washington to New Mexico [33]. Because of the large size, the diverse ecosystem and new settlements, the recourse to organics has gained widespread currency (Table 1). Environmental features of the region consist of deserts, sensitive wetlands, fish and wildlife streams/lakes [34]. In as much as climate stands among the key elements in the US Western region, the yearlong farming period and areas set aside for growing diverse crops and vegetables helps revenue generation for growers [35]. There is also the presence of good soils, water, and ideal locality which enables planters who were traditionally fascinated about the zone, to capitalize on the resources regardless of the dangers [9,35]. This in turn have been instrumental in the region’s capacity to thrive [35]. Seeing the enterprising nature of the individuals involved and the ability to absorb uncertainties with the investments to flourish under every scientific and policy innovation on their doorsteps. The viability of specialty produces also allows the counties in central California to be steadily ranked high ahead of others. From the multiplicity of microclimates and nearness to the Asian Pacific Rim, the marketplace preference for California and western products remains enormous. Surely, in the Pacific North West especially, the incidence of water scarcity politics has also lured a hand full of California farmers to the subzone in lieu of booming water rights, rising market and a supportive farming environment. For that, the Columbia Basin irrigated region in central Washington had several counties on the top 200 list of best places to farm [35].Table 1. The Population of The Study Area in 2010 and 2017
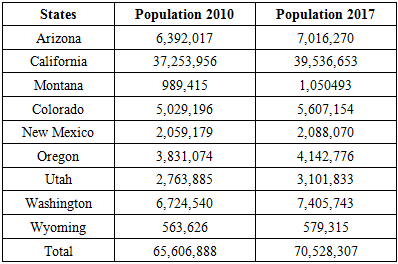 |
| |
|
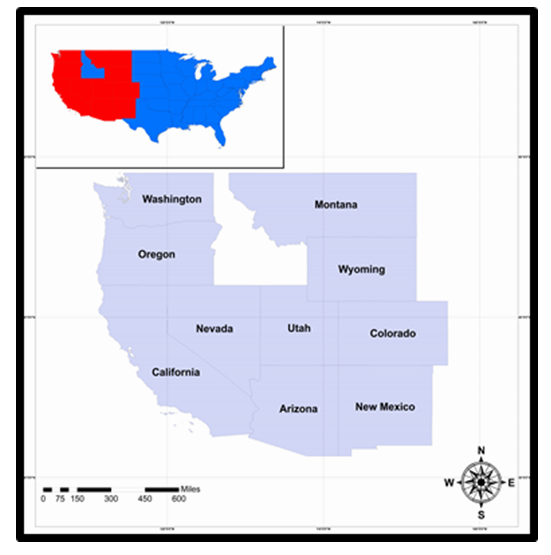 | Figure 1. The Study Area, US Western Region |
Furthermore, the pace of demographic changes, policy innovation, climate, exports, rising demands, prices, sales, global outreach and preference for non-conventional agricultural produce have prompted unparalleled expansion of organic farm indicators since 2001-2011. In the context of such changes, the US Western region has now emerged as the new frontier of organic farms [36,37,38,39,40,41,42]. Being home to tens of millions of citizens with a vast portion of US agriculture, the region is second to none. When 10 states nationwide accounted for 77% of organic farm sales in 2014, California surpassed all of them. At that period, the state of California was responsible for 38% of all US transactions estimated at $2.9 billion [9].Pertaining to organic output, California outpaces everyone when it comes to fruits, vegetables, nuts and berries, with lettuce and grapes ranked as the major income generating organic produces. Just as the Golden state stands out as the key source of organic livestock, with broiler chickens and milk from cows the most essential supplies. California produces more than 90% of all US organic sales for 14 different commodities, including 99% of the nation's organic walnuts, lemons, figs and artichokes and 100 percent of its organic almonds and dates. Being the area with the biggest portion of certified farmhouses and organic land, California brought in new 76 farms onto its organic operations coupled with almost 300,000 acres in 2016. Elsewhere, while Washington dropped from No. 2 in national ranking, sales therein grew by $10 million followed by the addition of 79 new farms and close to 7,000 more acres. Oregon stayed on to the number 4 nationwide with rising deals valued at over $81 million with 52 fresh farms and 19,000 new acres [9]. In that way, California and the other adjoining states in the Western region still led everyone in organic sales, number of organic farms and acreages nationwide. Also, counties with the prime location quotients for organic produce are mostly located in the west especially California, Washington, and Oregon and the others [41]. In all these, worries about increasing dependence by conventional farming on hydrocarbon based synthesized fertilizers to grow food as mentioned earlier, makes assessment of organic products in the US Western region a justifiable research call. Aside from a few sceptics on the current surge in the area, the potentials of organics have become more attractive than ever with a major upside in the US Western region [9,43,44].
2.1. Method Used
The paper uses a mix scale approach involving descriptive statistics and secondary data connected to GIS to analyze the growing evolution of organic farming trends among some selected states of the US Western region from the Pacific Northwest zone of Washington to Arizona. The spatial information for the enquiry was obtained from several agencies consisting of the NOAA, the USGS, the United States Department of Agriculture (USDA), Global organics and organic foods international. Other sources of spatial info emanated from the World Wide Opportunities on Organic Farms, North East organic farming association, California certified organic farmers, organic farmers association, the United States Department of Agriculture (USDA), United Nations Food and Agricultural Organization (FAO), the Pew Research Center, The US EPA, Sustainable Agriculture Research and Education (SARE and Western SARE. In addition to that, the Organization for Economic Cooperation and Development (OECD), the United Nations Environment Program (UNEP), Research Institute of Organic Agriculture, Organic consumers Association, Organic Farming Research Foundation, Organic Trade Association, Organic Valley and Organic Research Centres Alliance (ORCA) also provided other information needed in the research. Generally, the bulk of food security indicators relevant to the region and individual nations were obtained from the FAO’s FAOSTAT, FAO International Working Group on Agriculture, Organic world, USDA National Agricultural Statistics Service (NASS),The state archives from California, Oregon to New Mexico, and the USDA Economic Research Service for some of the periods. At the same time, crucial insights on the relevant data also came from Farm Journal Foundation, National Organic Standards Board (NOSB), USDA’s Risk Management Agency, the Organic Trade Association (OTA), USDA National Agricultural Statistics Service. On the one hand, the USDA, the World Bank, FAO Statistics Data Base, the government of California, California Department of Agriculture, Arizona and California Farm Bureaus provided the secondary data on the total organic farm production, and sales and market quantity. On the other, the Governments of the Western region, the United Nations Food and Agricultural Organization (FAO) offered the time series data, and monetary information on organic farm operations on selected major farm crops like grains stressing the activities in the zone. For additional data needs, the inter-American commission on organic agriculture, USDA Natural resources conservation service, USDA Farm agency and the National academy of sciences were respectively essential in the procurement of information on the critical information and econometric data highlighting deficits, surpluses and changes. In a similar vein, USDA's Agricultural Marketing Service (AMS), the Hartman Group and Food Marketing Institute and the US Department of Commerce remained instrumental in the provision of other relevant information. The other key sources encompass the USDA's Foreign Agricultural Service (FAS), and the Swiss Research Institute of Organic Agriculture, Nielsen data group, and organic trade association. Given that regional and federal geographic identifier codes of the states were used to geo-code the info contained in the data sets. This information was processed and analyzed with basic descriptive statistics, and GIS with attention paid to the temporal-spatial trends at the county, state and regional levels in the US Western region. The relevant procedures consist of two stages listed below.
2.2. Stage 1: Identification of Variables, Data Gathering and Study Design
The initial step in this research involved the identification of variables required to analyze the extent of harvest or production and changes at the national and regional level from 2001 to 2011. The variables consist of socio-economic and environmental information of certified organic grain crop acreage by state, corn, wheat, oats, barley, rye, and their totals, certified organic pasture and cropland, US totals, number of certified operations, crops acres, pasture and rangeland, certified organic acreage of other crops by state and organic farm sales. The others consist of sales amount in $billion -hundreds of million, certified organic beans volume, by state, certified organic livestock, number of certified organic livestock, the top states in organic farm sales, certified organic operations and organic farm sales. Added to that are the organic farms selling within 100 miles, demand for organic products in faraway markets, organic farm groups, household organic purchasing, organic percent sales, population estimate, housing data, housing units, building permits and size of certified organic grain. These variables as mentioned earlier were derived from secondary sources made up of government documents, newsletters and other documents from NGOs. This process was followed by the design of data matrices for socio-economic and land use (environmental) variables covering census periods from 2001, 2003,2006 to 2008, 2011 to 2016. The design of spatial data for the GIS analysis required the delineation of county boundary lines within the study area as well. Given that the official boundary lines between the 10 Western states remained the same, a common geographic identifier code was assigned to each of the area units for analytical coherency.
2.3. Stage 2: Data Analysis and GIS Mapping
In the second stage, descriptive statistics and spatial analysis were employed to transform the original socio-economic and ecological data into relative measures (percentages, ratios and rates). This process generated the parameters for establishing, the extent of organic food production, and the quantity and crop areas cultivated and others related to certified organic grain crop acreage by state, crop types, and land use types, the changing pattern in harvests, food availability, number of people or population and housing units and building permits driving the market sales and trends across the region for each of the 10 states through measurement and comparisons overtime. While the spatial units of analysis consist of states, the region and the boundary and locations where organic food farm sales, acreages of crops and the proportion of certified organic livestock and the number of certified organic livestock flourished. This analytical approach allows the detection of change, while the tables highlight the actual frequency and averages on household organic purchasing, organic percent sales, housing units and permits, the demands for organic products in farm markets, size of certified organic grain as well as the economic equivalents.The remaining steps involve spatial analysis and output (maps-tables-text) covering the study period, using Arc GIS 10.4 and SPSS 10.4. With spatial units of analysis covered in 10 states (Figure 1), the study area map indicates boundary limits of the units and their geographic locations. The outputs for each state were not only mapped and compared across time, but the geographic data for the units which covered boundaries, also includes ecological data of land cover files and paper and digital maps from 2001-2016. This process helped show the spatial evolution, location of various activities and the trends, the ensuing environmental and economic elements, as well as changes in other variables and factors driving the surge in organic food and the evolution in the study area.
3. The Results
This section of the paper presents the results of data analysis on changing organic farming situation in the study area. There is an opening focus on the temporal highlights of total organic land use and the number of certified operations. This is followed by an assessment of organic beans land and crop land and the totals in certified organic grain crops using descriptive statistics. The others consist of the GIS mapping and the identification of factors responsible for the trends in organics in various states within the US Western region over the years.
3.1. Total Organic Land Use 2001-2011
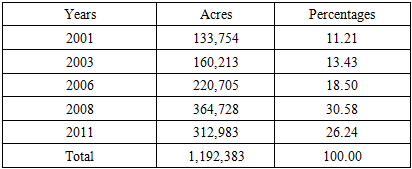
From the data, the Western region occupied a total of 1,192,383 acres of organic grain land from 2001 through 2011. The temporal distribution shows that the US Western region used up 133,754 to 160, 2013 acres in the first periods of 2001-2003. By the fiscal year 2006, organic grain land area in the region surged to 220,705 acres. In the final two years 2008 to 2011, the states in the Western region saw their land area set aside for grain drop from 364,778 to 312,983 acres (Table 2). Seeing the deficits of -51,795 acres at a rate of -16.54% during the periods of 2008 to 2011. Such losses even though higher and absent in the initial years, are significant enough to disrupt the burgeoning activities in the sector. However, in terms of the percentage break down in the temporal distribution in total organic grain land in place under the decade spanning from 2001 through 2011, note that the highest proportion of available land for organic agriculture of 30.58% to 26.24 held firm in the later years of 2008 to 2011. Further examination of the information on the Table showed that these values exceeded the percentage levels of 11.21%, 13.43% and 18.50% as evidenced in the early periods of 2001, 2003 to 2006 in the organic farming fields throughout the US western region (Table 2). Table 2. Size of Certified Organic Grain Land, 2001-2011 In US the Western Region
 |
| |
|
3.1.1. The Number of Certified Operations
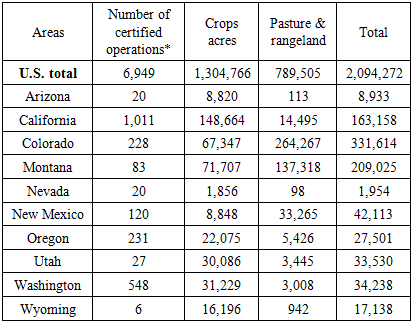
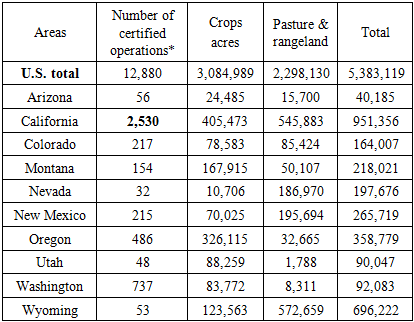
Considering their relevance in the agricultural structure, the number of certified operations in the study area surged abundantly between 2001-2011. Within the years, the totals of approved organic farms went from 2,294 to 4,528 among the states in the study area. This reflects the across the board increments in the respective places of operations in the individual states with the bulk of the farms stationed in California. During those periods, California’s number of certified operations jumped from its initial values of 1,011 in 2001 to 2,530 during the fiscal year 2011 by over 150%. The same can be said of Oregon, Washington, New Mexico, Wyoming and Montana where farms designated as certified rose significantly (from 231 to 486, 548 to 737, 120-256). Among the last two states, the number of operations also rose notably by 6-53 to 83 -154 farms (Table 3-4). In terms of certified organic pasture grainland between the fiscal years 2001 through 2011 by state in the study area. The trio of states made up of Colorado, Montana and California started as the lead places with sizable land areas stretching over the hundreds and thousands of acres (331,614,209,025-163,158) as at 2001. Among the second-tier states, the states of New Mexico, Utah, Washington and Oregon followed closely in the low tens of thousands of acres (42,113-27,501). Of the other third group of states with notable pasture and grain land areas, the farm sizes in Arizona and Wyoming stood at 8,933 to 17,138 acres all through 2001 (Table 3). All in all, California held on to more cropland acreages (148,664) while Colorado used larger areas of pasture and rangeland followed by Montana whose pastureland stood at 137,318 acres during the same period. Although by 2011, a completely different land use pattern emerges in the temporal distribution of both certified organic pasture and cropland. Understandably so, California and Wyoming stood firm and outpaced the other states as the top two states with vast swaths of areas (951,356 acres to 693,222 acres) devoted to usage during that period (Table 4). The trio of the other states in the region most notably Montana, New Mexico and Oregon were quite active and not left out considering the volume of organic farm activities and their positions as actors with notable acreages. From the level of activities, these group of states accounted for 218,021, 265,719 to 358779 acres. Elsewhere, Colorado, Utah, and Washington contained organic pasture and cropland estimated at over 90,000 to 164,000 acres individually. This size of land areas surpassed the 40,185 acres in use at Arizona during the same timeframe. Further look on the size of areas among the states in the study area, shows that while California posted almost identical values (405,473 to 545,883 acres) in crops and pasture land, Oregon topped the rest of the states in crop acreages worth 326,115 with lower pasture and rangeland sizes of 32,665 acres. Wyoming on the other hand occupied the largest pasture and rangeland available (572,659 acres), coupled with 123,563 acres in cropland that is somewhat lower than the levels in California during the same period in 2011 (Tables 3-4). Table 3. Certified Organic Pasture and Cropland, 2001, by State
 |
| |
|
Table 4. Certified Organic Pasture and Cropland, 2011, by State
 |
| |
|
3.1.2. Assessment of Organic Beans and Cropland Use
Regarding organic beans total land areas under cultivation for the study area, out of the total of 12,870 to 23,307 acres over the ten-year period of 2001 through 2011, the land areas devoted to the crop rose by 81.09% at an average of 2,337-1,608.75 acres. Note that in the 2001 period when Colorado and Montana dominated the acreage distribution with 6,934 to 3,809 acres, California contained only 946 acres. During this same period, Utah, Washington and Wyoming held 559,247 to 302 acres compared to the miniscule acreages of 307 to 43 for New Mexico and Oregon. By 2011, the acreages devoted to beans cultivation expanded notably to 6,433, 6,205, 5,268 in Washington, Montana and California. Since the upswing was not limited to the first set of states under analysis, Arizona, Colorado and Oregon saw their organic beans land area move up to 2,334,1,021 to 1,503 acres respectively as well. With time, the states of New Mexico and Utah faded gradually with marginal acreage areas of 16 to 26 in beans land while Wyoming saw slight increases of 442 acres during the same period. From the percentages of change in areas set aside for organic beans farming between 2001-2011, a trio of states (California, Oregon and Washington) posted the largest triple and four-digit gains of 456.87%, 3,395% to 2,508%. Other evidence of gains in organic beans land areas in the study area includes the 62.90 to 46.35% for Montana and Wyoming while Colorado, New Mexico and Utah accounted for heavy double-digit declines of -85.27, -46.66 to -95.34 percentage points respectively. In as much as Colorado and Montana led the rest of the states in the percent of organic beans farm area by 53.87 to 29.59% in 2001, by 2011, California, Montana and Washington emerged with identical individual shares of over 20% (22.60-26.62,27.64) in land areas acreage distribution. This represents 76.86% of the entire organic beans’ farmland areas in the Western region during the fiscal year 2011. In the remaining states, whereas Arizona held on to 10%, Colorado’s dominance gradually evaporated to barely 4.38% and the rest finished under low single digit in total area percentages (Table 5). Table 5. Certified Organic Beans by State, 2001-2011 Acres Total
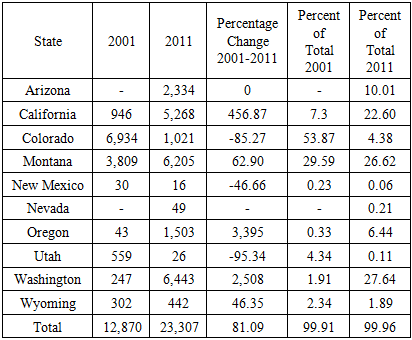 |
| |
|
3.1.3. The Total in Certified Organic Grain Crops
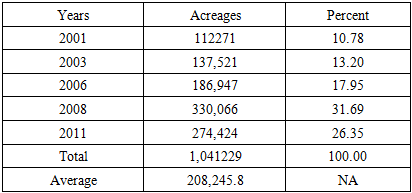
The temporal distribution of certified organic crop acreage from 2001 through 2011 shows the study area planted multiple crops from corn to barley on 1,041,229 acres under a span of a decade at an average of 208,245.8 acres over those years. The breakdown over the individual years 2001 to 2006, showed certified cropland under the group of crops rose much of the time by over 100,000 acres (112,271, 137,521 and 186,947 acres) respectively. The trend continued in 2008 and 2011 with additional 330,066 to 274,424 acres under cultivation. Looking at the percentage distributions of certified organic crops over the years, (from 2001-2011), the proportion of the land acreages of 31.69% -26.35% in 2008 through 2011 exceeded the levels (10.78, 13.20, 17.95%) in place during first three years (Table 6). Table 6. Certified Organic Grain Crop Acreage (Multiple Crops) by State, 2001-2011 and the Percentages
 |
| |
|
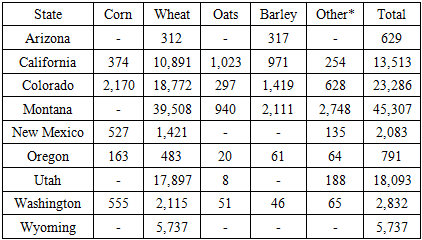
Based on the total acreages set aside for organic grain crop in the US Western region between 2001 to 2011. The available land areas in California did not really exceed those of some of its neighbors as manifested in the previous land use indicators and categories. In 4 of the 5 years under analysis, Montana held the top spot in total acreages in 2001, 2003, 2006, and 2011 with the exception of 2008 when California emerged as the number one with 84,134 acres (Table 7-11). Notwithstanding all that, other states like Colorado and Utah were active, given the large swaths of areas tied to certified organic grain crops. For that, looking at the info in the table, during the initial periods of 2001 to 2003, the cropland (45,307-57,836 and 23,286-34,042) in the duo of states Montana and Colorado exceeded by a wider margin those in California estimated at 16,941-13,513 acres. In the same period, Utah stayed in the mix with 18,093-12,670 acres at levels higher and comparable to California by 2001 through 2003. Of the increases that occurred in the fiscal year 2006, Montana’s ranking at number 1 remained unchanged with the surge of 59,578 acres in organic crop land. In that year also, both California and Colorado accounted for over 40,000 acres each (44,283-43,142) while the state of Wyoming jumped to the 4th place by 19,537 acres. Table 7. Certified Organic Grain Crop Acreage, by State, 2001
 |
| |
|
Table 8. Certified Organic Grain Crop Acreage, by State, 2003
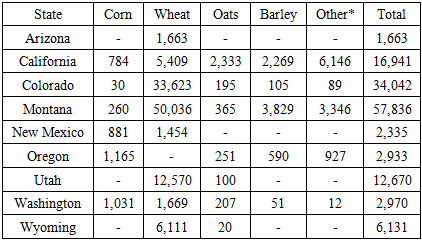 |
| |
|
Table 9. Certified Organic Grain Crop Acreage, by State, 2006
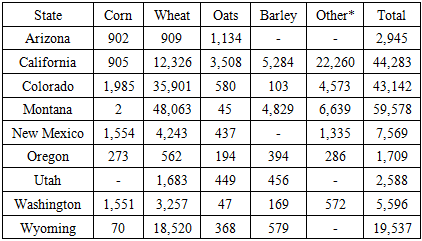 |
| |
|
Table 10. Certified Organic Grain Crop Acreage, by State, 2008
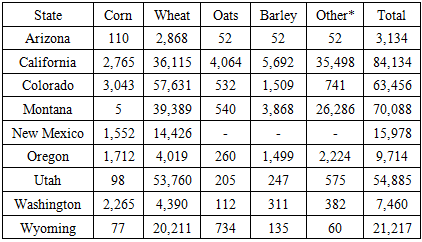 |
| |
|
Table 11. Certified Organic Grain Crop Acreage, by State, 2011
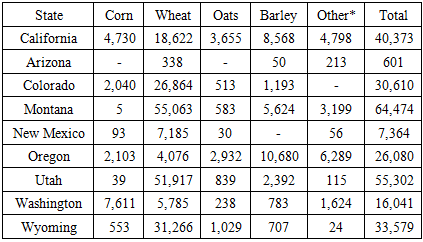 |
| |
|
In the ensuing year, 2008, a completely different scenario emerges in which California at number 1 with 84,134 acres outpaced Montana and Colorado whose land areas at 70,088 to 63,456 acres put them at 2nd and 3rd spots in the ordinal rankings among the size of areas under certified organic grain crops made up of corn, wheat, oats, barley and others (Table 10). Elsewhere, the states in the third-tier category, Utah, Wyoming and New Mexico did set aside sizable land areas (54,885, 21,217, and 15,978 acres) to certified organic crops at levels much higher than the other remaining states under the listings. By 2008, Montana and Utah stood out as the leading producers with more land areas (64,474-55,302 acres). This exceeds the certified organic grain crop acreages (40,373, 33,579, 30,610, 26,080 acres) for a quartet of states most notably California, Wyoming, Colorado and Oregon (Table 11).
3.2. GIS Mapping and Spatial Analysis
Understanding the spatial dimensions of organic farm activities in the study area, requires the analysis of the various indicators germane to the scale of operations over the years among the various states. With the geographic distribution of organic agricultural parameters listed under different (five information) fields ranging from organic farm sales to certified farms in the region. The GIS Mapping of the tendencies reflects a gradual dispersal of organic food indicators in various scales throughout the US western region with much of that on the Pacific side of the map and the others in the South West over time. From the periods 2014 to 2016 as the maps show, note that between the top 10 states nationally ranked as the leading ones in organic farm sales, five states(California, Washington, Oregon, Arizona, Colorado) in the US western region located along the Pacific Northwest and the Desert South ecozones stood out in enviable spots of 1, 2,4, 9, 10 out of the $6.2 billion totals representing about 78% in sales nationwide. From its reputation as a major hub, it came as no surprise that in 2016 fiscal year, the Western region again accounted for another quartet of (4) states listed among top 10 leading areas in organic farm sales across the country under a market share of $ 7.8 billion and 77% of the transactions (Figure 2-3).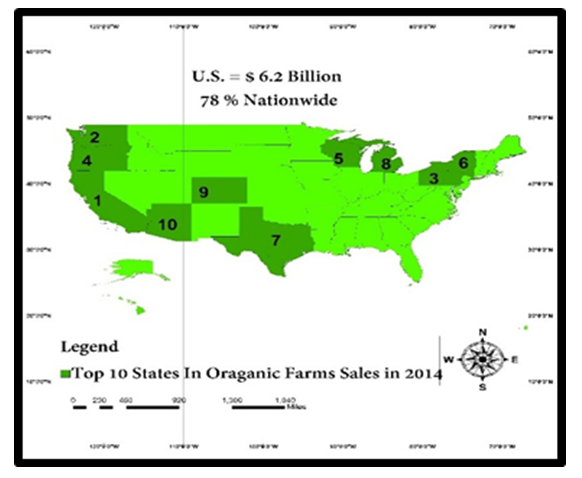 | Figure 2. Top 10 States In Organic Farm Sales, 2014 |
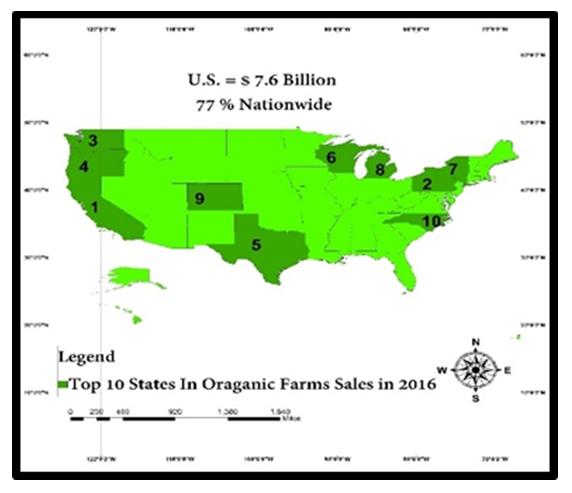 | Figure 3. Top 10 States In Organic Farm Sales, 2016 |
Looking further at the spatial distribution of other forms of organic farm sales in the states in the study area during the period 2014. The information in Figure 4 offers a display of sales activities which directly targeted willing consumers on different points in space across states in the West. With the sales interactions as conveyed through the map legends symbolizing percentage values classified in different scales under a trio of generic colors (green, yellow, and blue) for illustration purposes. There emerged additional info under sub colors highlighting evolution and dispersion of alternative farm sales depicting the proportions in the actual direct deals in 2014 (dark green, light yellow or light green and light blue colors) in the individual states of the Western region. Beginning on the upper left corner of the map within the Pacific North side and Central area and the Eastern corridor in dark green color. The proportion of direct sales of organic farm food items to consumers in 2014 showed heavy concentration in five group of states made up of Washington, Oregon, Montana, Utah and Colorado at the medium rates of 40-59.9%. At the same time, further instances of direct organic farm sales at 20-39% in light green/light yellow colors involves the convergence in activities in the upper part of the study area in Wyoming and in the South and Desert Southwest areas of California and Arizona as the direct transactions in Nevada and New Mexico held firm at 60-79.9% (Figure 4). 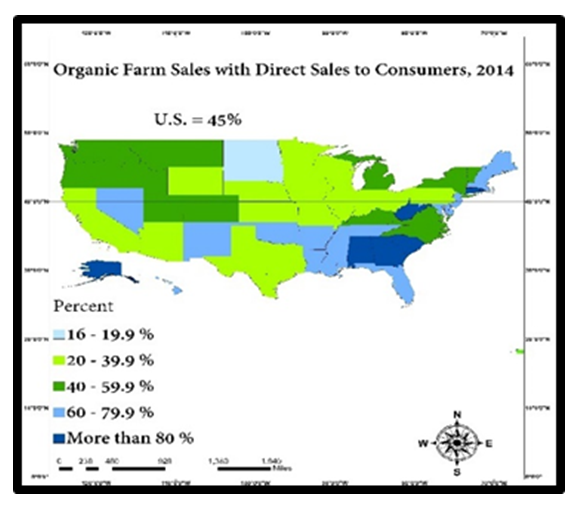 | Figure 4. Direct Organic Farm Sales to Consumers, 2014 |
In the context of the geographic distribution in the share of organic farm sales within 100 miles in the country during the fiscal year 2014. The group of four states in light blue representing Washington, Oregon, California and New Mexico in both the Pacific North west and Lower south zone of the study area saw robust market shares given the scale of their activities of 80-89.9%. Elsewhere, in the same order, Montana and Wyoming listed in light yellow and very light blue colors in the map followed up with appreciable rates of 60.69 to 35-59.9% in their share of alternative farm businesses. Note also a cluster of other states in dark green (Nevada, Utah, Colorado, and Arizona) dispersed mostly along the Central zone, Eastern plains and the Desert South west where market access under 100 miles reached sizable proportions of 70-79.9%. In sum, in 2014 again, emerges the cluster of areas from the Pacific upper north and central zone portions alongside New Mexico in the South west, Montana and Colorado having 70-89% of organic farm shares within 100 miles. With that came robust points in space depicting states where farms engaged in direct sales of organic food items to consumers during 2014 in the Western region were active (Figure 5).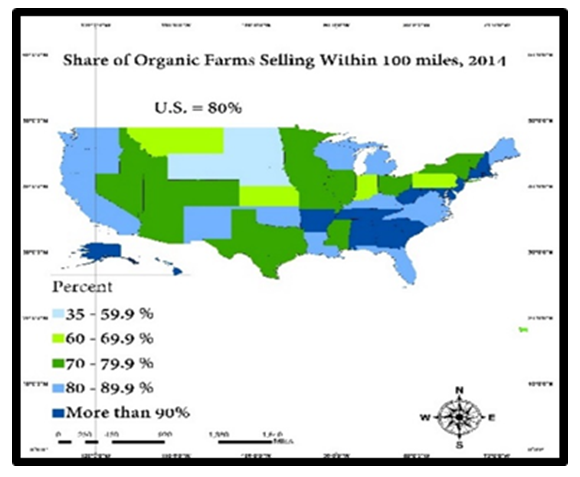 | Figure 5. Organic Farms Selling With 100 Miles, 2014 |
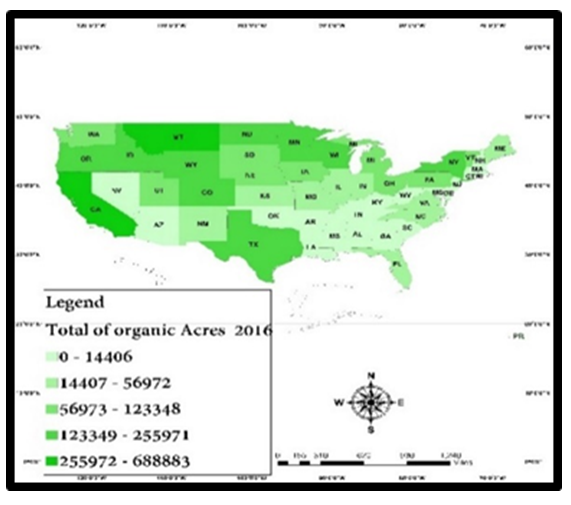
The geography of the actual presence of organic farms and the size of their overall land areas devoted to alternative agricultural operations in 2016 underscores the extent and form of the evolution in US western region (Figures 6-7). The classification involves various shades and scales in blue, light green and light gold from low to high category. From the large farming activities synonymous with the areas represented in dark blue, the left side of the map from the upper and the lower south portions, are places in the region with more than 500 organic farms. Being the highest scales in the rankings as depicted in the legend, the geographic distribution network of the farms in space transcends the trio of states in the Pacific North western zone (Washington, Oregon and California) where their dominance remain visible with the presence and gradual spread of the over 500 organic farms class across the states. Closely followed are the medium sized farm class depicted in green and light blue with scales of 200-500 and 101-200 in the central state of Colorado coupled with Montana and New Mexico. The areas on the lower scale as calibrated by 0-100 organic farms showed huge presence in the upper north west state of Wyoming and neighboring Southwest Desert states of Nevada, Utah and Arizona. For that, the geography of farm numbers nationwide indicates farm classes under the 500-100 plus category stayed steady in the Western region with the Pacific states of Washington to California and Oregon surpassing the others (Figure 6). In the total size of organic farms, the big producing states of California and Montana responsible for 235972-688883 acres of these farms in dark green held the top spot. In the same fashion, the medium size states of Oregon, Wyoming, and Colorado, Washington, and Utah in the upper and East central parts of the region with deep concentration of 56, 973- 123, 348 acre sized farms outpaced the remaining areas of Nevada and Arizona in very light green where average farm sizes stood at 0-14,406 acres ( Figure 7).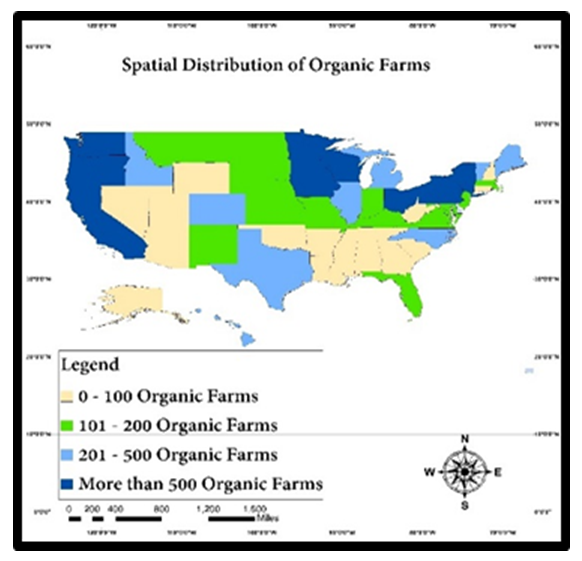 | Figure 6. Spatial Distribution of Organic Farms |
 | Figure 7. Total Organic Farm Acreages 2016 |
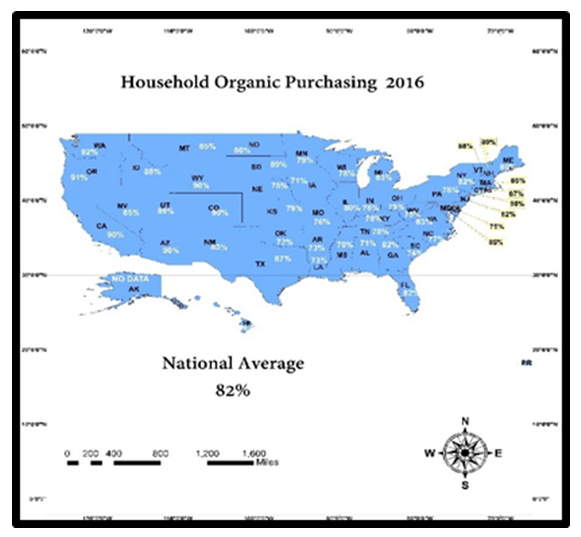
Also, the spatial distribution of the demands for organic products in 201 US farm markets in 2005 seemed substantial in metro and non-metro zones in the Pacific Northwest, the desert ecozone and to the central zone from Washington, California, Oregon and upper Colorado. Further look indicates the metro and non-metro areas in Montana and Northern New Mexico experienced overwhelming quest for organic farm products as evidenced in 201 farm markets. The market demand scales of strong, medium and low and non-neutral in dark oval red to light red, were highly notable across the upper portions of the Pacific North west side of Washington to Lower California and New Mexico as well (Figure 8). In as much as household supplies of alternative farm products reached substantial levels throughout the states in the region, under a national average level of 82%, home purchase of organic agriculture and food items remained in the 90s and 80%+ among the states in the region in 2016. Among the individual places, 6 of nine states (54.54%) posted household organic supplies of over 90% to 90% while three others had rates of purchase of 83 to 85%. The states where domestic purchases of organic food items reached the 90 and 90% plus mark comprises of Washington and Oregon in the 92-91% category and the others (California, Arizona, Wyoming, Colorado, Montana, Nevada, New Mexico) classified under 90%. The trio of other states or 33% of the overall (Montana, Nevada, and New Mexico) posted household purchases represented under the 83-85 % class (Figure 9).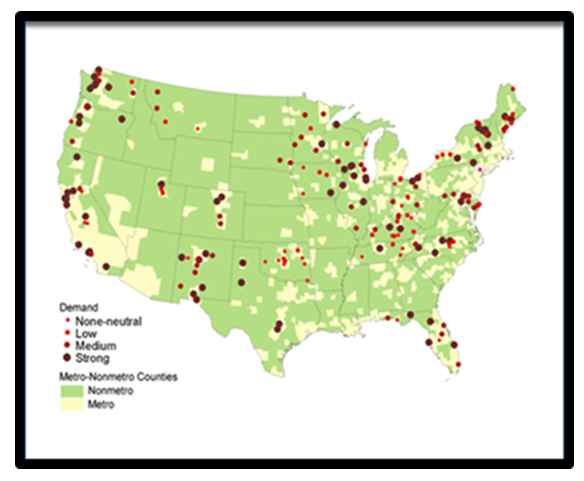 | Figure 8. Demand For Organic Products In 201 US Farmers Markets 2005 |
 | Figure 9. Map of U.S. Household Organic Purchasing 2016 |
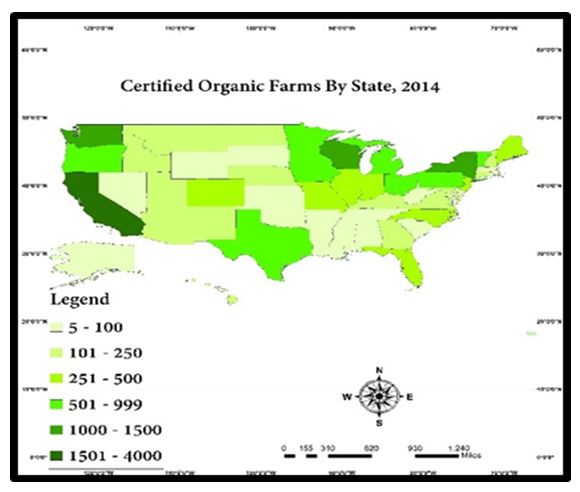
With the rising emphasis on food safety and regulatory enforcements of acceptable standards and quality in every agricultural farm as required by policy. The certification process involving the number of organic farms in operation and those granted waiver status of exempt has now assumed far more relevance than ever. This makes the geographic dispersion of certified farms a significant measure of the state of organic agricultural activities in the US western region between 2014 to 2016 (Figures 10-13). With a handful of states now required to certify operators in line with federal policy requirements, the certification of organic farms has emerged as a regular component of the US farm regulatory rules in the study area. The number of states involved in certification therein, in California, Washington and Oregon exceeds those in the other states with 501-1000 and more than 1000 farms certified and exempt in 2014 represented in dark and light red. In other places, both Montana, Colorado and New Mexico in the upper and lower portions of the Western region had a total of 101-500 organic farms in pink colors. This is followed by the quartet of other states (Wyoming, Nevada, Utah and Arizona) in milky and yellow colors that contained lower number of farms estimated at 51-100 to 8-50 and classified as certified and exempt organic farms by states in 2014 (Figures 10-11). In the other years, most notably 2015-2016 (Figures 12-13), the states of Washington and California in dark and mild green colors stayed consistent in terms of farms certified to operate in the region. At the scales of 1501-4000 to 1000-1500 and 500 -999 to 1000 plus farms among the two states, the certification process appears to have penetrated large swaths of areas in the study area (Figures 12-13). Added to that are the lower tier states like Nevada, Arizona and others in light green and yellow where the scales in certified farms ranged from 5-100, >50, 50-99 to 100-499 and others all through 2014, and 2016 (Figure 10-13).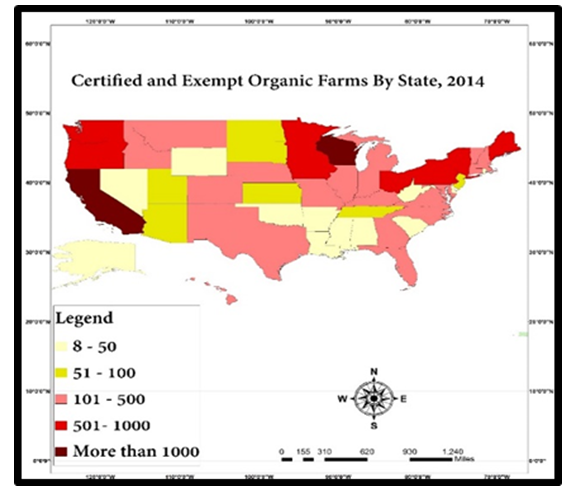 | Figure 10. Certified and Exempt Organic Farms 2014 |
 | Figure 11. Certified Organic Farms Operation 2014 |
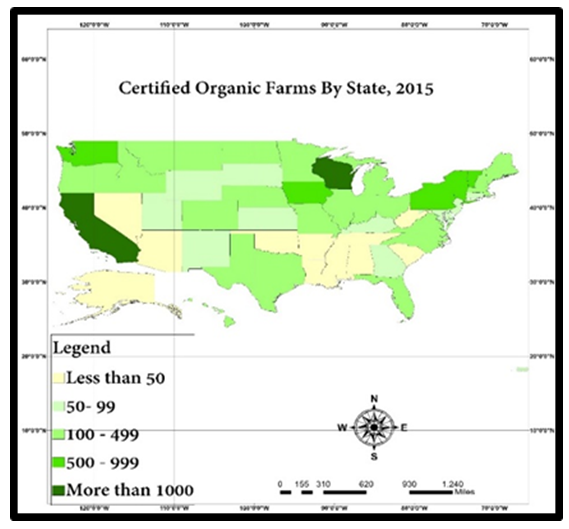 | Figure 12. Certified Organic Farms Operation 2015 |
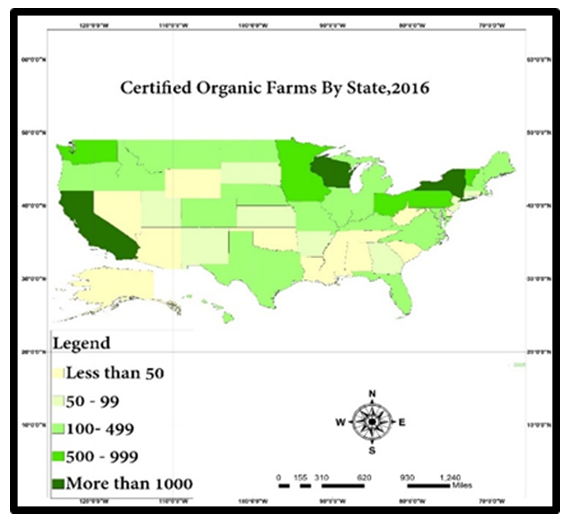 | Figure 13. Certified Organic Farms Operation 2016 |
3.3. Factors Linked to Organic Farming Surge
The surge in organic food does not operate in a vacuum in the study area. It is built on a set of policy, socio-economic, global, demographic, physical and environmental factors outlined below.
3.3.1. Policy, Socio-Economic and Global Forces
Among the prevailing factors that have sustained the remarkable growth in organic farms in the US Western region, the nation’s agricultural policy has been partly instrumental in setting the stage and boosting productivity. With policy as the driving force over the years, US consumer demand for organic food outpaced domestic output. Ever since the national standards were set in 2000, the rapid expansion in consumer demand continues to usher in opportunities for US producers to penetrate various markets both local and global. For that in 2010, when the USDA set its priority goal for organic food: the number of US certified organics grew by 5% over 5 years at a remarkably faster pace, this in turn translated into unprecedented turnaround with vibrant activities in major farm markets boosting revenues, farm orders and productivity. Under the National Organic Program as part of its policy agenda, the USDA assisted the organic farm sector to earn $35 billion yearly in US retail sales. Also, in the past decade, the production and market share of organic farms rose globally, with greater value in the Americas. Under its policy, the USDA stands actively involved in breaking down trade barriers through the US farm assistance schemes with resources to reach consumers globally. The favorable policy environment regarding the organic community locally has put over 25,000 organic businesses in over 120 nations, now at the disposal of US farmers. Without such active policy on the part of US government in favor of local operators, the spark in the organic farming markets in the Western region would have cooled off to some degree, hence the role of policy.
3.3.2. Consumer Groups and Demography
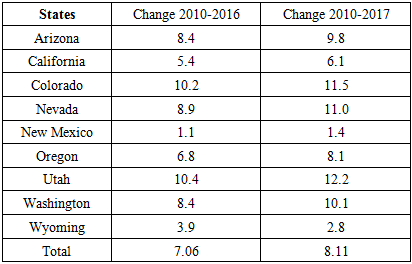
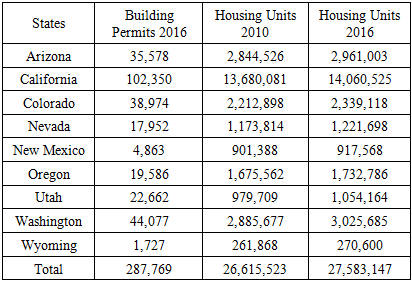
The fact that organic items have moved from being a routine desire for just a few clients and now used by many in the US exudes promise and success in the sector. Thus, alternative farming transactions can no longer be dismissed as something applicable to those solely at the fringe of mainstream. Given that the emergence of new consumer groups like millennials and others whose choices for farm products free from agrochemicals, sparked the rising preference for organic food items in large numbers over the years. This surge in alternative food types not only shaped market activities, but it did influence the output levels and variabilities in a whole set of organic farm indicators in the study area as witnessed over time. This comes at a time in which the population growth rates of the states in the US western region over the years surpassed the United States yearly national average (Table 12). Of the states in the area, California has the highest population of over 37-39 million along with a quartet of states made up of Arizona, Washington, Colorado and Oregon. In serving such a teeming population, the demand for housing has not only grown through the issuance of permits and the design of more units (Table 13). The influx of more people meant extra food demand to sustain sectors like households, the general public and communities to the benefit of organic farm producers. In 2014, the age group 18-29, actively included organic products in their diets compared to one-third of 65 and older. While farm operators are younger in the organic sector than in conventional farming, the millennial age group have been continually driving the growth of organic farms in the US western region all these periods.Table 12. The Percentage of Change in the Population of The Study Area
 |
| |
|
Table 13. The Housing Data of The Study Area 2010-2016
 |
| |
|
3.3.3. Physical and Environmental Elements
Considering that under organic agriculture, environmental costs tend to be lower and the benefits greater than mainstream farming. The reasons stem from the perceptions and concerns of food safety matters associated with conventional farms where recalls of tainted food are recurrent in the country. Consumers familiar with these incidents and the attendant risks often turn to the proliferating alternative food production systems fuelled by organic farms in the Western region. In that case, organic farms tend to have better soil quality and erosion reduction capabilities essential for conservation when compared to their mainstream counterparts. While overall, organic farm generally creates less soil and water pollution hazards with the potentials to lowering greenhouse gas emissions with more energy efficiency. Organic foods associated with greater biodiversity of plants, animals, insects and microbes as well as genetic diversity remains the ideal choice of a growing class of consumers receptive to the green side of these products. Accordingly, organic farming delivers more foods containing less or no pesticide residues and carry with it, greater social benefits vital to community wellbeing. With only 1% of global agricultural land devoted to organic farms, then it remains a relatively untapped resource. There is opportunity to produce enough food for a world population that could reach 10 billion by 2050, without rapid deforestation and harm to the environment. For that, the US organic pasture and cropland which has been growing since 2002-2015, has a great future to thrive on.
4. Discussion
In a period in which the wellbeing of consumers throughout the nation are burdened by the mounting risks spurred by contaminated food items in mainstream farms. Organic agriculture has witnessed massive progress with gross appeal in the United States and other parts of the globe. The recourse to organic food in the country also coincides with its adoption and display in supermarkets and eateries with consumer patronage and the active involvement of planters driving the popularity via supply chains and markets across cities and states. That was the case in 2015 when organic products surged in the United States by an appraised value of $43.2 billion. Besides being an agricultural system with benign effect on the ecosystem while advancing economic and social needs, crucial to the sustainability of farming protected areas and ecological conservation. One need not overlook the inherent place of the ubiquitous energy radiated by the environmental consciousness of the past eras, in addition to consumer desires and the receptiveness of the government to the sector. Added to that are the preferences of younger demographics in catapulting the advances in organic systems in the study area of US Western region. To glean the state of such alternative farming system, this enquiry provided a lasting perceptive highlighting the organic farming trends utilizing secondary data analyzed by mix scale tools of GIS and descriptive statistics at the regional level and local scales in the group of ten states in US Western region from 2001 to 2017. Realizing that California accounts for over 90% of all sales in the nation’s organic products in 14 diverse food items together with the addition of 76 farms and 300,000 acres in 2016. The Western region based on the analysis, contained over 1 million acres in organic grain land between 2001 through 2011. Within that decade, the region did set aside hundreds of thousands of acres towards the cultivation of grains during the periods 2001-2003. Despite drops of 51,795 acres at -16.54% by 2008 to 2011, the study area still boosts of abundant swaths of land areas dedicated to organic farming spread across multiplicity of states in the zone.Considering the vast diversity in the ecosystem and new settlements and the all year-round farming time and climate, the gradual shift to organics has expanded immensely into the west and growing revenues for farmers in the region. Turning to the activities of the individual states over the years, by 2001 and 2011 under certified organic pasture and cropland variables. California held the prime position as the leading place in other land use indicators like the number of certified operations, crop areas and pastureland during the ten-year period. However, the entire region saw its number of operators grow from 2,294 to 4,258 operators together with a total of 869,204 to 3,074,095 acres in the crop and rangeland areas from 2001 to 2011. In the case of certified organic beans land areas, apart from the common dominance of California, both the states of Colorado and Montana in the central and upper north west part of the Western region in the mountain sides stood out significantly with much higher proportions of land areas. This includes those set aside for beans much of the time in 2001 followed by a visible rebound by California in 2011 that ended slightly below Montana during the same period. In the year 2001 through 2011, the cultivation of certified organic grain crops in the study area again puts Montana in the number one spot in the size of areas in 3 of the 4 years (2001,2003,2006) and second only in 2008 when California led the region in that category. Elsewhere, lower tier states like Colorado, Utah, and Wyoming were not left out in asserting their relevance, as they also held their own as well, in a couple of occasions during the different years. Certainly, the US Western region stands out as the frontier of organic farming far ahead of other zones in the nation with California as the leading state. Organic agriculture is not only thriving therein, but the region’s organic farm structure seems solid in every category. Thus, the temporal distribution of organic farmland indicators remained on the upside much of the time. In that way, the study area contained sizable organic grain land area all through 2001 to 2011. In as much as the GIS mappings point to an uptick and gradual spreading of organic food indicators from farm sizes, farm sales, certified farms, farm demands, and purchases to market shares clustered all through the states in the region. The changing trends in organic farming did not occur in isolation, they were propelled by several socio-economic, demographic and ecological factors with local and global roots. From the current profile in place in the region and the food security it constantly ensures through the producing states, the consumers, and markets dependent on it, the potentials of organic farming holds promise for the agricultural sector more than ever. Realizing that the enquiry ushers in a viable approach in policy making vital in assessing the status of alternative forms of agriculture in various states in the US Western region. There are ample opportunities to further shape the contours of multi state aspects of organic farming activities in the US Western region in a way that better prepares the sector with the best chance of realizing the potentials therein. The expectation is that it will help in meeting the prescribed policy standards necessary in serving the needs of a growing consumer base. All in all, the study does stand out in shaping the directions of regional organic farming and their respective land uses and the capacity of the states to promote the surge in the sector in the years ahead despite some challenges. The research helped create a critical template necessary in tracking the variability of organic farm parameters in the US Western region over time. In that way, stakeholders (public and private agencies) will benefit from the proper framework showcased herein for sustaining the prospects of organic farm sector in the attainment of food security. To address some of the issues, the research offered several recommendations. This includes 1) the need for periodic tracking of operations with regular use of precision devices; 2) inroads into ethnic minority communities; 3) maintain original identity; 4) ensure equal status in research and development funds; 5) embark in public enlightenment campaigns; 6) keep the price of organic farm produces affordable; 7) support regional geospatial analysis and the design of an organic land use and food index. See the Appendix for details on the recommendations.
5. Conclusions
This research assessed the state of organic farming in the US Western region alongside the production potentials and activities among the various states in the zone with valuable results listed in the following order. a) Diverse food and crop types evident in the West; b) land use indicators rising; c) activities linked to many elements; d) mix scale model efficient or appealing.1) Diverse Organic Food and Crop Types Evident From analysis, there is no denying the fact that the study area has emerged as major organic food desert where an environmentally sound agricultural system benign to diverse crops production has rightly turned the spotlight on the awareness of quality, safety and risks for the benefit of consumers in the sector. This coincides with the surge in the array of organic farm indicators deemed as alternative to mainstream agriculture in US western ecozone. With these indicators made up of variety of crop types, farms and food systems which many operators actively engaged in under varying sizes in land areas, in serving the needs of teeming consumers. The glowing outcome pertaining to organic farming in this enquiry partly stems from the widening prospects, the activities in the study area and the attractiveness to the growers bent on meeting consumer desires where greater time and resources have made organics an alternative household food item. This comes from the scale and diversity of organic food items especially the crops originating through the US Western region across time and space. Given the capacity in production and access to consumer markets that draws from the large cultivation of healthy food variety flourishing under different forms over the last several years amidst the burgeoning appeal. The evolution of organic food systems and where it is now, despite some inherent challenges, underscores why the setting aside of vast areas over a period of a decade for the cultivation of multiple farm crops are major steps towards security and variety. This alternative farm system finds itself in a different spot now requiring mandatory labels and certification process in the wake of surging global and local demands for quality and safe food. In that way, looking at what transpired, the Western region not only has everything going its way from institutional infrastructure to certification process for farmers involved in the production of crops or grains, but such standard setting steps for quality control also extends to pastures and rangeland serving grazing needs essential for animal husbandry especially for diary. The millions of acres in certified organic grain land all through 2001-2011, and the average of 200,000 plus acres devoted to multiple crops, once again reinforce the obvious inference that the rudiments of organic food productivity among the various states were built for a long dominance. This is demonstrated in the research and from the fact that the largest producer California, ranks high as a leading exporter in the world. For that, the sheer number of farm operations with certified designation and vast grazing land as a measure of the food production capacity in a handful of areas, were intact and huge enough, to sustain the capacity of farmers whose items served markets and consumers and cities of different kinds in the region and other parts of the country. As a major food basket towering over large areas, the versatility of essential crop types namely, corn, wheat, oats and barley and others and their temporal distribution during 2001 to 2011 exemplifies the promising nature of organic food abundance in the US Western region. More so, aside from a soft start in the initial years 2001-2006, the size of total areas where these multiple crops were planted picked up notable steam in the last two years of 2008 and 2011 instead of fading. This came with a momentum that held firm in the entire region.2) Land Use Indicators On the Rise (Organic Beans and Grainland Abundant and Surging) From the spectra of organic farm activities in the US Western region over the years, two core land use indicators essential in the production most notably certified organic grain and beans land areas stayed on the rise. For the former, the changes can be seen from the surge in the percentage totals representing five different periods between 2001 through 2011 when the size of certified grainland rose remarkably. Being a measure of the performance of the sector during those years, the vast areas estimated in the millions of hectares during 2000 to 2011, reflect the intensity of operations in organic agriculture given the large swath of areas in farmland set aside to grain production. To further show the level of increases in the land use indicators, note that except for only one state, (Colorado) where the drops went from 331,614-164,007 acres during 2001 to 2011, the combined totals of areas devoted to crop cultivation and pasture and rangeland remained on the rise throughout the US western region. In case of the areas of certified organic beans which encompasses soya beans, dry beans, dry peas, unclassified and lentils, the proportion of cultivated areas dedicated to these crops and others rose enormously by over 80% between 2001 to 2011. Worthy of note are the position and huge gains of 3 to 4-digit points in a trio of states (California, Oregon and Washington) while Montana remained the lead area in the percentage levels of overall areas. Among the ten states in the zone, over 50% of them saw notable increases in the size of cultivated beans land area from 2001 through 2011. Access to such large swaths of land areas in the zone in beans crop cultivation amidst the optimal increases, once again reaffirms the abundance and capacity of the states in the production of organic foods. While organic agriculture has come to stay in the zone, the analysis indicates that the study area contains abundant organic grain and beans land essential for production in the region.3) Growth in the sector linked to Many factorsBearing in mind that the genesis of events from agricultural policy to environmentalism had lasting influence on organic food production in US Western region in the last years. Clearly, the enquiry was deeply on focus in locating the various socio-economic and environmental forces that triggered the changes. Thus, several factors located within the larger agricultural structure partly shaped the uptick and viability of organic farms in various states. Among the socio-economic elements, the applications of US agricultural policy instruments beginning with the institution of standards in the fiscal year 2000, in several ways enabled the success of organics by augmenting local farm output that sparked the boom in product orders from buyers. This not only facilitated the widespread penetration of organic foods into US and international marketplaces as tradeable commodities, but when the USDA made organic food the center piece of its policy targets, the proportions of approved operations surged and resulted in more revenues and output. Under the same national policy framework, the USDA enabled the capital inflow to the tune of tens of billions of dollars in marketing transactions. Further, the role of demography in driving the growth in organics stems from the appeal of organic food products to emergent clientele base like millennials and host of others longing for food types devoid of residues of farm chemicals. The penchant of that demographic block for alternative foods produced in organic farms did optimize productive capacity, alongside a growing market access prompted by a teeming population outlook in US western region. The desires for safe and quality products prompted the turnaround in the zone. Under environmental and physical elements, the region boosts of good climatic conditions conducive for organic farm operation and specialty crops that thrive in California’s central area. Just as the feasibility of specialty products in such settings enabled the counties therein to regularly thrive above other places in organic yield. The perception of alternative agricultural food items as products of ecologically benign operations with low exposures to the risks of consuming contaminated products raised its profile with enormous appeal to consumers, hence the surge in the yield capacity over years in the US western region. With the actualization of the potentials for consumers and producers in the study area brought about by the activities associated with these elements, the vast size of the US Western region and the capacities made it a viable frontier for the surge in organic farming activities. Since the farm producers in the US western region have little control over forces that influence sectoral operations, local and global factors continue to shape output and land use, hence their sustained roles on the organic sector. Emphasizing these connections from ecological to socio-economic standpoint on organic farming activities in the US Western region despite meager consideration in the literature stands on its own merits as a key step in research. The takeaway herein is that this enquiry in inserting multiplicity of factors located within the larger agricultural structure, kept these forces at the center of the evolution in organic farming in many states. The idea of a proposed organic food index in the research shall remain indispensable as a planning instrument expected to inform conservation approaches. 4) Mix scale effective and Timely.Furthermore, the timely use of mix scale methodology as analytical device stood out in a big way. Utilizing the model which is comprised of descriptive statistics and GIS mapping as analytical tools provided us a novel way towards regional assessment of organic farming activities. The approach was quite efficient in outlining the area of study and spotting the trends, alongside the gathering of information on the factors and other variables from the size of certified organic grain lands to changes in pastures and rangeland, land under beans cultivation, farm sales, and farm classes. This model remains quite essential in serving the desires of scholars charged with the task of temporal-spatial analysis of variations in organic agricultural land use indicators within multi states in a region. In addition, the geographic mapping of the trends which encompasses GIS analysis shows visible concentration of states where the proliferation of organic farm indicators stayed active across time. Consequently, the GIS mapping as a planning device remained valuable in stressing the diffusion of organic food indices, the level of their spreading and the pattern and weight of their evolution through space. These analytical attributes as indicated from the inferences, affirms the benefits of the enquiry as a preamble to effective management in agricultural land use. The efficiency of GIS in precisely indicating evolving forms of top organic farming states, product demands across markets, the locations of certified farms, size of farm operations and sales through the years, are of great significance as the study area continues its dominance in organic agriculture. This will enable the continual promulgation of land use plans that ensures the wise use of critical organic farm spaces and their monitoring as agricultural protected areas essential in the future of the sector. In that way, it enhances our knowledge of the state of organic agriculture and changes in the critical indicators driving the sector. Even though this is germane in the design of land use index and atlas, it sharpens the ability of managers involved in the ongoing debate shaping conventional farming and organic food sector dichotomy. Considering the rising potentials of organic farming and the activities across the zone and the research findings, decision makers and planners will be fully charged with the task of seeking vital responses to several demanding questions essential to continuous growth, availability and production of organic food for consumers and the markets. The queries consist of which problems could limit future access to organic markets? What emergent factors can shape organic food output? How can local farmers respond to pressures mounted by competitors in the global marketplace? What is the sector doing to address erroneous perception of the profession? Drawing from the design of these questions, opportunities exist for research and policy actions to reaffirm the focus on the regular penetration of safe and quality organic food items into regional and global markets.
Appendix
4.1. Recommendations In the context of the turnaround, policy makers in the USDA and their state counterparts must continue their openness and unconditional support for the growth of organic farming in the US Western region and across the country by drawing from the following suggestions. 1) To survive, organic farms must lean towards periodic tracking of their operations with regular use of precision devices, remote sensing technology and satellites to keep abreast of land use changes and interactions with human activities. 2) Additionally, organic farming should extend beyond the current confines with inroads into ethnic minority communities so as to ensure deeper penetration of the practice to a new generation likely to take it to another level. 3) With the current success, farmers in the sector should not relent in maintaining the very identity that brought them to where they are now as preferred alternative to conventional agriculture across the Western region and the US in general. 4) While the US government efforts in ensuring access to foreign markets for US organic farmers is commendable, the sector should be accorded equal status in research and development funds as applied to mainstream agriculture. 5) The government at all levels, the private sector and the Non Profit organizations should also embark on public enlightenment campaigns on the need for organic farming in a way that will shake off the negative labels entrenched on it by critics 6). To ensure unhindered access in the Western region, the price of organic farm produces must be made affordable for all and sundry, so that people are not left with the impression that such food types are exclusively reserved for certain section of the population. 7) The region also deserves steady spatial analysis, farmland use assessment, and regional organic land information system based on GIS and the design of a digital land use index and an atlas.
References
| [1] | Teng, Chih-Ching (October 2016). Organic Food Consumption in Taiwan: Motives, Involvement, and Purchase Intention Under the Moderating Role of Uncertainty. Appetite. 105: 1: 95-105. |
| [2] | Hjelmar, Ulf. (2011 April). Consumers’ Purchase of Organic Food Products. A Matter of Convenience and Reflexive Practices Appetite. 56: 2: 336-344. |
| [3] | Oregon State University. (OSU.) (2019 Sept). Organic Farming and Soil Health in the Western U.S. E-Organic Webinar Series. Corvalis, Oregon. Oregon State University. |
| [4] | McEvoy, Miles. (2014. September). Organic Trade in The Americas: Inter-American Commission for Organic Agriculture. U.S. Department of Agriculture. Washington, DC 2. |
| [5] | Greene, Catherine. (2015). Growing Organic Demand Provides High-Value Opportunities for Many Types of Producers.. United States Department of Agriculture. Economic Research Service. 2: 1-10. |
| [6] | The Organic Trade Association. (2010 April). Organic Trade Association’s 2010 Organic Industry Survey. Greenfield, MA: The OTA. |
| [7] | Willer, Helga. (2017 February). Organic Agriculture Worldwide Current Statistics. Frick, Switzerland. Research Institute of Organic Agriculture (FiBL). |
| [8] | Youngberg, Garth. (2013 December). Organic Agriculture In The United States: A 30-year Retrospective. Renewable Agriculture and Food Systems. 28:4: 294-328. |
| [9] | Merem, E. C. (2019, February). Assessing Organic Farming Trends in the West Region of the United States”. 2019 Mississippi Political Science Conference (MPCC), Hattiesburg, MS. |
| [10] | Greene, Catherine. (2016 February). Economic Issues in the Coexistence of Organic, Genetically Engineered (GE), and Non-GE Crops. Washington, DC. USDA, Economic Research Service. |
| [11] | Mercier, Stephanie (2017). Straight from D.C Agricultural Perspectives. Farm Journal Foundation. Ag web. |
| [12] | University of Maryland and the USDA (2012). History of Organic Farming in the U.S. College Park, MD Sustainable Agriculture Research & Education (SARE). University of Mary land. USDA Organic Seal. |
| [13] | Reganold, John. (2016 Aug), Can We Feed 10 Billion People On Organic Farming Alone? The Guardian. |
| [14] | Klonsky, Karen, (2011 May) California Dominates U.S. in Organic Agriculture. UCCE Vine Lines, Agricultural and Resource Economics. |
| [15] | Andrea, Carlson. 2016 (May) Changes in Retail Organic Price Premiums from 2004 to 2010. Washington, DC USDA, Economic Research Service. |
| [16] | McBride, William. (2015 July). The Profit Potential of Certified Organic Field Crop Production. Washington, DC. USDA, Economic Research Service. |
| [17] | Rodale Institute. 2019. Can Organic Feed the World.? Kutztown, PA, Rodale Institute. |
| [18] | Dumas, Carol. U.S. 2016. Organic Sales Jump 23 percent in 2016. Salem, OR. Capital Press. |
| [19] | Parr J.F. (1983 February). Organic Farming In The United States: Principles and Perspectives. Agro-Ecosystems. 8: 3:4:183-201. |
| [20] | Driscoll, Laura. (2017 September). Growing Organic, State by State .A Review of State-Level Support for Organic Agriculture. Berkeley, California: Berkeley Food Institute, University of California, Berkeley, https://food.berkeley.edu/organicstatebystate/pp 1-42. |
| [21] | Song. Ki. (2015 October). Measuring the Environmental Effects of Organic Farming: A Meta-Analysis of Structural Variables In Empirical Research. Journal of Environmental Management. 162: 1:263-274. |
| [22] | Palšová, Lucia. (2014 January). The Support of Implementation of Organic Farming in the Slovak Republic in The Context of Sustainable Development. Procedia - Social and Behavioral Sciences. 110:24:520-529. |
| [23] | TuomistoaI, H.L. 2012 (December). Does Organic Farming Reduce Environmental Impacts? - A Meta-Analysis of European research. Journal of Environmental Management. 112: 15:309-320. |
| [24] | Stillerman, Perry (2016). Organic Farming Iis Growing (But Not Everywhere). Cambridge, MA. Union of Concerned Scientists (UCS). |
| [25] | Francis C, (2009) Organic Farming: the Ecological System. Madison, WI: American Society of Agronomy. |
| [26] | Merem, E. C. (2019). Analyzing the Tragedy of Illegal Fishing on the West African Coastal Region. International Journal of Food Science and Nutrition Engineering, 9(1): 1-15. |
| [27] | Merem, E. C. (2019). Assessing Water Resource Issues in the US Pacific North West Region. International Journal of Mining Engineering and Mineral Processing, 8(1): 1-19. |
| [28] | Merem, E. C. (2019). Assessing Issues in Wildland Habitat Management in the State of Mississippi. Frontiers in Science, 9(1): 5-19. |
| [29] | Merem, E. C. (2019). Regional Assessment of the Food Security Situation in West Africa with GIS. Food and Public Health. 9(2): 60-77. |
| [30] | Merem, E. C. (2018). Assessing the Menace of Illegal Wild Life Trade In the Sub Saharan African Region. Advances in Life Sciences, 8(1), 1-23. |
| [31] | Merem, E. C. (2018). Analyzing Changing Trends In Forest Land Areas of Mississippi. International Journal of Agriculture and Forestry, 8(1), 1-15. |
| [32] | Merem, E. C. (2017). Analyzing rice production issues in Niger state area of Nigeria’s middle belt. Food and Public Health, 7(1), 7- |
| [33] | United States Bureau of the Census. (2018). Census Quick Facts. Washington, D.C: US Bureau of Census. |
| [34] | Merem, E. C. (2019). Assessing Water Resource Issues in the US Pacific North West Region. International Journal of Mining Engineering and Mineral Processing, 8(1): 1-19. |
| [35] | Wilson, Mike (2014 Oct 16). Best Places to Farm: West Coast, Pacific Northwest Flaunt High Returns, Hot Demand. Farm Futures. |
| [36] | Maguire, Kelly. (2019 October). Organic Agriculture United States Department of Agriculture Economic Research Service. Washington, DC. |
| [37] | Daniels, Stephen. (Jan-2014) US Organic Food Market To Grow 14% From 2013-18 Jan-2014 -2018. William Reed Business Media Ltd. |
| [38] | Dougherty, Ellen. (2010 February) New Data From USDA Offers In-Depth Look at Organic Farming USDA- NASS News Release. DC Washington, USDA. |
| [39] | Lotter D (2002). Organic farming. Journal of Sustainable Agriculture 21(4): 59–128. |
| [40] | Organic-World - Global Organic Farming Statistics. (2011). United States of America at Organic-World.net Research Institute of Organic Agriculture (FiBL). |
| [41] | Brown, Chery. (2006). Identifying Spatial Clusters Within U.S. Organic Agriculture. Research Paper. Morgantown, WV. Regional Research Institute, West Virginia University. |
| [42] | USDA NASS (2014).Organic Farm Sales Are Booming–And No Prizes For Guessing Which State Is Booming The Most. DC Washington. USDA, ERS. |
| [43] | West, Sarah. (October 2017). Is Organic Farming Just a Trend? Blaine, WA. Organic News and Environment. Nature’s Path Foods. |
| [44] | Sooby J. (2003) State of the States: Organic Systems Research at Land Grant Institutions, 2001–2003. Santa Cruz, CA: Organic Farming Research Foundation. |


 Abstract
 Reference
 Full-Text PDF
 Full-text HTML


