Public Health Research

p-ISSN: 2167-7263    e-ISSN: 2167-7247

2020;  10(1): 1-11

doi:10.5923/j.phr.20201001.01


The Cost-Implications of Reaching Universal Coverage of Maternity Health Services in Siaya County, Western Kenya

Oluoch Felix 1, Ayodo George 1, Owino Fredrick 2, Okuto Erick 3

1Department of Public and Community Health, School of Health Sciences, Jaramogi Oginga Odinga University of Science and Technology, Bondo, Kenya

2Department of Spatial Planning, School of Spatial Planning and Natural Resource Management, Jaramogi Oginga Odinga University of Science and Technology, Bondo, Kenya

3Department of Applied Statistics, School of Mathematics and Applied Statistics, Jaramogi Oginga Odinga University of Science and Technology, Bondo, Kenya

Correspondence to: Oluoch Felix , Department of Public and Community Health, School of Health Sciences, Jaramogi Oginga Odinga University of Science and Technology, Bondo, Kenya.

Email:

Copyright © 2020 The Author(s). Published by Scientific & Academic Publishing.

This work is licensed under the Creative Commons Attribution International License (CC BY).
http://creativecommons.org/licenses/by/4.0/

Abstract

In Kenya, no studies have attempted to model alternative scenarios of the cost-implications of reaching universal coverage (i.e. 95% population coverage) of the existing maternity health services network at the ward administrative level. A cross-sectional study design used publicly available geospatial data in combination with routine data from the web-based district health information software (DHIS2) platform. AccessMod (version 5) was used for scaling up analysis. ArcGIS (version 10.5) sufficed for the preparation of geospatial input and the mapping of AccessMod results, respectively. The geographic coverage of three alternative scenarios to scale up the existing maternity health services network was tested and compared to the status quo. The findings in Siaya County confirm that even if the existing maternity health services network had unlimited capacity, almost 30% of pregnant women would still not be covered. Moreover, targeting the upgrade of hospital facility types currently working beyond their capacity would offer the best value for every additional resource allocated as compared to targeting either health centers or dispensaries, otherwise reaching universal coverage will require the construction of 32 second-tier facilities in Siaya County, as it is the most equitable approach in terms of physical accessibility to maternity health services. Future research should also consider the Lives Saved Tool (LiST) to model the effect of scaling up the geographic coverage of maternal health interventions on maternal mortality in Siaya County.

Keywords: DHIS2, Geographic information systems, Maternity services, Scaling up analysis, Travelling time, Universal coverage

Cite this paper: Oluoch Felix , Ayodo George , Owino Fredrick , Okuto Erick , The Cost-Implications of Reaching Universal Coverage of Maternity Health Services in Siaya County, Western Kenya, Public Health Research, Vol. 10 No. 1, 2020, pp. 1-11. doi: 10.5923/j.phr.20201001.01.

1. Introduction

Kenya is among the countries with the highest burden of maternal deaths in the world (Keats et al., 2018). Maternal deaths in Kenya also vary markedly among its geographic regions, with the highest maternal mortality per 100,000 live births reported in North Eastern and Nyanza regions (KDHS, 2014; MoH, 2016; UNFPA, 2014). Siaya is the worst of the six counties in Nyanza region in terms of obstetric risk ratio, with an unacceptably high MMR of 691 maternal deaths per 100,000 live births, despite receiving the best ranking in terms of its overall readiness to provide maternity health services around the same period (Gok, 2014; UNFPA, 2014). According to routine health facility data from the web-based DHIS2, Siaya County also reported an estimated 66% deliveries in a health facility, despite pregnant women’s preference for health centres and hospitals as compared to dispensaries.
Moreover, maternity health services in Siaya County might indeed be available but inconveniently located, therefore hindering physical access to pregnant women who will never utilize health services or do so infrequently in the predominantly rural county. Moreover, it is currently unknown whether individual facility capacities, different transportation modes (walking versus motorized) and the limited road networks, poor road quality, and diverse terrain affect the supply and demand-side barriers to universal coverage of maternity health care in this region. More importantly, global health policy experts like the World Health Organization (WHO) support the local use of existing geographic information system (GIS) tools like AccessMod (version 5.0) that incorporate the target population, availability coverage and accessibility coverage to expose hidden gaps in maternity health services provision targeting rural and marginalized populations (Ebener et al., 2015; Ebener & Stenberg, 2016a, 2016b; Munoz & Källestål, 2012; Schmitz et al., 2019). However, to date, no studies have attempted to use publicly available geospatial data in combination with routine health facility data, to design alternative scenarios able to model an increase in population coverage that would occur from specific investments aimed at increasing the number and/or capacity of maternity health services across all the 30 administrative wards in rural Siaya County. Therefore, based on current GIS best practices from literature (Ebener & Stenberg, 2016b; Ebener et al., 2019; Makanga, Schuurman, von Dadelszen, & Firoz, 2016; Schmitz et al., 2019), in combination with data on the actual capacities of existing maternity services from DHIS2, the current study was able to take into consideration the inherent inadequacies and travelling times to existing dispensaries, health centres and hospitals to model alternative, yet policy-relevant scenarios, towards a more realistic representation of the cost-implications of scaling-up maternity health services in rural Siaya County.

2. Materials and Methods

Study Area
Siaya is one of six counties in the Nyanza region of Kenya. It has a land surface area of approximately 2,530 km2 and a water surface area of approximately 1,005 km2. It approximately lies between latitude 0° 26´ South to 0° 18´ North and longitude 33° 58´ and 34° 33´ East. The county consists of six sub-counties and thirty wards. Alego Usonga, Bondo and Gem sub-counties have six wards each; Rarieda, Ugenya and Ugunja sub-counties have five, four and three wards respectively; Alego Usonga is thus the largest sub-county with an approximate area of 605.8 km2, while Ugunja is the smallest with an approximate area of 200.9 km2 (Siaya County, 2018).
The female reproductive population was estimated at 222,846, representing 22.7 per cent of the population and was projected to increase to 238,527 and 273,276 persons in 2022 and 2030, respectively. The county’s population density of 318 per square kilometre is further anticipated to increase to 415 and 476 in 2022 and 2030 respectively. In terms of the population distribution by residence, 89 per cent of Siaya County residents currently live in rural areas. As of 2017, the county had 434.2km of standard bitumen roads, 1297.41km of gravel, 532.78 km of earth and a further 1,170 narrow roads. The main development challenges include poor infrastructure, inadequate water supply, erratic electricity supply, high prevalence of HIV/AIDS and high unemployment; as a result, about 47.5% of the total population in the county currently lives below the poverty line (Siaya County, 2018).
Moreover, by 2018, the number of health facilities registered in the county were 220, comprising 11 hospitals (level 4), 50 health centres (level 3) and 159 dispensaries (level 3) (S. O. Nyangueso, P. O. Hayombe, & F. O. Owino, 2018). The County’s uptake of Antenatal care and skilled Birth Attendance was higher than the national average, but it is not certain whether all the demand was met within or there was spillover to neighbouring Counties. According to the last demographic and Health Surveys (DHS), percentage of mothers receiving antenatal care from a skilled provider in the county was 98.5% as compared to 95.5% nationally (KDHS, 2014). Similarly, percentage mothers who delivered in a health facility were 66% compared Kenya’s 61.2%, yet the demand for the maternal services in 2018 was 38,972 annually, as depicted in figure 1 below (S. O. Nyangueso, P. Hayombe, & F. Owino, 2018).
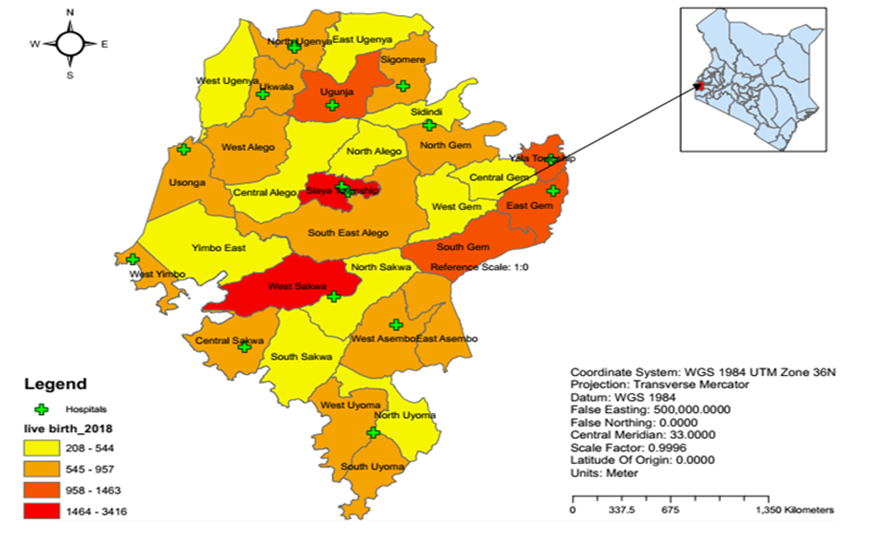
Figure 1. Study Area
Study Design
The current cross-sectional study used publicly available geospatial data in combination with local routine health facility data at the ward administrative level from the web-based DHIS2. Scaling up analysis of maternity health services was simulated using a travel time cost surface model in line with previous spatial accessibility studies based on Tanahashi (1978) framework of evaluating health service coverage (Ebener & Stenberg, 2016b; Ebener et al., 2019; Schmitz et al., 2019; WHO, 2016a, 2016b).
The target population consisted of all pregnant women living within the administrative boundaries of mainland Siaya County in 2018. The study inclusion criteria consisted of only pregnant women who delivered in tier two and three facilities offering free maternity health services. Private and/or for-profit facilities offering maternity health services, including women living outside the administrative boundaries of mainland Siaya County were excluded from the study.
Scaling Up Analysis Software
Modelling of geospatial data was made possible via AccessMod version 5—an open-source and standalone spatial model developed by the WHO (Ebener & Stenberg, 2016a; Ebener et al., 2019; WHO, 2016a), which is freely accessible through the AccessMod official web site (https://accessmod.org) and comes with a user manual and a sample dataset to guide users on the use of its different modules. Moreover, third-party GIS software, ArcGIS (version 10.5), sufficed for the preparation of input data and the manipulation of AccessMod results, respectively.
Sources and Preparation of Input Data
Scaling up analysis using AccessMod 5 required several data sets (see Table 1 below). Both raster and vector data were used as inputs, but the latter was transformed into raster data during the analysis. To mitigate potential resolution issues and ensure compatibility between the different sources of GIS data, and in order to produce accurate results, it was important that an equal-area projection was used for the data in order to avoid strong biases in the surface of the modeled catchment areas, and that meters were used as map units, so that travelled distances were correctly linked to the user-defined travelling speeds expressed in km/h.
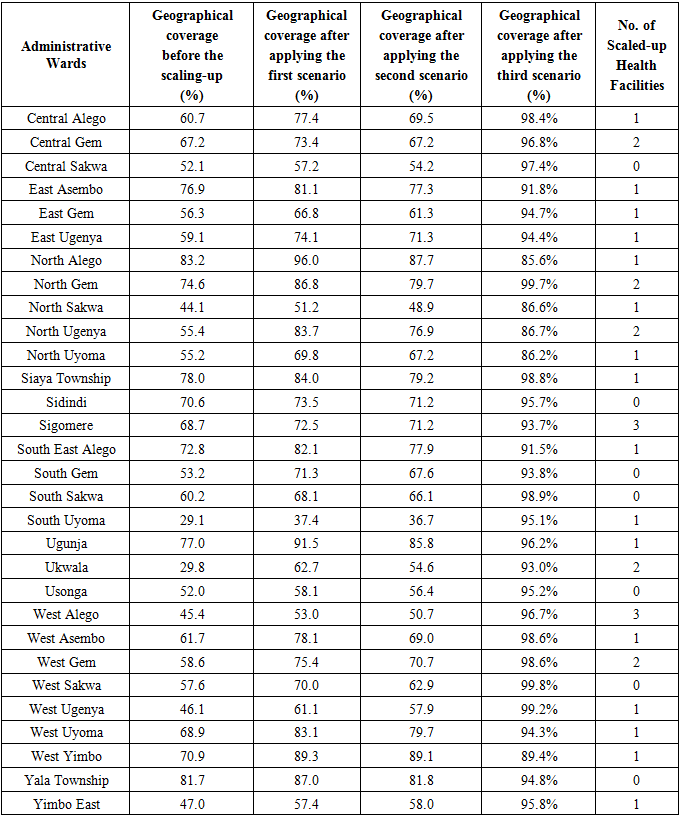
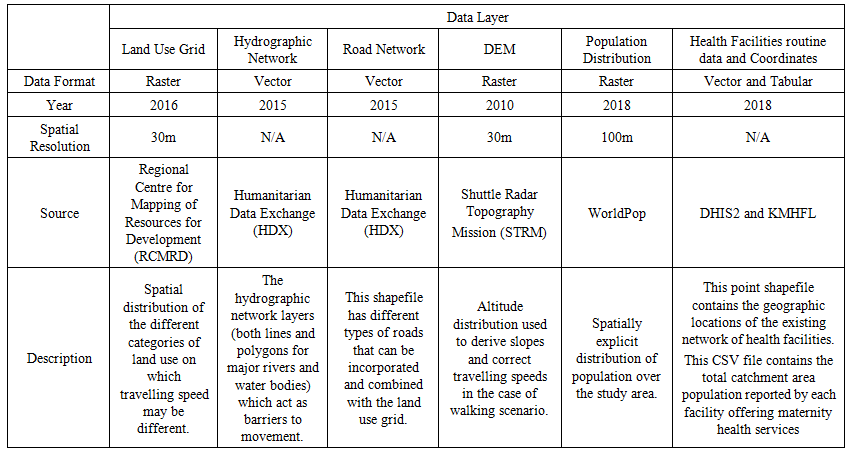
Table 1. Characteristics of the various Input Geospatial Datasets
In particular, the traveling time analysis required to have the following GIS layers at disposal: 1. Administrative boundaries down to the ward level sourced from the Database of Global Administrative Areas (GADM); 2. Geographic point location of all existing facilities offering free maternity health services based on DHIS2, corroborated by the Kenya Master Health Facility List (KMHFL); 3. Road network and 4. Hydrographic network (major rivers and water bodies) were sources from the United Nations Humanitarian Data Exchange portal; 5. Land use/ land cover were sourced from Regional Centre for Mapping of Resources for Development (RCMRD); 6. Digital Elevation Model (DEM) was sourced from Shuttle Radar Topography Mission (STRM) digital elevation model data, at a spatial resolution of 30 meters (1 arc-second), from the U.S. Geological Survey; 7. A 2018 dataset of the spatial distribution of the population for Kenya was obtained from the WorldPop Project (Worldpop, 2019).
Moreover, all the geospatial datasets in raster format were homogenized in terms of projection and 30 m spatial resolution of the digital elevation model (DEM) raster. The Universal Transverse Mercator (UTM) projected coordinate system was sufficient, as the data needed to be projected in a metric system when performing the different geospatial analyses. Even if the population of the urban areas were spatially excluded using urban extent vector data from Global Rural-Urban Mapping Project, towards a more realistic representation of the magnitude of the relationship between existing geographic inequalities and utilization of free maternity health services. All input geospatial datasets were ultimately cropped to the administrative boundaries of mainland Siaya County.
Moreover, user-defined tabular data for each transportation mode with a corresponding travel speed for every combined land cover class, under each travel scenario (walking and/or being carried on a motorcycle), in line with a recent study in Kigoma Region, Tanzania (Chen et al., 2017). Which was important to simulate real-life travel experiences in which travel time may vary by terrains, road types, and transportation used. As such, various sources were used to ascertain the transportation-specific travel speed for each land cover type in the dry season, including a motorcycle analysis conducted in Hanoi, Vietnam (Chen et al., 2017; Oanh, Phuong, & Permadi, 2012).
For routine health facility data, the web-based DHIS2 platform sufficed to collect the total catchment area population for each health facility across all 30 administrative wards in Siaya County.
Geographic Coverage Analysis of Maternity Health Services
To enable the scaling-up analysis, an initial geographic coverage analysis was necessary. As such, both river and road network vector datasets were transformed to raster datasets consisting of 30-meter gridded cells. Also, they were then overlaid on the land cover raster dataset using the merge cover tool in AccessMod 5.0 toolbox. This created a combined land cover raster dataset with ten unique land feature classes, including five road land cover classes. The five non-road land cover classes included dense vegetation, medium dense vegetation, low-dense vegetation, bare areas, and built areas. For analysis, water bodies and rivers were considered to be impassable to any form of transportation.
In particular, the geographic coverage analysis integrated the spatial distribution of maternity health services (supply) and the target population (demand). The catchment area of each facility offering maternity health services was calculated by taking into account its total catchment area population, the population distribution layer, the terrain topography, and the travelling scenarios through the different land categories (see Table 2 below).
The geographic coverage analysis integrated the spatial distribution of maternity health services (supply) and the target population (demand). The catchment area of each facility offering maternity health services was calculated by taking into account its total catchment area population, the population distribution layer, the terrain topography, and the travelling scenarios through the different land categories described in table 2 below.
Table 2. Travel Speeds, per Land Cover Type, by Travel Scenario
     
The extent of the catchment area was thus determined by either the travel time or the catchment population, whichever was reached first-which means that maternity health services that had realized the maximum travel time, but not their maximum capacity, were working below their capacity. On the other hand, health facilities that had reached their catchment population before reaching one hour of the travelling time were operating at their maximum capacity. The model utilized the least-cost algorithm whereby the location of a facility offering maternity health services was selected as the origin. Consequently, the maximum travel time of 60 minutes (in line with the Ministry of Health) was also considered as the limitation for determining the extension of the corresponding catchment area. The model assumes that a patient can only be served by one facility offering maternity services and that mainland Siaya County is a closed system (i.e., the population cannot be served by health facilities outside Siaya County and a population outside the County cannot seek care in it).
Moreover, a vector layer that describes the extent of each facility offering maternity health services was outputted for a combined walking and/or motorbike travel scenario. Thus, each scenario-specific geographic coverage vector layer was represented by a single shapefile based on the existing health facility types (dispensary, health centres or hospital). As such, all 1-hour service catchment areas for the combined walking and/or motorbike travel were mapped in ArcGIS 10.5 to show the extent of the catchment areas within which one can get access to maternity services in less than 1 hour.
Ultimately, the zonal statistics option in AccessMod 5 was similarly used to calculate geographic coverage (%) for each of the 30 wards in Siaya County using the corresponding administrative boundaries vector layer. Therefore, geographic coverage was calculated using the total number of pregnant women per administrative ward level as the denominator, and the proportion of pregnant women within 1 hour of travel time of a facility offering maternity health services with enough capacity to cover the demand in each ward administrative level as the numerator. More specifically, the estimated total number of people per grid-cell was used as a proxy measurement for the distribution of pregnant women in Siaya County.
Scaling up Analysis of Maternity Health Services
Based on the results of the initial geographic coverage analysis. Four scaling-up scenarios aimed at increasing geographical coverage of the existing maternity health services network in Siaya County were tested. In particular, scenario 1 tested the results of a geographic coverage analysis if the population coverage capacities of individual facilities were not a limiting factor (i.e. if facilities had unlimited capacity). Scenario 2 on the other hand, tested the impact of targeted vs simultaneous upgrading of the existing maternity health services network and whether there was a difference across the three health facility types found to be working above their capacity (dispensary, health centres or hospital). Scenario 3 was eventually based on a user-defined “capacity table for new facilities creation” shown below, the sum of the population within a 5km radius and a 60-minute travelling time limit- to model the cost-implication of reaching universal coverage of the maternity health services network in Siaya County (i.e. 95% population coverage). Geographic coverage maps and tables before and after applying the four scenarios in AccessMod were thus produced.
Table 3. Capacity table for new facilities creation
     
Ethical Considerations
The study protocol was approved by the Jaramogi Oginga Odinga University Ethical Review Board in close collaboration with the National Commission for Science Technology and Innovation and the Siaya County health department, division of reproductive health.

3. Results

Summary Statistics from DHIS2: Skilled Delivery Capacity Utilization
According to data from the web-based DHIS2 platform, the total capacity of all health facilities for skilled deliveries across all administrative wards in Siaya County in 2018 was 39,419, yet only 25,755 (66%) of this capacity was effectively utilized, despite almost half (14/30) of the administrative wards in the county utilizing less than 50% of their estimated capacity for skilled deliveries during the same period.
Moreover, in terms of total capacity by health facility type, Dispensaries represented the largest proportion at 41%, and Health Centres followed closely at 34%, despite Hospitals having 22% and Medical Clinics representing the least proportion at only 3% of the estimated skilled delivery capacity in Siaya County. Nevertheless, Hospitals utilized nearly one and a half times (149%) their estimated skilled delivery capacity and Health Centres; on the other hand, utilized 68% of their estimated capacity, despite Dispensaries and Medical Clinic facility types utilizing only 20% and 19% of their estimated capacity respectively, as illustrated in Figures 2 and 3 below.
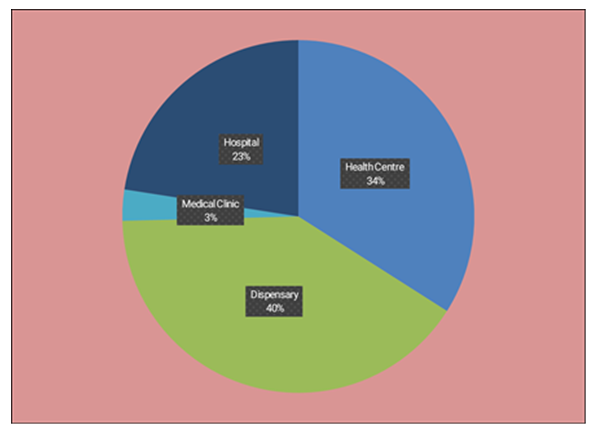
Figure 2. Showing the estimated skilled deliveries capacity across health facility types in Siaya County
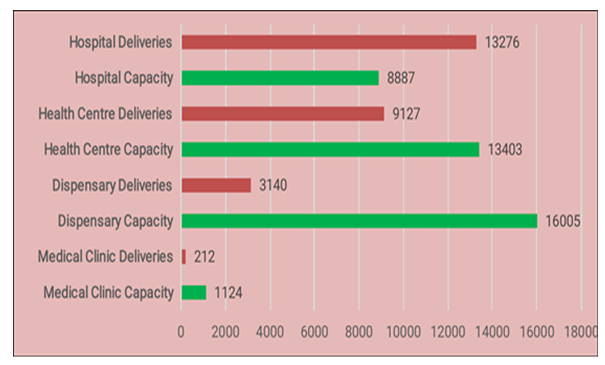
Figure 3. Showing the total deliveries versus the skilled deliveries capacity across all facility types in Siaya County
Geographic Coverage Analysis of the Entire Maternity Health Services Network
The initial geographic coverage analysis of the entire maternity health services network involved 157 facilities; 97 dispensaries, 46 health centres, and 14 hospitals offering free maternity services in Siaya County. This initial analysis was able to model the extension of the catchment area across three health facility types (dispensary, health centres and hospitals). In this initial analysis, the population coverage capacity of each health facility was considered as the size of the supply, and the population distribution grid as the spatial distribution of the demand.
Moreover, the results of the initial geographic coverage analysis of dispensaries revealed that at least 56/97 dispensaries were found to be working above their capacity, yet only 31% of pregnant women across Siaya County could access a dispensary with enough capacity to cover the demand within an hour of travelling time walking and/or using motorcycle transport. Subsequently, at least 21/46 health centres were found to be working over their capacity, yet only 24% of pregnant women across Siaya County could access a health centre with enough capacity to cover the demand within an hour of travelling time walking and/or using motorcycle transport. Similarly, at least 8/14 hospitals were found to be working beyond their estimated population coverage capacity, yet only 15% of pregnant women in Siaya County could access a hospital with enough capacity to cover the demand within an hour of travelling time walking and/or using motorcycle transport.
More importantly, when all health facility types (dispensary, health centres and hospitals) were jointly considered, the geographic coverage analysis revealed that only 63% of pregnant women in the entire Siaya County were covered within an hour of walking and/or using motorcycle transport as shown in the figure below.
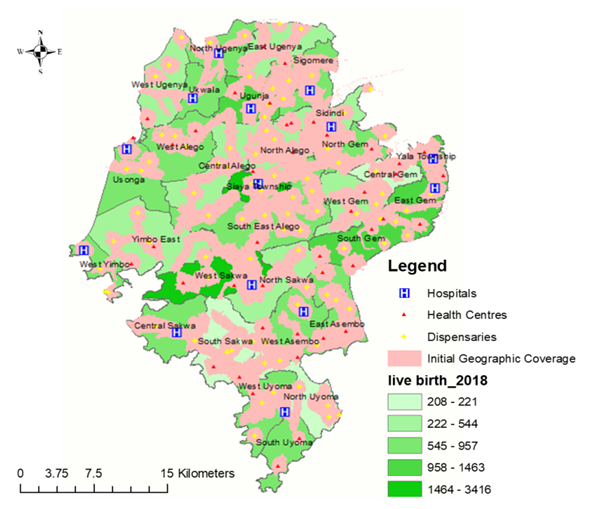
Figure 4. Showing a map of the initial geographic coverage analysis before scaling up
Scaling up Scenario 1: Geographic Coverage Analysis without considering capacities of the existing Maternity Health Services Network
The first scaling up scenario looked at the geographic coverage of pregnant women in Siaya County in a hypothetical situation where the existing network of maternity health services was not limited by its capacity, that is if any given facility within the county could accommodate all the pregnant women living within its one-hour catchment area.
The results of the first scaling up scenario nevertheless reveal that when population coverage capacity was not a limiting factor, only 71% of pregnant women would be covered within an hour of travelling time by walking and/or using motorcycle transport.
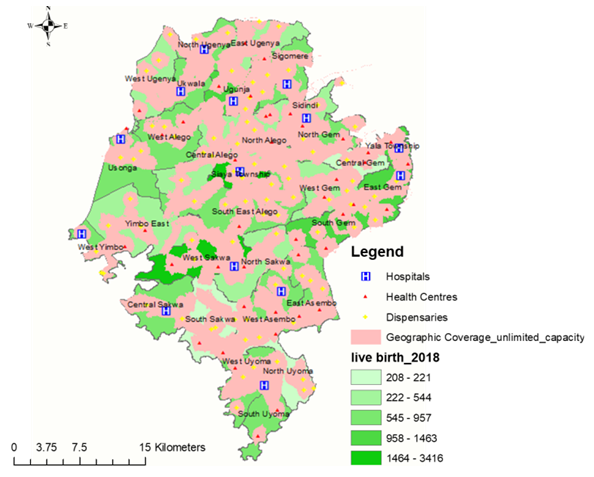
Figure 5. Showing a map of the first scaling up scenario, when the capacities of health facilities is not a limiting factor
Scaling up Scenario 2: Targeted upgrading of the existing Maternity Health Services Network
The second scaling up scenario tested the efficacy of a targeted upgrading of health facility types within the existing maternity health services network. This scaling-up scenario compared the impact of doubling the population coverage capacities across the three health facility types (56 dispensary, 20 health centres and 8 hospitals) that were found to be working above their capacity.
The results of the second scaling up scenario, albeit within an hour of travelling time by walking and/or using motorcycle transport revealed that doubling the capacity of only the 56/97 dispensaries found to be working above their capacity resulted in geographic coverage of 68%. On the other hand, doubling the capacity of only the 21/46 health centres found to be working above their capacity resulted in geographic coverage of 67%. Similarly, doubling the capacity of only the 8/14 hospitals found to be working above their capacity equally resulted in geographic coverage of 67%.
Nevertheless, a decision to upgrade (doubling the capacities) of all the 56 dispensaries as mentioned earlier, 21 health centres and 8 hospitals simultaneously resulted in overall geographic coverage of only 72% as shown in figure 6 below.
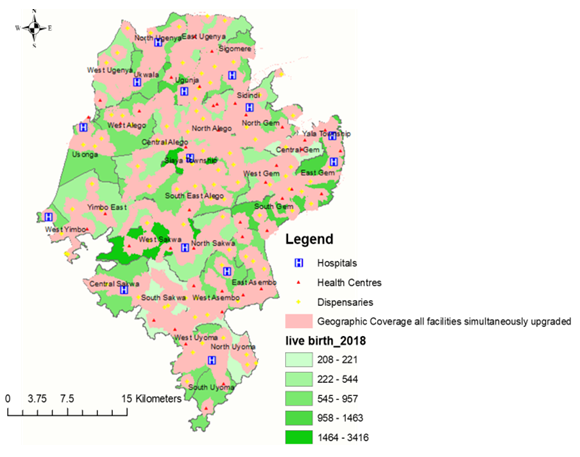
Figure 6. Showing a map of the second scaling-up scenario when all facilities working above their capacity are simultaneously upgraded
In summary, upgrading 56 dispensaries resulted in a 12.2% increase in population coverage capacity of the entire maternity health services network and only a 5% increase in overall geographic coverage of the target population. On the other hand, upgrading 21 health centres and 8 hospitals resulted in an 11.2% and 10.9% increase in population coverage capacity of the entire maternity health services network respectively, despite both leading to a modest 4% increase in geographic coverage of the target population. More importantly, upgrading all 56 dispensaries, 21 health centres and 8 hospitals simultaneously resulted in only a 14.6% increase in population coverage capacity of the entire maternity health services network in Siaya County, despite a 9% increase in geographic coverage of the target population.
Scaling Up Scenario 3: Constructing new facilities to Reach Universal Coverage of the existing Maternity Health Services Network
The final scaling up scenario modelled the cost-implication of constructing new facilities to reach universal coverage (i.e. 95% population coverage). This scenario leveraged the results of the initial geographic coverage analysis of all health facilities offering maternity health services in Siaya County. The analysis was based on the uncovered or residual population (about 32% of the total population of pregnant women) from the initial geographic coverage analysis. As such, the final scaling-up analysis used the sum of the residual population within a 5km radius and a 60 travelling time limit by walking and/or using motorcycle transport-in order to generate the location and the type of new health facilities that would be necessary to expand the current maternity health services network to at least 95% population coverage, albeit based on a user-defined “capacity table for new facilities creation” is presented in table 4 below.
Table 4. Administrative ward-level geographical coverage before the scaling-up and after applying the three scenarios to scale up the existing maternity health services network in Siaya County, Kenya
     
The results of the third scaling up scenario revealed that expanding the existing maternity health services network to at least 95% population coverage will, therefore, require the construction of 32 new facilities, that is, 31 dispensaries with a capacity of 7,500 people and 1 health centre with a 15,000-population coverage capacity. Geographical coverage before and after applying the three scenarios in
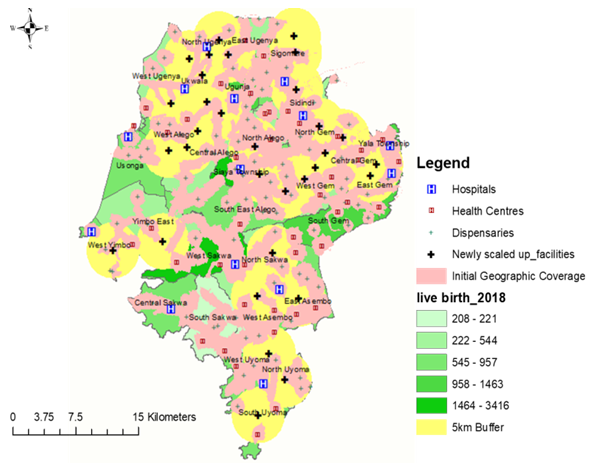
Figure 7. Showing a map of the third scaling up scenario, with the locations and 5 km catchment buffers of the newly created facilities

4. Discussion

The current study succeeded in testing three scenarios designed to scale-up the maternity health services network in Siaya County, Kenya. Moreover, the results from scenario 1 and 2 confirm that neither a blanket nor a targeted upgrading of the entire network of health facilities offering free maternity health services in Siaya County will suffice to reach universal coverage. In particular, scaling up scenario 1 confirms that the major bottleneck is physical accessibility to effective coverage of maternity health services, as most facilities are working below their capacity and the situation would not improve much even if all facilities had unlimited capacity. Besides, the current situation in Siaya County seems to conform to the “inverse care law” that states that “the availability of good medical care tends to vary inversely with the need for it in the population served” (Hart, 1971). The same phenomenon has been observed in many areas of public health, including maternal and child survival strategies (Ahmed, Creanga, Gillespie, & Tsui, 2010; Dalal, Shabnam, Andrews-Chavez, Mårtensson, & Timpka, 2012; Graham, McCaw-Binns, & Munjanja, 2013; Kirkham, Stapleton, Curtis, & Thomas, 2002; Victora, 2008). Hence, in the current era of Sustainable Development Goals (SDG,s) where no one should be left behind, it is imperative to insist on progressive measures directed explicitly at poor, vulnerable or geographically marginalized populations, since alternative retrogressive paths to scaling up the existing maternity health services network may increase overall efficiency but have otherwise been explained to result in widening spatial inequalities in service coverage and associated maternal health outcomes (Ahmed et al., 2010; Choudhury & Räder, 2014; Conning & Kevane, 1999; Dugarova, 2016; Graham et al., 2013; Jaspers & Shoham, 1999; Lawn, Blencowe, Kinney, Bianchi, & Graham, 2016; Ramasundaram, 2002).
Nevertheless, results from the second scaling up scenario confirm that the most significant benefit towards universal coverage of the existing maternity health services network would result form the upgrade of 8 hospitals found to be working above their capacity as compared to the 20 health centres or 56 dispensaries which would require more investment, despite resulting in diminishing returns. For example, The Lancet Commission on High-Quality Health Systems in the SDG’s Era suggests that childbirth services should be centralized to hospitals under the premise that larger volumes will result in (1) more efficient delivery care, (2) more skilful maternity providers and (3) more timely emergency care interventions including blood transfusion and caesarean section (Hanson & Schellenberg, 2019). Moreover, in sub-Saharan Africa, about 90% of the population lives within 2 hours of travel to a hospital, the present benchmark, but only 50% within 30 min, yet this number is even lower in Siaya County, Kenya (Juran et al., 2018). Therefore, Hanson et al., concludes that if we are indeed serious about leaving no one behind, significant investments are needed, both to assist poor rural women to overcome the long distance to hospitals and to build more hospitals to reduce travel time (Hanson & Schellenberg, 2019).
Furthermore, scaling up scenario three confirms that in order to achieve universal coverage of the existing maternity health services network in Siaya County, more facilities will have to be built. The current decision to build 32 more facilities as compared to expanding nearby ones may seem wasteful or even inefficient at first glance, but equity often comes at a price – as does efficiency. Conventionally, in economics, equity and efficiency are often considered conflicting objectives (Davies, 1993; Jehu-Appiah et al., 2008; Kieny et al., 2017; Lindholm, Rosen, & Emmelin, 1996; Rasanathan & Diaz, 2016; Tangcharoensathien, Mills, & Palu, 2015). For instance, it may be efficient to expand more extensive facilities like hospitals currently offering maternity health services concentrated in a small number of large centres or urban areas, but more equitable in terms of physical accessibility to services to allocate more resources to construct a larger number of dispersed, smaller services like dispensaries or model health centres. In contrast, a previous World Bank sanctioned paper on Improving the Delivery of Health Services further explains that performance improvements at the system level and the facility level may be both imperative, and indeed interdependent (Berman, Pallas, Smith, Curry, & Bradley, 2011). System-level initiatives alone are explained to be too blunt an instrument often to improve service delivery across diverse organizations since they also depend a great deal on the desired response by individual facilities and organizations. The same paper also points out that without interventions directed at performance within individual facilities, broader policy reforms may not achieve their full impact, since interventions at the facility level cannot have a substantial and sustained impact on health outcomes if they are not reinforced by efforts that address the entire mix of delivery organizations (Berman et al., 2011). For example, a previous study on targeting health facility-based programs clarified that areas with low accessibility ratios could signify a need for increasing the number of facilities offering the service of interest. It also pointed out that it is worth upgrading existing health facilities that are not currently offering the service of interest, rather than investing in entirely new facilities (Colston & Burgert, 2014).
Hence, in line with recommendations from the Maternal Health Task Force (MHTF), increasing access to and utilization of health care services, Siaya County is not sufficient for improving maternal health outcomes. Five priority actions have since been recommended by the Lancet Maternal Health Series, which focuses on quality of maternal health care around the world: prioritizing quality maternal health services that respond to the local specificities of need, and meet emerging challenges; promoting equity through universal coverage of quality maternal health services, including for the most vulnerable women; increasing the resilience and strength of health systems by optimizing the health workforce, and improve facility capability; guaranteeing sustainable finances for maternal–perinatal health; and accelerating progress through evidence, advocacy, and accountability (Campbell et al., 2016; Koblinsky et al., 2016; Kruk et al., 2016; Shaw et al., 2016).

5. Limitations

A major caveat for the current analysis, as well as for other studies using least-cost path algorithms, is the assumption of a closed system- where women do not seek services outside the study area, yet in actual sense, pregnant women living near borders likely travelled beyond the current administrative boundaries of Siaya County to seek maternity services. There were also minor limitations in terms of time discrepancies and different resolutions between the publicly available geospatial datasets, despite the omission of the few privately-owned facilities that were not offering free maternity health services. Moreover, the current study did not assess other delays related to the decision to seek care and waiting time before receiving care. Theoretically, the scaling-up analysis itself was also affected by data quality, such as incomplete road networks or inaccurate health facility coordinates, despite boat and car travel not being analysed, as the study area was restricted to mainland Siaya County, and because rural women in such a low resource setting with poor road networks, were less likely to rely on car travel.

6. Conclusions and Recommendations

The current analysis has confirmed the feasibility of scaling up the existing maternity health services network in Siaya County. The immediate implication is that upgrading Hospital facility types would result in the most significant benefit, despite requiring the least investment as compared to dispensary and health centre facility types. Moreover, indiscriminate decisions to upgrade all facilities currently working beyond their capacity will not be enough to reach universal coverage (i.e. 95% population coverage), as such policymakers need to explore the option of constructing a larger number of dispersed, second-tier health facilities in Siaya County, as it is the most equitable approach in terms of physical accessibility to maternity health services. Future research should also consider leveraging the Lives Saved Tool (LiST) to model the effect of scaling up the geographic coverage of maternal health interventions on maternal mortality in Siaya County.

ACKNOWLEDGMENTS

I would like to thank the Siaya County Health Department, Division of Reproductive Health and the County Health Management Team for their support.

References

[1]  Ahmed, S., Creanga, A. A., Gillespie, D. G., & Tsui, A. O. (2010). Economic status, education and empowerment: implications for maternal health service utilization in developing countries. PloS one, 5(6), e11190.
[2]  Berman, P., Pallas, S., Smith, A. L., Curry, L., & Bradley, E. H. (2011). Improving the delivery of health services: A guide to choosing strategies.
[3]  Campbell, O. M., Calvert, C., Testa, A., Strehlow, M., Benova, L., Keyes, E., . . . Rong, L. (2016). The scale, scope, coverage, and capability of childbirth care. The Lancet, 388(10056), 2193-2208.
[4]  Chen, Y. N., Schmitz, M. M., Serbanescu, F., Dynes, M. M., Maro, G., & Kramer, M. R. (2017). Geographic access modeling of emergency obstetric and neonatal care in Kigoma Region, Tanzania: transportation schemes and programmatic implications. Global Health: Science Practice, 5(3), 430-445.
[5]  Choudhury, N. Y., & Räder, C. (2014). Targeting the Poorest and Most Vulnerable: Examples from Bangladesh. In Marginality (pp. 101-115): Springer.
[6]  Colston, J. M., & Burgert, C. R. (2014). Using Geospatial Analysis to Inform Decision Making In Targeting Health Facility-Based Programs.
[7]  Conning, J., & Kevane, M. (1999). Community based targeting mechanisms for social safety nets. Department of Economics, Williams College, Williamstown.
[8]  Dalal, K., Shabnam, J., Andrews-Chavez, J., Mårtensson, L. B., & Timpka, T. (2012). Economic empowerment of women and utilization of maternal delivery care in Bangladesh. International journal of preventive medicine, 3(9), 628.
[9]  Davies, B. (1993). Care management, equity and efficiency: the international experience: PSSRU.
[10]  Dugarova, E. (2016). Implementing SDG 1: poverty eradication through family support policies and social protection measures in transition countries. Paper presented at the Expert Group Meeting “Family policies and the.
[11]  Ebener, S., Guerra-Arias, M., Campbell, J., Tatem, A. J., Moran, A. C., Amoako Johnson, F., . . . Matthews, Z. (2015). The geography of maternal and newborn health: the state of the art. International Journal of Health Geographics, 14(1), 19. doi:10.1186/s12942-015-0012-x.
[12]  Ebener, S., & Stenberg, K. (2016a). Investing the Marginal Dollar for Maternal and Newborn Health: Geographic Accessibility Analysis for Emergency Obstetric Care services.
[13]  Ebener, S., & Stenberg, K. (2016b). Investing the Marginal Dollar for Maternal and Newborn Health: Geographic Accessibility Analysis for Emergency Obstetric Care services in Cambodia.
[14]  Ebener, S., Stenberg, K., Brun, M., Monet, J.-P., Ray, N., Sobel, H. L., . . . Bailey, P. J. B. g. h. (2019). Proposing standardised geographical indicators of physical access to emergency obstetric and newborn care in low-income and middle-income countries. 4(Suppl 5).
[15]  Gok. (2014). Kenya Service Availability and Readiness Assessment Mapping (SARAM) Report. In: Ministry of Health Nairobi.
[16]  Graham, W. J., McCaw-Binns, A., & Munjanja, S. (2013). Translating coverage gains into health gains for all women and children: the quality care opportunity. PLoS medicine, 10(1), e1001368.
[17]  Hanson, C., & Schellenberg, J. (2019). Redesigning maternal health services: is centralisation the answer in low-resource settings? BMJ global health, 4(3), e001488.
[18]  Hart, J. T. (1971). The inverse care law. The Lancet, 297(7696), 405-412.
[19]  Jaspers, S., & Shoham, J. (1999). Targeting the vulnerable: a review of the necessity and feasibility of targeting vulnerable households. Disasters, 23(4), 359-372.
[20]  Jehu-Appiah, C., Baltussen, R., Acquah, C., Aikins, M., d'Almeida, S. A., Bosu, W. K., . . . Adjei, S. (2008). Balancing equity and efficiency in health priorities in Ghana: the use of multicriteria decision analysis. Value in Health, 11(7), 1081-1087.
[21]  Juran, S., Broer, P. N., Klug, S. J., Snow, R. C., Okiro, E. A., Ouma, P. O., . . . Alegana, V. A. (2018). Geospatial mapping of access to timely essential surgery in sub-Saharan Africa. BMJ global health, 3(4), e000875.
[22]  KDHS. (2014). Kenya Demographic and Health Survey, 2014.
[23]  Keats, E. C., Macharia, W., Singh, N. S., Akseer, N., Ravishankar, N., Ngugi, A. K., . . . Bhutta, Z. A. (2018). Accelerating Kenya’s progress to 2030: understanding the determinants of under-five mortality from 1990 to 2015. BMJ global health, 3(3), e000655.
[24]  Kieny, M. P., Bekedam, H., Dovlo, D., Fitzgerald, J., Habicht, J., Harrison, G., . . . Mirza, Z. (2017). Strengthening health systems for universal health coverage and sustainable development. Bulletin of the World Health Organization, 95(7), 537.
[25]  Kirkham, M., Stapleton, H., Curtis, P., & Thomas, G. (2002). The inverse care law in antenatal midwifery care. British Journal of Midwifery, 10(8), 509-513.
[26]  Koblinsky, M., Moyer, C. A., Calvert, C., Campbell, J., Campbell, O. M., Feigl, A. B., . . . Matthews, Z. (2016). Quality maternity care for every woman, everywhere: a call to action. The Lancet, 388(10057), 2307-2320.
[27]  Kruk, M. E., Kujawski, S., Moyer, C. A., Adanu, R. M., Afsana, K., Cohen, J., . . . Yamey, G. (2016). Next-generation maternal health: external shocks and health-system innovations. The Lancet, 388(10057), 2296-2306.
[28]  Lawn, J. E., Blencowe, H., Kinney, M. V., Bianchi, F., & Graham, W. J. (2016). Evidence to inform the future for maternal and newborn health. Best practice research Clinical obstetrics gynaecology, 36, 169-183.
[29]  Lindholm, L., Rosen, M., & Emmelin, M. (1996). An epidemiological approach towards measuring the trade-off between equity and efficiency in health policy. Health Policy, 35(3), 205-216.
[30]  Makanga, P. T., Schuurman, N., von Dadelszen, P., & Firoz, T. (2016). A scoping review of geographic information systems in maternal health. 134(1), 13-17.
[31]  Munoz, U. H., & Källestål, C. (2012). Geographical accessibility and spatial coverage modeling of the primary health care network in the Western Province of Rwanda. International Journal of Health Geographics, 11(1), 40.
[32]  Nyangueso, S. O., Hayombe, P., & Owino, F. (2018). Spatial equity in devolved healthcare: geospatially exploring local disparities in maternal healthcare uptake after devolution in Kenya.
[33]  Nyangueso, S. O., Hayombe, P. O., & Owino, F. O. (2018). Spatial Equity in Devolved Healthcare: Is It Quality or Quantity Causing Spatial Clustering in Maternal Health Utilization when Affordability has been Addressed? American Journal of Geographic Information System, 7(3), 88-98.
[34]  Oanh, N. T. K., Phuong, M. T. T., & Permadi, D. A. (2012). Analysis of motorcycle fleet in Hanoi for estimation of air pollution emission and climate mitigation co-benefit of technology implementation. Atmospheric environment, 59, 438-448.
[35]  Ramasundaram, S. (2002). Can India avoid being devastated by HIV?: Yes, by scaling up local prevention efforts targeted at the most vulnerable groups. In: British Medical Journal Publishing Group.
[36]  Rasanathan, K., & Diaz, T. (2016). Research on health equity in the SDG era: the urgent need for greater focus on implementation. International journal for equity in health, 15(1), 202.
[37]  Schmitz, M. M., Serbanescu, F., Kamara, V., Kraft, J. M., Cunningham, M., Opio, G., . . . Goodwin, M. M. (2019). Did Saving Mothers, Giving Life Expand Timely Access to Lifesaving Care in Uganda? A Spatial District-Level Analysis of Travel Time to Emergency Obstetric and Newborn Care. 7(Supplement 1), S151-S167. doi:10.9745/GHSP-D-18-00366 %J Global Health: Science and Practice.
[38]  Shaw, D., Guise, J.-M., Shah, N., Gemzell-Danielsson, K., Joseph, K., Levy, B., . . . Main, E. K. (2016). Drivers of maternity care in high-income countries: can health systems support woman-centred care? The Lancet, 388(10057), 2282-2295.
[39]  Siaya County. (2018). County Integrated Development Plan (CIDP), Siaya County 2018-2022.
[40]  Tangcharoensathien, V., Mills, A., & Palu, T. (2015). Accelerating health equity: the key role of universal health coverage in the Sustainable Development Goals. BMC medicine, 13(1), 101.
[41]  UNFPA, K. (2014). Counties with the Highest Burden of Maternal Mortality. In: Retrieved from UNFPA Kenya: http://kenya. unfpa. org/news/counties-highest ….
[42]  Victora, C. G. (2008). The millennium development goals and the inverse care law: no progress where it is most needed? Journal of Epidemiology and Community Health, 62(11), 938-939.
[43]  WHO. (2016a). Investing the marginal dollar for maternal and newborn health: geographic accessibility analysis for emergency obstetric care services in Burkina Faso. Retrieved from.
[44]  WHO. (2016b). Investing the marginal dollar for maternal and newborn health: geographic accessibility analysis for emergency obstetric care services in Malawi. Retrieved from.
[45]  Worldpop. (www.worldpop.org - School of Geography and Environmental Science, University of Southampton; Department of Geography and Geosciences, University of Louisville; Departement de Geographie, Universite de Namur) and Center for International Earth Science Information Network (CIESIN), Columbia University (2018). Global High Resolution Population Denominators Project - Funded by The Bill and Melinda Gates Foundation (OPP1134076). https://dx.doi.org/10.5258/SOTON/WP00645.