-
Paper Information
- Paper Submission
-
Journal Information
- About This Journal
- Editorial Board
- Current Issue
- Archive
- Author Guidelines
- Contact Us
Public Health Research
p-ISSN: 2167-7263 e-ISSN: 2167-7247
2019; 9(3): 50-55
doi:10.5923/j.phr.20190903.02

Design, Installation, and Performance of Medical Waste Treatment (MWT-P) to Reduce Bacterial Most Probable Number (MPN) Medical Waste
 Abstract
 Reference
 Full-Text PDF
 Full-text HTML
Irfa’i
Environmental Health Department of Health Polytechnic Banjarmasin, Ministry of Health, Indonesia
Correspondence to: Irfa’i, Environmental Health Department of Health Polytechnic Banjarmasin, Ministry of Health, Indonesia.
| Email: |  |
Copyright © 2019 The Author(s). Published by Scientific & Academic Publishing.
This work is licensed under the Creative Commons Attribution International License (CC BY).
http://creativecommons.org/licenses/by/4.0/

Medical waste production of health services is increasing in Indonesia. Based on this research, one Puskesmas produces medical waste between 15-25kg/day [1]. The Legislation requires medical waste to be processed so as not to cause environmental pollution, especially nosocomial. Medical waste processing requires technology and processing costs are very high. The design of the tool Medical Waste Treatment (MWT-P) is an alternative in treating medical waste with costs and technology that is easily accepted. The process of processing this tool includes the stages of washing, drying, and disinfection. The disinfection process uses chlorine doses and uses certain contact times. MWT-P can reduce the number of MPN medical waste bacteria to 99.99%. MWT-P is an affordable and easy to operate a medical waste processing device. MWT-P is part of the framework for controlling and processing Hazardous waste, especially medical waste, healthcare facilities.
Keywords: Most Probable Number (MPN), Treatment, Medical Waste
Cite this paper: Irfa’i, Design, Installation, and Performance of Medical Waste Treatment (MWT-P) to Reduce Bacterial Most Probable Number (MPN) Medical Waste, Public Health Research, Vol. 9 No. 3, 2019, pp. 50-55. doi: 10.5923/j.phr.20190903.02.
Article Outline
1. Introduction
- Infectious waste is very dangerous because it contains various types of diseases and poisons. This clinical waste if not handled properly and correctly, the function or role of the health center or health clinic as a carrier of healthy life for the community will actually be reversed. The Ministry of Health has issued a Minister of Health Decree Number 1204 of 2004 concerning Hospital Environmental Health Requirements, which requires hospitals and Puskesmas to manage their waste [1]. The practice of midwives, the practice of doctors and dentists, medical centers, maternity homes also produce a by-product in the form of infectious sharp waste (containing B3) in small amounts that must be managed [2]. The principle of B3 waste management is from the time it is produced to stockpiling (from cradle to grave) which is a series of activities for storing, collecting, transporting and processing B3 waste including the accumulation of processing products (PP No. 18 of 1999 jo PP No. 85 of 1999).Based on the RPJMN indicators for 2015 - 2019 related to primary health services, namely the number of non-inpatient health centers and inpatient health centers that provide services according to standards, it is expected that 6,000 Puskesmas in 2019 can provide services in accordance with the Minister of Health Regulation Number 75 the Year 2014 concerning Puskesmas. From the results of filling out the self- assessment instruments by the Puskesmas, in 2016 there were 2,692 Puskesmas that had provided services according to standards, from 3,392 Puskesmas that had reported to the center.The number of Puskesmas hospitalized over the past five years has continued to increase, namely as many as 3,152 units in 2012, then increased to 3,411 units in 2016. The number of non-hospitalized Puskesmas tended to fluctuate. This can be seen from the number of non-hospitalized Puskesmas in 2012 which amounted to 6,358 to 6,338 in 2013 and in 2016 increased to 6,356. Increasing the number of inpatient health centers has another impact in the form of increasing infectious waste from the Puskesmas. Health care waste generated according to the national income level of the country, for high-income countries for all health service waste can reach 1.1 - 12.0 kg per person each year, and hazardous health service waste from 0.4 to 5.5 kg per person each year for middle-income countries, all health service waste shows the number 0.8 - 6.0 kg per person per year, while hazardous health service waste is 0.3 to 0.4 kg per person per year, while low-income countries all produce health service waste. 0.5 - 3.0 kg per person each year (WHO, 2005). Based on the results of the study in East Nusa Tenggara, it was shown that the solid medical waste produced was in the form of goods / waste material resulting from patient care, with the volume generated in the inpatient room by 0.74 kg/bed/day, delivery space 0.167 kg/patient/day, emergency department at 0.071 kg/patient day and polyclinic at 0.004 kg/patient day [3]. Based on this research, one Puskesmas produces infectious waste between 15-25 kg/day.The number of infectious waste throughout Indonesia originating from Puskesmas is 95.3 - 158.9 m3 per day. This infectious amount of waste based on the research and observation of infectious waste has not been well managed, considering that there is no incinerator for each Puskesmas, nor for Incinerator operations that are not optimal. Related to the management of Puskesmas medical waste there are obstacles based on observations, namely sometimes accumulation of waste, the role of officers has not been implemented in accordance with their respective main tasks and functions so that there is still waste that has not been dealt with seriously and management of medical waste in Puskesmas is still not known perfect because of the incomplete facilities and infrastructure available. In addition, the management carried out does not meet the requirements of the waste management system and is carried out in accordance with the applicable regulations in the Puskesmas.Given the presence of infectious waste in the Puskesmas that is not well managed, due to the high cost of removing B3 waste, the researchers provide an alternative solution to the problem of the presence of infectious waste. Handling of infectious waste is carried out by processing waste through the stages of washing, disinfection, and destruction as outlined in the design of infectious waste treatment equipment with the name of an infectious waste treatment device for Puskesmas as a temporary solution. The design of this tool is modeling the Washing, Disinfection treatment. Based on previous research, contact time is effective in killing bacteria according to Grace (2004) chlorine ability to reduce bacterial numbers by 99.78% at a dose of 30 ppm, with a contact time of 2 minutes [4]. Therefore in this study chlorine doses were used at 25 ppm and 50 ppm. The contact time used in this study was 5 minutes and 10 minutes. The equipment produced is much cheaper (5-10 million) compared to the Incinerator which has been used to destroy infectious waste at a price of hundreds of millions.
2. Methods
- The study design was experiment Pre and Post only without Control Group design for medical waste and Post without Control Control Group design for wastewater. Research on the design of infectious waste processing equipment is carried out with a Process and quantitative approach also using a qualitative approach. The process approach means that the tools produced are easy to operate and easy to make by themselves by combining several existing markets [5]. Quantitative and qualitative methods were carried out to study the number of bacteria found in medical waste which was processed based on the washing and disinfection process optimally. In the research process, a suitable pattern or formula will be obtained so as to produce quality waste with no infectious potential so that it is safe in the environment. Qualitative and qualitative research uses quantitative and qualitative descriptive analysis.Picture of Design Tool as follows:
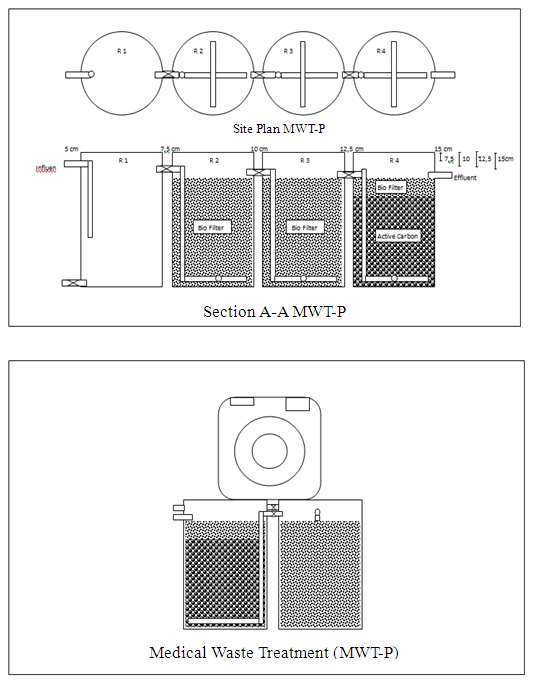 | Figure 1 |
3. Results and Discussion
3.1. Processing Process
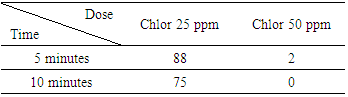
- The processing is carried out by carrying out the collection, sorting, and processing. Medical waste collection is carried out in stages according to sampling capabilities. Medical waste taken from 4 Puskesmas includes Cempaka Health Center, Sungai Besar Health Center, South Banjarbaru Health Center, and North Banjarbaru. Based on the amount of medical waste obtained from four health centers, this tool is able to process according to capacity.The stage of sorting medical waste is done to select waste by differentiating based on its types, among others: bandage, cotton, tape, tissue, mask, plastic wrap, plastic bottles, glass bottles, infusion tubes, gloves, infusion hoses, needles, and syringes. The types of medical waste that can be processed are as follows: bandage, cotton, plaster, tissue, masks, plastic wrap, plastic bottles, infusion tubes, and gloves [9,10].In the process of processing, washing of medical waste is then carried out by the disinfection process. The washing process is carried out for 30 minutes and then disinfection is carried out with a variety of doses and variations in contact time. The dosage variations used for the first experiment used chlorine doses of 25 ppm and 50 ppm. Variation in contact time used 5 minutes and 10 minutes. The measurement results of bacteria (MPN) are as follows:
|
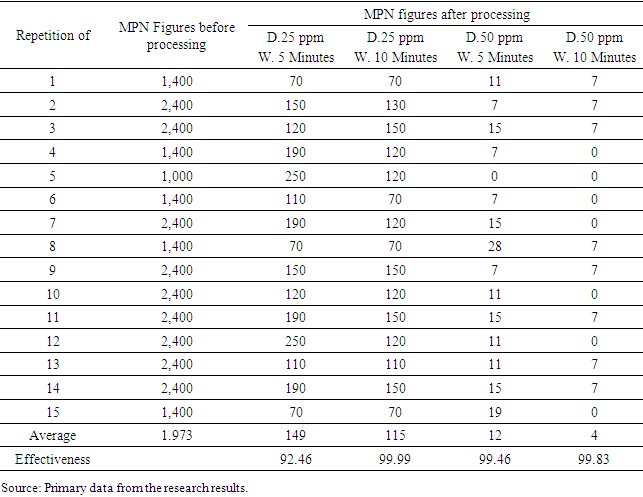
|
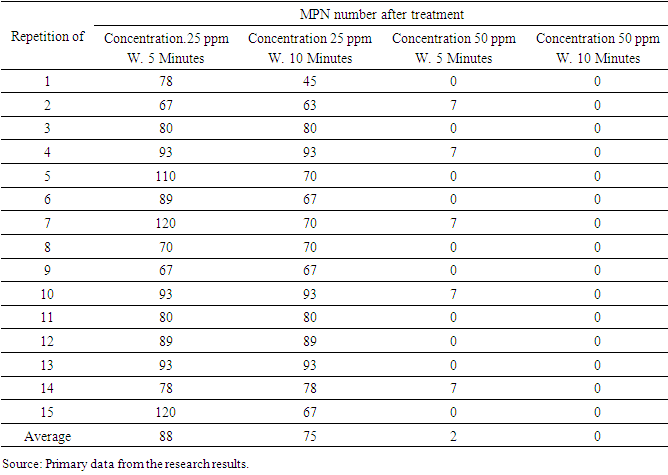
3.2. The Effectiveness of Medical Waste Processing
- The efficiency of treating infectious waste in reducing bacteria in the testing tool was obtained from the results of the bacteriological examination. Efficiency is obtained by calculating the average number of garbage bacteria before it is processed minus the average number of garbage bacteria after processing divided by the average number of garbage bacteria before it is processed multiplied by 100. The results of tool processing efficiency can be seen in the following table:
|
|
4. Conclusions
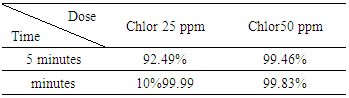
- Manuscripts on the design of infectious waste processing equipment (MWT-P) after treatment of infectious waste, can be summarized as follows: The effectiveness of infectious waste processing equipment in reducing infectious waste Most Probable Number (MPN) bacteria numbers reached 92.49% to 99, 99% and liquid waste. There was a significant difference in the effect of chlorine dose variation on waste MPN bacteria, liquid waste TPC bacteria, liquid waste MPN bacteria, with significant Asimp. Sig 0.00 <0.05. There were no significant differences in the effect of contact time variations on waste MPN bacteria, liquid waste MPN bacteria, with significant Asimp. Sig 0.078> 0.05,. AsimpSig 0.159> 0.05,. AsimpSig 0.197> 0, 05.To maintain and maintain the results of this study in conducting infectious waste treatment must be in accordance with the established processing procedures. To improve the performance of processing results can be done by increasing the washing time to 1 hour and increasing the temperature of the water to 60°C. The design of infectious waste processing equipment can be applied to health care facilities (Puskesmas, Hospitals) which have at least 2200 Watts of electricity and have a water supply with a water pressure of 0.5 atm or 5 m water pressure.
ACKNOWLEDGMENTS
- We would like to thank the Head of the Health Human Resource Development Center as the funder. We also express our gratitude to the Director of the Health Ministry of Health Polytechnic of Banjarmasin for funding support in conducting research as well as all parties that we cannot mention one by one.