-
Paper Information
- Previous Paper
- Paper Submission
-
Journal Information
- About This Journal
- Editorial Board
- Current Issue
- Archive
- Author Guidelines
- Contact Us
Public Health Research
p-ISSN: 2167-7263 e-ISSN: 2167-7247
2018; 8(3): 68-79
doi:10.5923/j.phr.20180803.03

An Econometric Analysis of Effect of Poverty on Health Status in Kenya
 Abstract
 Reference
 Full-Text PDF
 Full-text HTML
Peter K. Musyoka, Jacob Omolo, Julius Korir, Charles Nzai
School of Economics, Kenyatta University, Nairobi, Kenya
Correspondence to: Peter K. Musyoka, School of Economics, Kenyatta University, Nairobi, Kenya.
| Email: |  |
Copyright © 2018 The Author(s). Published by Scientific & Academic Publishing.
This work is licensed under the Creative Commons Attribution International License (CC BY).
http://creativecommons.org/licenses/by/4.0/

One of the most important social-goal world-over is the achievement of good health. This is because, apart from been a fundamental right, it is also an invaluable asset and a prerequisite for improved productivity. However, the benefits associated with good health status may not be enjoyed in the presence of high poverty rates. Thus, poverty reduction is important in ensuring enjoyment of good health. In Kenya, despite the government’s effort to reduce poverty and improve health status of her citizens, poverty has remained high and health indicators have not been impressive either. This paper, therefore, sought to establish the effect of poverty on health status in Kenya. The study used Ordered Probit and the 2013 Kenya Household Expenditure and Utilization Survey dataset to achieve its objective. Estimation results indicate poverty reduction increased the probability of reporting own health as being very good and reduced that of reporting poor health, ceteris paribus. Increase in household size by one member increased the likelihood of reporting own health as being poor other factors held constant. A one year increase in age increased the probability of reporting poor health and reduced that of reporting very good health holding other factors constant. The probability of urban residents reporting own health as being poor was higher than their rural counterparts ceteris paribus. Being employed increased the probability of reporting own health as being very good compared to being unemployed other factors held constant. The study based on the findings concludes that poverty decreases the probability of reporting good health and, therefore, it is important for the government to formulate and implement policies that reduce or eradicate poverty.
Keywords: Poverty, Health status, Kenya
Cite this paper: Peter K. Musyoka, Jacob Omolo, Julius Korir, Charles Nzai, An Econometric Analysis of Effect of Poverty on Health Status in Kenya, Public Health Research, Vol. 8 No. 3, 2018, pp. 68-79. doi: 10.5923/j.phr.20180803.03.
Article Outline
1. Introduction
- Every nation aspires to have a robust economy. To achieve this aim of robust economy, the nation’s productivity must be increased consistently. Productivity can be improved through investing in the nation’s population through education and good health. The effects of good health accrues not only to an individual, but are also extended to the family, community, society and the nation. Poor health leads to reduced working hours; lowered production and productivity; reduced Gross Domestic Product (GDP) and savings and increased health care expenses. Health expenditures, are borne by the individuals and also by the society at large [1, 2]. Because of increased health care expenditures, ill-health leads to switching of expenditure from education and other social development to health care. This switching of costs due to ill health can lead to or increase poverty for an individual or his/her family [1-3]. Poverty, which manifests itself in various forms such as high mortality rate, lack of access to basic education, lack of safe drinking water, lack of main health facilities and shelter can lead to ill health [4-6]. The international community has over time recognized the important linkage between health and poverty. This has seen the world community put effort towards addressing the twin challenges of health and poverty [2, 7]. Kenya has not been left out in poverty reduction efforts and improvement of health for the betterment of her citizens’ lives. Since attaining political independence in 1963, Kenya has put in place policies and programmes aimed at ensuring good health and eradication of poverty in the country. Kenya adopted a number of strategies aimed at reducing or eradicating poverty including strategy of rapid economic growth, the rural development focus strategy, adoption of technology, Structural Adjustment Programmes (SAPs), the basic needs strategy, and Economic Recovery and Wealth creation Strategy [4, 8-10]. However, since 1982 almost about half of Kenyans have been living in poverty as poverty has remained more than 40 per cent. Rural areas have been the most affected. This is despite the government’s efforts to eradicate poverty against a target of 28 per cent by 2015 [8, 11-14].The Kenyan government has also been working hard to improve the health of her citizens. The government has for years emphasised on preventive, promotive, rehabilitative and curative services [15, 16]. The strategies and initiatives are contained in various policy papers such as the Kenya Health Policy Framework Paper (KHPF, 1994-2010) and KHPF (2012-2030). Despite the government’s efforts, when compared with global goals such as millennium development goals (MDGs) and sustainable development goals (SDGs), Kenya made very limited progress in achieving MDGs related to health. Under-five mortality rate was 71 deaths per 1,000 live births in 2015 compared to MDG target of 32 deaths per 1,000 live births. The rate is still way above the SDG target of 25 deaths per 1,000 live births by the year 2030. Maternal mortality rate remained at 362 deaths per 100,000 live births in 2014 against MDG target of 147 deaths per 100,000 live births by 2015 [17]. This is high compared to the set SDG target of less than 70 deaths per 100,000 live births by the year 2030. The high poverty levels if not addressed adequately, Kenya might miss SDGs and its long term development agenda-The Kenya Vision, 2030. This study, therefore, sought to investigate the effect of poverty on health status in Kenya.Previous studies on health status done in Kenya have focused on specific variables such as smoking [18], insurance [19], environmental and socio-economic factors [20] while others focused on specific segment of the population such as children’s nutrition status [21], child survival [22] and child health [23]. Studies that looked at the effect of poverty on health status targeted a specific segment of the population while others controlled for it. Thus, the findings cannot be generalized. This study uses a more recent and a countrywide dataset to have more precise results that can be generalized.Analysis of health is mostly based on the Grossman’s model of human capital [24]. The model indicated that every person has some initial health stock. The model showed that, the initial stock of health for every individual depreciates with age and, therefore, needs to be replenished with investments such as diet, exercise, and health care [24]. Thus, in order to improve health status, health services are needed [24, 25]. According to the model, other inputs that are used by individuals to produce their own health include smoking and consumption of alcohol, nutrition and lifestyle choices such as involvement in risky behaviours and physical exercises, and education, [26-28]. Therefore, the model indicates that the level of health depends on the amount of resources allocated for production by individuals and cannot be treated as exogenous. Grossman [24] opined that health care has a derived demand from demand for good health and therefore cannot be treated like any other good. In the human capital model by Grossman, good health was also argued that has a derived demand from utility. Individual’s productivity is increased by good health. Good health also increases the total amount of time an individual allocates on market (work) and non-market (household) activities. Thus, amount of health demanded is a consumption good and it enters into individual’s utility function directly. Demanded health is also an investment good, since it increases the number of healthy days. The increased number of healthy days enables individuals to participate in income generating activities thereby increasing their earnings.In consumer behaviour theory, every individual has a utility function. Various combinations of goods and services that can be purchased are ranked through the utility function. Individuals are assumed to be rational in this theory. Therefore, individuals are expected to within their budget choose a most preferred bundle of goods and services from the feasible set of consumption bundle. Thus, as rational beings, individuals will generally buy goods and services that will increase their satisfaction level [24]. The Grossman’s model of human capital explains motives why individuals invest in human capital to increase their productivity in market and non-market sectors. The model, therefore, highlights the important role that human capital plays in production of earnings and commodities, which in turn enters into the utility function of an individual [24, 25, 29].The model also incorporated a household production function to explain the gap between health outcomes as an output and health care as an input [25]. Grossman emphasised that some output of household production function enters directly into the utility function. In addition, Grossman [25] differentiated goods and services from commodities. The differentiation was done by presenting commodities as a function of goods and services, and consumer time. Grossman [25], showed that, in order for individuals to produce health, which is a commodity, they had to purchase health services and other goods. Thus, health enters direct into the utility function while healthcare being an input enters the utility function through the health function. Theoretically and empirically, Grossman’s model remains unique in its approach of conceptualising a complex demand for health. This paper is anchored on the Grossman’s human capital model. The model assumes that individuals maximise utility by improving their health through consumption of health care. Households are also assumed to be the primary decision makers in consumption of health care and improvement of health and individuals are part of the household.
2. Methods
2.1. Analytical Framework
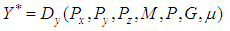
- Following Adeoti and Awoniyi [30], Ajakaiye and Mwabu [31], Mwabu [27] and [23], the study uses a standard economic model of household. The starting point is to maximise utility function subject to health production and income constraints. The household utility
 depends on consumption of health related goods
  , health neutral goods
  , and health status
  specified as:
 | (1) |
 is health related goods;
  denotes the health neutral goods; and
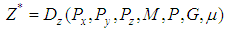
  is health status of an individual. The production of health
  by an individual from equation (1) can be described by the function given as:
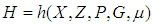 | (2) |
 is market inputs (health investment goods) such as health services;
  is health related goods;
  are control variables;
  are household and geographical characteristics, and
  represents component of health due to genetic traits or environmental factors known to but not influenced by individuals or households [23, 27, 31]. An individual maximizes equation (1) subject to equation (2) and a household budget constraint given by equation (3)
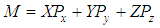 | (3) |
 is household income, and
  are prices of health related goods
  , health neutral goods
  , and health investments goods
  , respectively. Health investment good
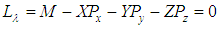
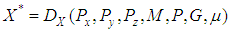
  in equation (2) is assumed to be purchased soley for the improvement of individual’s health. Therefore, it only enters the utility function (equation 1) through health production function
  given by equation (2).Therefore, the utility maximization equation can be specified as:
 | (4) |
 | (5) |
 | (6) |
 | (7) |
 | (8) |
 | (9) |
 | (10) |
 | (11) |
 | (12) |
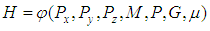
 was self reported assessment of individual’s health. The health status was in four categories namely very good, good, satisfactory, and poor. Thus, supposing that there is a natural ordering of alternatives, a more parsimonious model that takes account of ordering will be necessary. The starting point is therefore a model of the form
 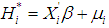 | (13) |
 is a latent (unobservable) variable related to observed health status of individual
  , and
, and  are covariates. Thus, model (13) cannot be estimated as
  is not observed. Instead, what is observed can be constructed as follows:
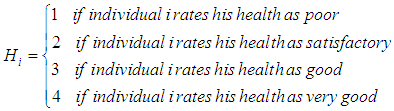 | (14) |
 , that was related to the observed health status of individual
  , through the following equation:
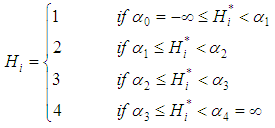 | (15) |
 and
and  are the thresholds to be estimated. The latent variable is in turn related to the various covariates through the following equation:
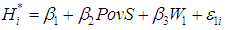 | (16) |
 is the poverty status of individual
  is a vector of controls, and
  is a stochastic disturbance term.The probability of observing a given outcome for a given value of the independent variable can be expressed as:
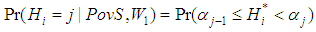 | (17) |
 Substituting equation (13) in to equation (14) and simplifying gives the equation of the predicted probabilities of the observed outcomes as follows:
 | (18) |
 , and
, and  is the cumulative distribution function for
  . Assuming that
  has a standard normal distribution, then the model becomes an ordered probit model, which is estimated in this study.However, poverty is potentially endogenous in health status [3, 18, 23, 30, 34]. This study uses the 2SRI to ascertain and control for potential endogenity. The approach involves two stages in which the first stage involves estimation of the poverty status model to get generalised residuals. The generalized residuals from poverty status model are then in the second stage included into health status model as additional regressor. If the coefficient of the poverty variable residuals is statistically significant in the health status model, then the conclusion is that poverty variable is endogenous [18]. In order to get the generalized residuals, a poverty status model to be estimated is of the form:
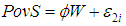 | (19) |
 is exogenous set of covariates comprising of
  variable that also belong to the health status equation plus a vector of instrumental variables
  that affect poverty status, but have no direct influence on health status.
  is a parameter to be estimated, and
  is a stochastic disturbance term. The obtained generalized residuals from equation (19) are then included as an additional regressor in the structural equation of interest (equation 16) to control for endogeneity of poverty status. The resulting equation can, therefore, be written as:
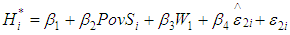 | (20) |
 | (21) |
 is the poverty status of individual
  is vector of controls,
  are generalized residuals from the poverty status model, and
  is a stochastic disturbance term. Substitution of equation (21) into equation (19), and assuming a standard normal distribution for
  , the estimated model can be expressed as:
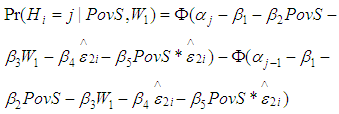 | (22) |
 and
and  is the cumulative distribution function for
  (32).
(32). 2.2. Data and Definition of Variables
2.2.1. Data
- The analyses in this study are based on a cross-sectional dataset from the Kenya Household Expenditure and Utilization Survey (KHHEUS) conducted in 2013 by the Ministry of Health. The dataset was collected from a total of 33,675 households drawn from 1,347 clusters divided into 814 (60%) rural and 533 (40%) urban clusters. The survey covered 44 out of 47 counties in Kenya. Garissa, Mandera, and Wajir counties were not covered by the survey.
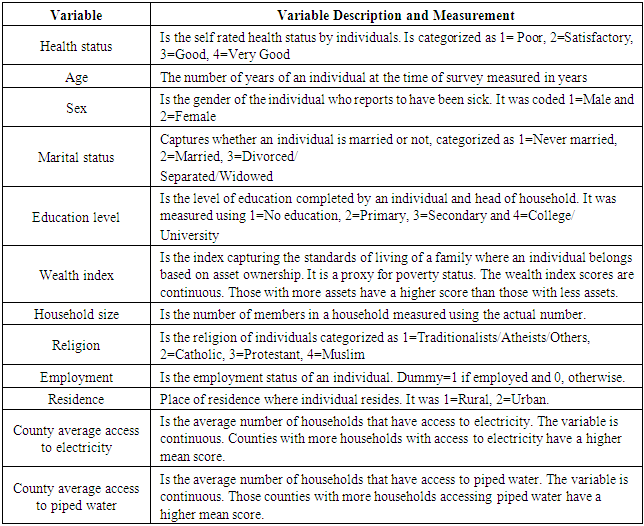
2.2.2. Definition of Variables
3. Results
3.1. Descriptive Statistics
- Descriptive results showed that household size ranged from 1 to 22 members with a mean of about six members. The average age of individuals in the sample was 34.8 years. Wealth index ranged between -0.96 and 1.82 scores with a mean of -0.13 scores and a deviation of 0.55 score. The county index capturing average access to electricity ranged between 0.08 and 0.88, with a mean of 0.25 and deviation of 0.16. The county index for access to piped water ranged between 0.04 and 0.81 with a mean of 0.33 and a deviation 0.20. Concerning health status, 5.68 per cent of the household members surveyed rated own health as poor, and 13.44 per cent rated own health as being satisfactory. The results also indicated that 55.37 per cent of individuals rated own health as good while 25.51 per cent rated their own health as being very good. In the sample surveyed, majority (61.9 per cent) of the household members were Protestants followed by Catholics at 24.5 per cent. Muslims were 10.11 per cent while the traditionalists, atheists and other groups constituted 3.5 per cent of the sampled population. In terms of area of residence, the results revealed that 64.04 per cent of the household members were residing in rural areas while the rest (35.95 per cent) were residing in urban areas. Regarding marital status, the results showed that 53.7 per cent of the household members were married, 36.7 per cent had never married and 9.6 per cent were divorced, separated or widowed. Regarding education, 16.33 per cent of the household members had no education, 45.4 per cent had primary level education, 29.4 per cent had secondary level education and 8.89 per cent had either college or university level education. The results further indicated that 56.65 per cent of the household members were employed while 43.44 were not employed.
3.2. Effect of Poverty on Health Status
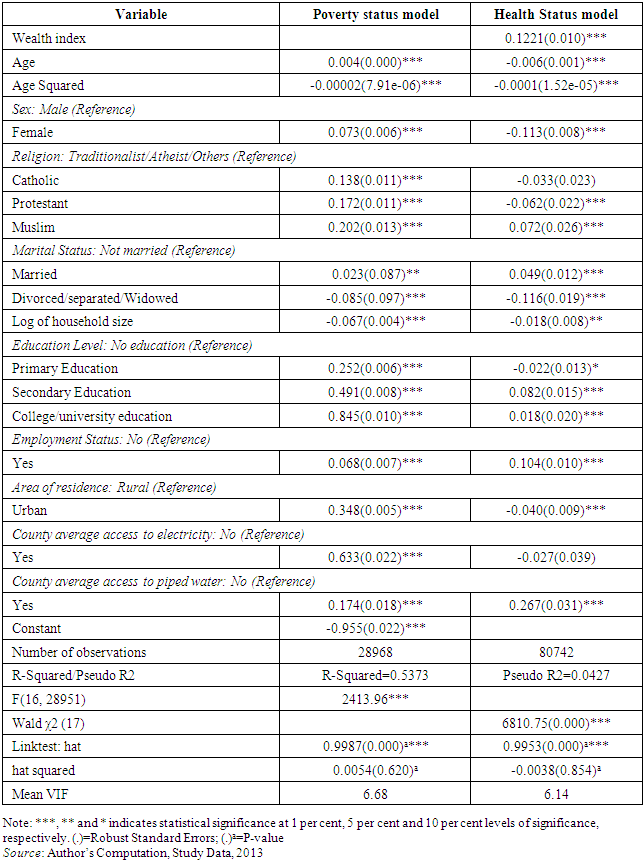
- Table A1 shows results for the test of validity, strength and relevance of the instrument. The estimation results indicated that the instrument highly correlated with endogenous variable with a P-value of 0.000 and a magnitude of 0.633. However it is uncorrelated with the structural error term. Hence, the instrument is valid and strong to be used.
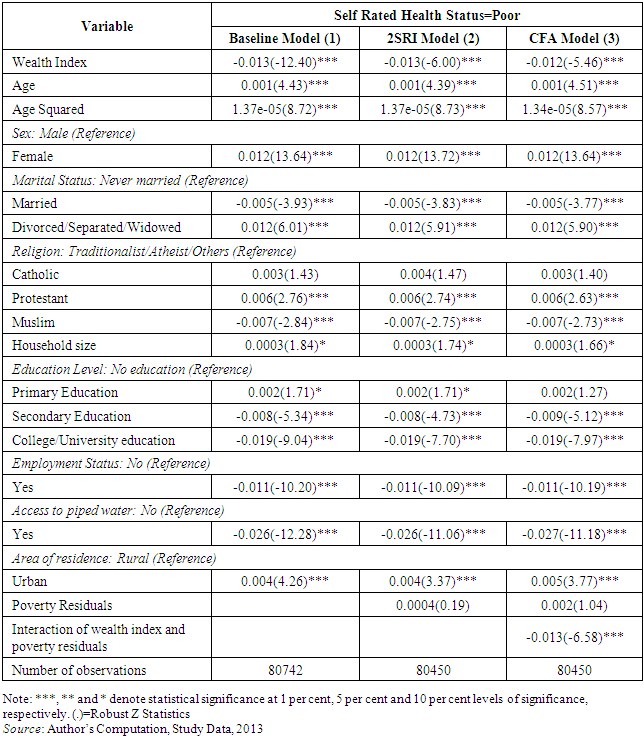
3.2.1. Results of Reporting Poor Health Status
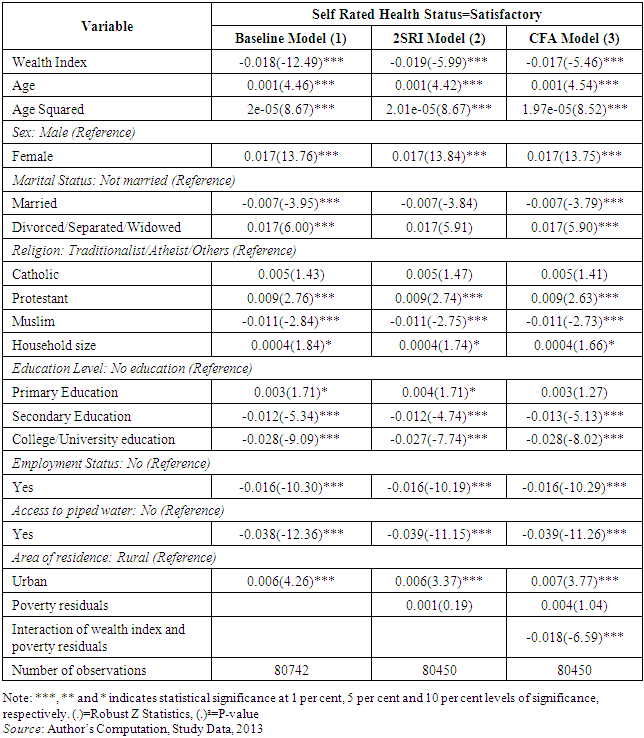
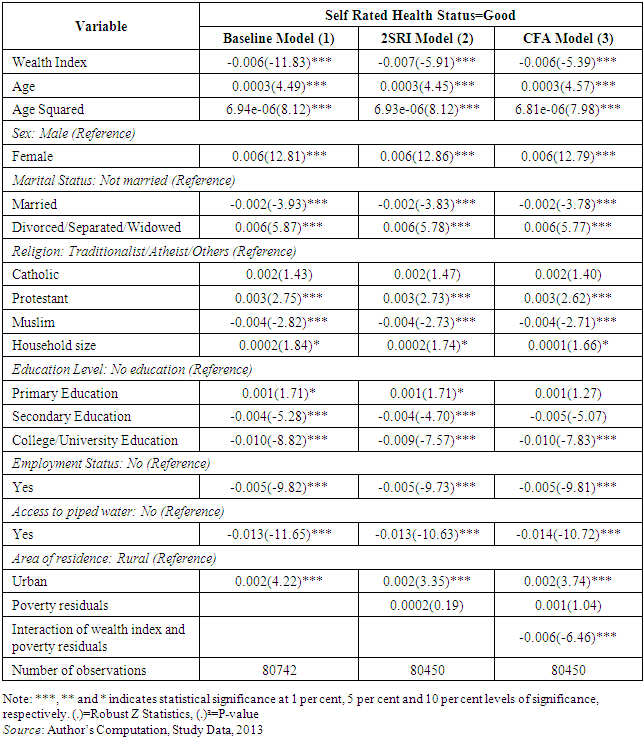
- Results of the first stage of the 2SRI are similar to those presented in Table A1 (poverty status model). However, the purpose of the first stage of the 2SRI was to get the generalised residuals and, therefore, the results are not discussed here. Since health status had four categories namely poor, satisfactory, good and very good, only results of the two extremes (poor and very good) are presented and discussed here for brevity. Results of health status rated as satisfactory and good are presented in the appendix in Table A2 and Table A3. Results of health status rated as poor and very good are presented in Table 2 and Table 3. Each table presents results of the baseline model, which does not control for endogeneity and unobserved heterogeneity, the model controlling for endogenity (2SRI) and the model controlling both endogenity and unobserved heterogeneity (CFA).
|
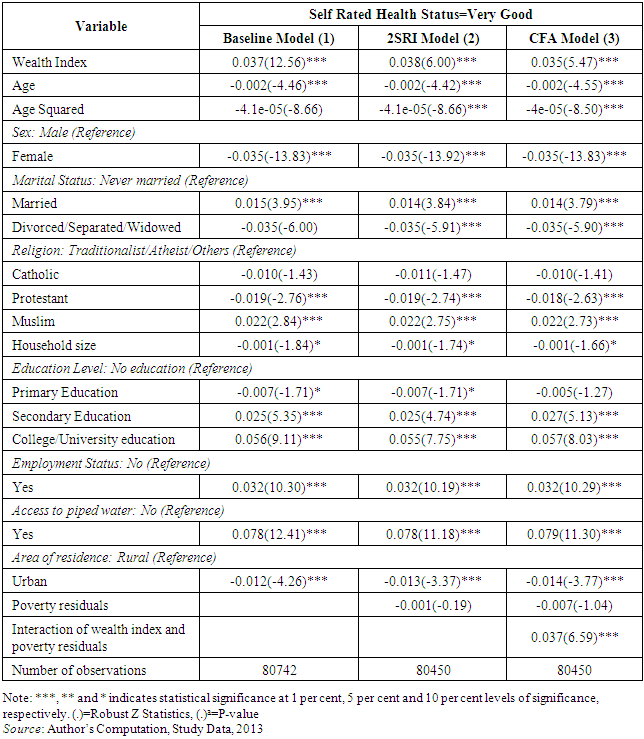
3.2.2. Results of Reporting very Good Health Status
- Table 3 shows the results of the models for the probability of rating own health as very good. Table 3 shows the average marginal effects. Three different models are presented. Baseline model is the first one. The model does not control for endogeneity and unobserved heterogeneity. The second model is the 2SRI, which controls for endogeneiy. The last model is the CFA, which controls for endogeneity and unobserved heterogeneity.Results presented in Table 3 on endogeneity test indicate no evidence of endogenity since the 2SRI results, show that generalized residuals of poverty are statistically insignificant. Further, CFA results show evidence of unobserved heterogeneity as the interaction of poverty status and its residuals is statistically significant. Thus, the preferred model is the CFA since it controls for the unobserved heterogeneity and so the results are not biased.
|
4. Discussion
- This study investigated the effect of poverty on health status in Kenya. According to findings from the Control Function Approach, increase in wealth index increases the probability of reporting own health as being very good and reduces that of reporting own health as being very poor, other factors held constant. The finding confirms that a decrease in poverty minimizes the probability of reporting poor health and increases that of reporting very good health. This may be due to higher purchasing power of the wealthy. Hence, wealthier people can afford balanced meals, clean drinking water, and good shelter. Thus, they are less likely to suffer from nutrition and water related diseases. They are also able to afford health care in case of illness/injury. The importance of poverty reduction in influencing the level of health status is consistent with what other studies in Kenya [18, 36] and other studies [37-41] elsewhere have found.A possible explanation of the result that increase in age increases the probability of reporting poor health and reduced that of reporting very good health is that, as individuals advance in age, they are more likely to experience life threatening health events. As children grow, they start exploring outside life that may expose them to diseases. Adolescents may start experimenting with their bodies trying to discover themselves and hence engage in risky behaviours. Adults on the other hand may engage in risky income generating activities. Other studies in Kenya [18, 19, 36] and elsewhere [42] support this finding.The finding that females were more likely to report poor health and less likely to report very good health compared to males can be explained by the social, cultural, economic and biological factors that all impact negatively on the health of females compared to males [43, 44]. Females are less empowered economically and in most societies are looked down upon. This may have a negative influence on their health especially where they have to ask for financial assistance for them to seek medical care. This finding is consistent with other studies that have found that females were more likely to report poor health compared to males [18, 36-38, 45].The higher likelihood of those married and the lower likelihood of the divorced/separated/ widowed compared to those who never married reporting very good health status could be due to benefits of marriage. According to resource model, the married are more likely to command more resources especially if the spouses are engaged in income generating activities [46]. The married may also be psychosocially fit and hence may not suffer from depression and anxiety related diseases due to family support. The finding is supported by other studies in literature [18, 36, 38].The result that increase in household size increases the probability of reporting poor health and reduces that of reporting very good health could be due to increased competition for the limited household resources and basic necessities such as shelter, food and clothing. Increased competition may have a negative impact on health. For instance, members from congested households may suffer from airborne and other communicable diseases. This finding is consistent with Gakii [19] on Kenya who found a negative relationship between household size and probability of reporting very good health.The lower probability of reporting poor health and a higher probability of reporting very good health by those with higher levels of education compared to those with no education could be due to empowerment educated individuals have. Individuals with higher levels of education are more informed about health and its importance. Therefore, they are more likely to engage more on preventive and promotive health care. The educated are also more likely to get employed and earn income, which they may in turn use to purchase health care and other health promoting services. This finding is consistent with Teerawichitchainan and Knodel [41] on Myanmar, Bora and Saikia [38] on India, and Awiti [18] and Gakii [19] on Kenya. Being employed reduced the probability of reporting poor health and increased that of reporting very good health other factors held constant. This could be because employment serves as an empowering role through enabling better access to health care. Employed individuals are able to earn income, which they can use to invest in their health through purchasing health care, balanced meals, quality shelter and also exercising [19, 43].The results that residing in urban areas increased the probability of reporting poor health and decreased that of reporting very good health compared to residing in rural areas, other factors held constant, could be because about 60 per cent of Kenya’s urban households reside in informal settlements where basic amenities are lacking and chances of contracting communicable diseases are high [47]. The finding that residing in urban area increased the probability of reporting poor health is consistent with Gakii [19] on Kenya, and Teerawichitchainan and Knodel [41] on Myanmar. However, the finding contradicts those of Ahmad, Jafar [37] on Pakistan and Bora and Saikia [38] on India.
5. Conclusions
- The main conclusion from this study is that poverty reduces the probability of individuals reporting very good health, other factors held constant. This in other word means that, poor individuals have a higher likelihood of reporting poor health compared to their counterparts who are not poor other determinants of health status held constant.Therefore, since a major social goal of many countries is to ensure that citizens enjoy good health, the findings of this study imply that one way of improving health status is through formulation and implementation of policies and strategies that are aimed at reducing or eradicating poverty in Kenya. In the short term, the government may cushion the poor by introducing health based voucher programmes. In the long term, government should introduce universal health care, increase employment opportunities, invest in social safety nets for the aged and the poor, and increase sensitization on the need for reduced household sizes and invest in family planning programs.