-
Paper Information
- Next Paper
- Paper Submission
-
Journal Information
- About This Journal
- Editorial Board
- Current Issue
- Archive
- Author Guidelines
- Contact Us
Public Health Research
p-ISSN: 2167-7263 e-ISSN: 2167-7247
2018; 8(2): 35-45
doi:10.5923/j.phr.20180802.02

Trends, Pattern and Socioeconomic Predictors of Underweight among Young Married Women in Nigeria
 Abstract
 Reference
 Full-Text PDF
 Full-text HTML
Yusuf OB, Gbadebo BM, Afolabi RF, Adebowale AS
Epidemiology and Medical Statistics, Faculty of Public Health, College of Medicine, University of Ibadan, Nigeria
Correspondence to: Yusuf OB, Epidemiology and Medical Statistics, Faculty of Public Health, College of Medicine, University of Ibadan, Nigeria.
| Email: |  |
Copyright © 2018 The Author(s). Published by Scientific & Academic Publishing.
This work is licensed under the Creative Commons Attribution International License (CC BY).
http://creativecommons.org/licenses/by/4.0/

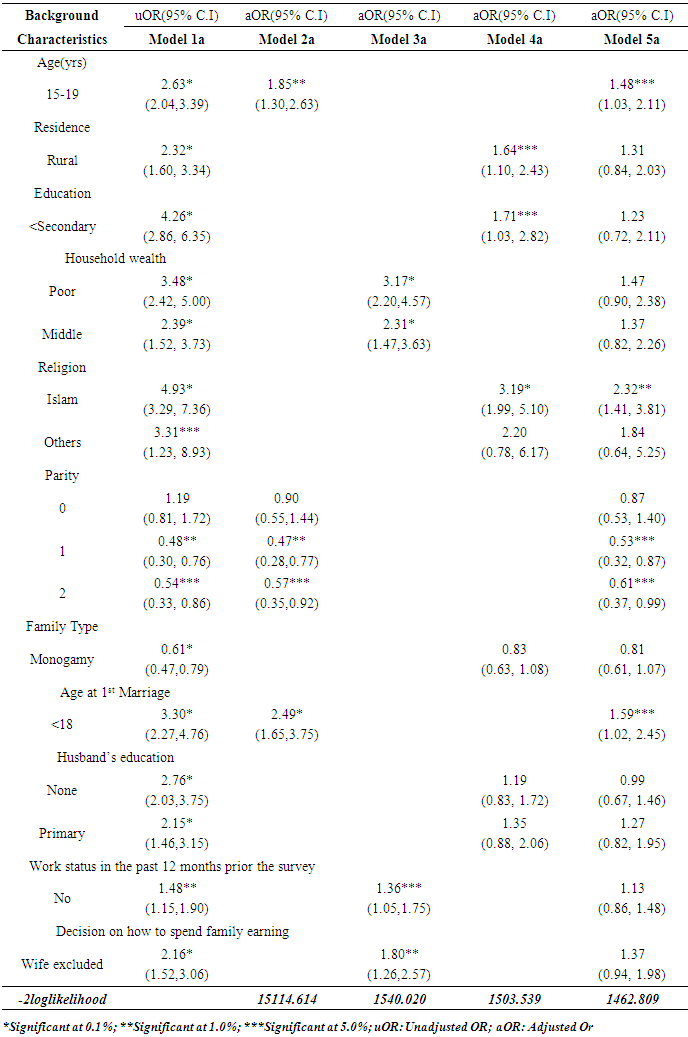
We determined the prevalence, pattern and socioeconomic predictors of underweight among young married women (15-24yrs) in Nigeria. Two rounds (2008; n=1681 and 2013; n=3596) of a nationally representative data were analyzed. Descriptive statistics and logistic regression model were used. The proportion underweight was higher in 2008 (18.6%) than in 2013 (15.6%). In 2008, the proportion underweight was 24.0% and 8.4% among poor and rich women respectively. The proportion of underweight women reduces as household wealth increases. The likelihood of underweight was lower among participants who had one (OR=0.47; C.I=0.28-0.77, p<0.01) and two (OR=0.57; C.I=0.35-0.92, p<0.05) compared to those who had ≤3 children. The odds of underweight was higher among women who married at ages below 18yrs (OR= 2.49, C.I=1.65-3.75, p<0.001) compared to those who married at >18yrs. Underweight is still common among young married women; early marriage is a potential risk factor while lesser number of children is protective.
Keywords: Underweight, Early marriage, Poverty, Nigeria
Cite this paper: Yusuf OB, Gbadebo BM, Afolabi RF, Adebowale AS, Trends, Pattern and Socioeconomic Predictors of Underweight among Young Married Women in Nigeria, Public Health Research, Vol. 8 No. 2, 2018, pp. 35-45. doi: 10.5923/j.phr.20180802.02.
Article Outline
1. Introduction
- World-wide, underweight among young women is becoming a problem of public health importance most especially in low income countries like Nigeria. Underweight is a measure of nutritional deficiency which has current and long term consequences on the overall well-being of individuals particularly the youths. The World Health Organization (WHO) defines the period of youth as a time which overlaps with the period of adolescence and extends from 15 to 24 years of age. The youth period characterizes a time during which specific health problems can be addressed for healthy growth and development in later part of life. [1] About 50% of adult bone mass including: muscles, skeletal system, other vital organs of the body and 20% of total height gain occur at this period [2, 3].Studies have reported that young girls usually experience the maximum increase in weight and height in the year preceding menarche [4, 5]. Additionally, in the Nigeria context; it is a necessity that a married couple shows evidence of fertility few months after marriage irrespective of the age of the bride. Therefore, in young married women, nutritional demand is high in order to meet the physiological requirement for development and combating some health challenges of childbearing and child rearing [6]. Due to the importance of adequate nutrition for socioeconomic advancement of a nation, the United Nations included it as one of the key components of the Millennium development goals (MDGs) which was to be accomplished by year 2015. Unfortunately, many developing countries did not meet the target at the deadline, thus it re-emerged as part of the themes of Sustainable Development Goals (SDGs) to be met by year 2030 [7, 8].Being underweight has been reported as a risk factor for many diseases such as: osteoporosis, osteoporotic fractures in later life, low bone mineral density, anemia, reduced sex hormones, hypotension, feelings of fatigue and malaise. [9] [10]. Maternal underweight also has harmful effect on the nutritional status of the fetus which serves as a contributing factor for low birth weight, poor growth of the head circumference in the new born and infant mortality [6]. Inadequate growth resulting from undernourishment among young females has been implicated in the literature as having negative consequences that are related to: childbearing, increased risk of pregnancy complications and implications for caesarean delivery [11]. Furthermore, underweight during young adulthood has been linked with inadequate nutrition, poor Quality of life (QoL), morbidity and maternal mortality [12] Research is also consistent with the link between underweight and early marriage. [13] Consequently, achieving optimal growth among young married women in terms of adequate height and weight is crucial.Early marriage among young women is still a common practice in some cultures in Nigeria. [14, 15]. Child brides are often not physiologically or fully developed to give birth and this has been reported in previous studies as having serious health consequences both on the mother and the baby [16-18]. Studies have shown that maternal mortality is higher among women below age 20 years than those in their 20’s or 30’s [19-21]. Young women are more likely to experience preterm delivery/ obstructed labor, obstetric Fistula, low birth weight and mortality [22, 23, 17, 24]. The health problems associated with early marriage are peculiar to most young women in Nigeria and most of these challenges can be alleviated if young married women have sufficient nutritional requirements. Regrettably, poverty ravages the nation and majority of Nigerians live below the poverty line. The health service delivery is worrisome and not affordable by the poor who constitutes majority of the Nigerian population. In Nigeria, social and gender discrimination against women at the household level puts young married women at higher risk of nutritional deficiencies. Young vulnerable females have been reported to have inadequate education and poor access to health and nutrition services [25, 26]. Preference for the male child and discrimination against the female child though starts at early ages [27] increases throughout the youth period. In addition, traditional values and some cultural roles put pressure on the girl child in some cultures in Nigeria [28, 29].Underweight among young married women has been extensively studied in countries like Japan, Thailand and a host of others but few studies have investigated this problem among married female youths in Africa especially in Nigeria where underweight remains a major challenge. The available studies have only focused on obesity in young women and underweight among women of reproductive age. Information about underweight among young married women is needed for the development of appropriate policies and programs to improve their nutrition and overall health. Therefore, in this paper we present a trend analysis of a nationally representative data on underweight status of young married women aged 15 – 24 years in Nigeria between 2008and 2013. Specifically, we determined the prevalence and examined the pattern of underweight among young married women in Nigeria. We also identified the socioeconomic predictors of underweight among young married women in Nigeria.
2. Methods
- Study areaThe study was conducted in Nigeria, Africa’s most populous country. The population pyramid for Nigeria show that a reasonable proportion of the populations are young women aged 15-24 years. The level of teenage pregnancy and adolescent childbearing in Nigeria is 5% and 23% respectively [30]. The country is predominantly rural and a higher proportion of women of reproductive age are still illiterates. The poverty rate is 43.1% in urban areas, 63.8% in rural areas and the unemployment rate is high [31]. Maternal mortality ratio in Nigeria is 576 per 100,000. [30]. There is availability of food crops but in most situations, the foods are not affordable by majority of the populace. The health service delivery is poor and collapse in social infrastructures has been experienced in the past few decades and as such, life expectancy is low.Study design and sample selectionThe 2008 and 2013 Nigeria Demographic and Health Surveys used cross-sectional design approach and the data was nationally representative. During the survey, cluster sampling approach was used to select the respondents based on allocation of specific numbers of clusters to rural and urban settlements in the country. Different questionnaires were designed to obtain information related to men, women, household, couples and children. The validity and reliability of the questionnaires have been previously reported. [30]. However, the current study used the women questionnaire and data analyses were based on married women aged 15-24 years. Thus, 1681 and 3596 records of women who provided complete information on the explanatory variables included in this study and have their mass in kg and height in meters measured at the time of the survey were analyzed. Pregnant women, lactating mothers and those whose height and mass could not be measured as a result of illness were excluded from this study.Variable descriptionThe dependent variable is Body Mass Index (BMI) which was used as a measure of nutritional status of young women. The BMI was generated from two variables; mass in kilograms (kg) and height in meters (m) mathematically represented as;
 with the unit measured in
  . During data collection, mass and weight were captured with the use of weigh balance calibrated in kilogram and tape rule respectively.
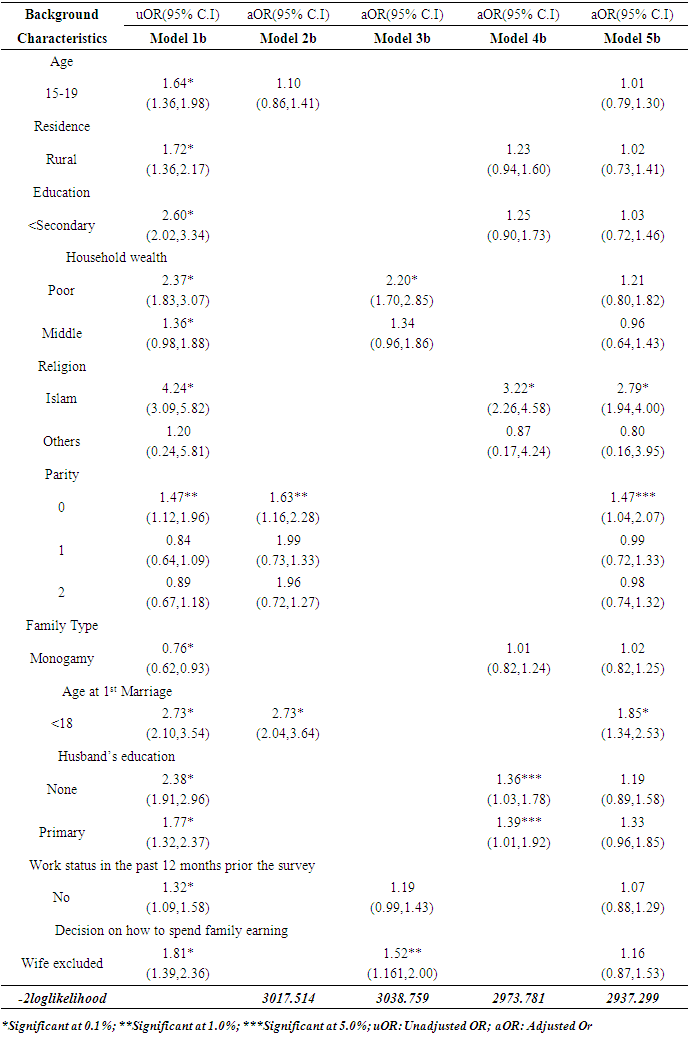
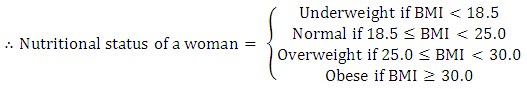 However, in the course of data analysis at the level of multivariate, the nutritional status was reclassified into two categories as; underweight =1 and others =0 with underweight as a status category. The explanatory variables are; age, parity, age at 1st marriage, household wealth, work status in the 12 months prior to the survey and decision on how to spend family earnings. Others are; place of residence, education, family type and husband’s education.Data analysisThe data were weighted before use by creating a new variable from the variable called ‘sampling weight’ which was included in the original data set. Weighting of the data set became necessary because cluster design approach was used during the data collection exercise for 2008 and 2013 NDHS and this will extrapolate and take into account of other areas not included in the clusters during the surveys. Data were analyzed using descriptive statistics, Chi-square and logistic regression model. Frequency distribution was used to present the data and Chi-square test was conducted to determine factors that are significantly associated with body mass index as a measure of nutritional status. At multivariate level of analysis, logistic regression was used due to dichotomous nature of the dependent variable to identify the predictors of underweight among the studied women. At this stage of analysis, five models were used to describe the relationship between underweight and background characteristics of the studied subjects. The variables included in each of the five models are as follows. Model 1 is the bivariate model while model 2 is a multivariate model that involves a dependent variable (underweight) and demographic variables (Age, Parity and Age at 1st Marriage). Models 3 and 4 included only the dependent variable and economic (Household wealth, Work status in the past 12 months prior to the survey and Decision on how to spend family earning) and social (Residence, Education, Family Type and Husband’s education) explanatory variables. In the last model all variables found to be statistically significant at bivariate level were included in the model in order to identify the important predictors of underweight among the studied women. All statistical tests were performed at 5.0% level of significance. The logistic regression model is of the form;
 Where p is the proportion of women who are underweight and βi are regression parameters to be estimated with exponential of β being the odds ratio and
  , are the explanatory variables. All analyses were done using IBM SPSS version 20 [32]. Ethical considerationEthical approval was obtained from the National Ethical Review Board of the Federal Ministry of Health before conducting the survey. Informed consent was obtained from the study participants at the point of data collection and all the consented participants were assured of confidentiality and anonymity of the information they supplied.
3. Results
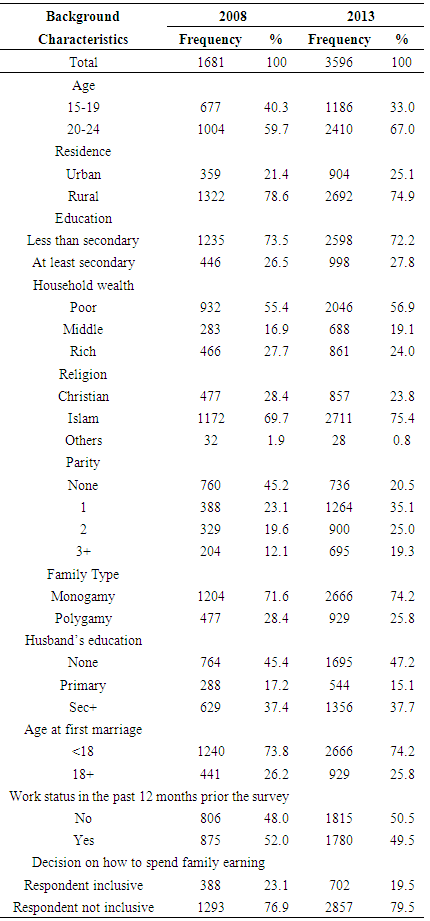
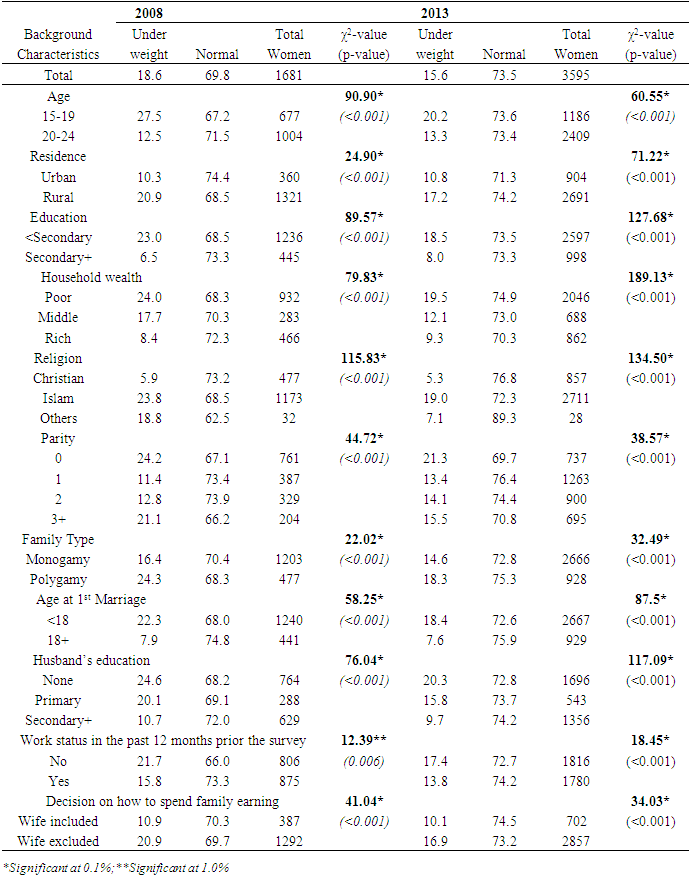
- In Table 1, the results show that the mean age of the women in 2008 and 2013 was 19.8±2.8 and 20.2±2.5yrs respectively. A higher proportion of the women are in age group 20-24 years in 2008 (59.7%) and 2013 (67.0%). Majority of the women live in rural areas, a distribution of 76.6% in 2008 and 74.9% in 2013. Slightly above 70.0% of the women have either primary or no formal education and in 2008, 27.0% are from rich households compared to 24.0% found in 2013. The Muslim women constitutes majority of the respondents, while 12.1% (in 2008) and 19.3% (in 2013) had had at least three children. As at the 2008 survey period, 28.4% of the women were from polygamous marriage, 73.8% got married at ages below 18 years and 52.0% had participated in the labor force in the last 12 months prior to the survey. The distribution pattern of the women in the survey year 2013 was similar to that of year 2008 in terms of marriage type, age at first marriage and labor force participation. About 23.1% and 19.5% of the women are involved in decision about how to spend family earnings in 2008 and 2013 respectively.
|
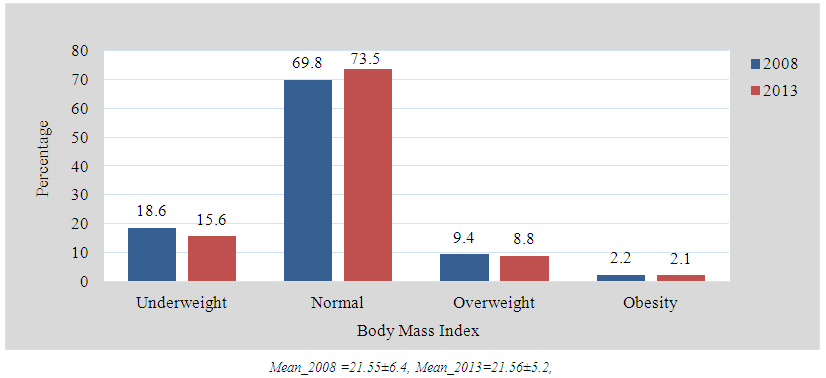 | Figure 1. Trend in percentage distribution of the respondents according to Body Mass Index |
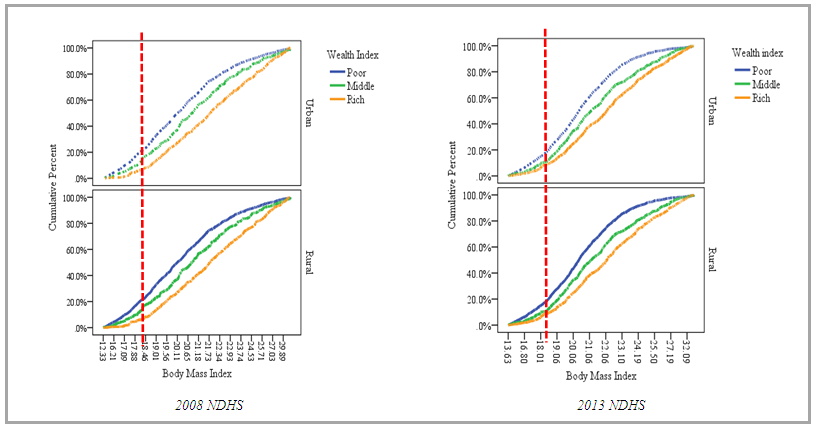 | Figure 2. Percentage cumulative distribution of young married women in Nigeria by Body Mass Index according to wealth index and place of residence |
|
|
|
4. Discussion
- The weight status of a woman could be linked to the cumulative effect of her health and nutritional problems. However, in developing countries, underweight is seen as a major contributor to poor health outcomes among women Therefore, the results of this study could be used in addressing the problems associated with underweight among Nigerian women so as to improve their nutritional and overall health status.
5. Socio and Demographic Characteristics
- The married women in the two surveys share similar socio demographic and economic characteristics. The average age of women in the two surveys was about 20years, with about two-thirds in the later stage of youth i.e. 20-24 years and surprisingly majority lived in urban areas. This high urban population is not unusual as the Nigerian population structure and dynamics has been predicted to change over the years. According to the 2008 DHS report, about 64% of the population lived in rural areas, while 36% lived in urban areas [33]. In 2010, the UN estimated a proportion of 49.8% urban population, and implied that as time progresses; the proportion of urban dwellers will increase and may overtake the proportion of the rural population. The UN reports also indicate that by 2050, about 75% of the Nigerian population will live in urban areas [34] It is also important to note that youths are mostly found in the urban areas due to high rural urban migration as a result of inequality in economic and infrastructural development in Nigeria where amenities are predominantly situated in the urban areas. Youths generally belong to the working population group and have high mobility. Young married women are found in the cities either to seek a white collar job or schooling or relocate to urban areas because of marriage.The educational level of the women in the two surveys was also poor as a vast majority had primary or no formal education. In line with MDG 2(achieving universal primary education for both boys and girls) and 3 (eliminate gender disparities in education), a lot has been done in terms of encouraging women or girl child education. The results from the MDG evaluations though encouraging and positive have resulted in increase in school enrollment rates, but reports still show that 22% of sub Saharan Africa school age children are still out of school; of which majority are girls [35]. It should be noted that Nigeria remains the country with the highest population of out of school children in the world, majority being girls. Factors responsible for these have been earlier identified such as poverty and early marriage. The need for girl child education cannot be over emphasized as it will reduce MMR, IMR and fertility rates etc. Our findings seem to be consistent with the 79% primary school enrollment rate for girls in Nigeria [35].Early marriage has been documented as an obstacle to educational advancement of young women in societies where it is widely practiced [36]. In Nigeria, marriage below the age of 18years is against the law according to the federal child rights of 2003. However, there has been wide variation in the level of compliance and implementation of the law across the states in Nigeria, especially in the northern region where there appears to be cultural demand for girl bride. In our study, findings further revealed that early marriage was most common in majority of the women in both years. Previous reports have shown that 12% of young women were married by age 15years and 26% were already in polygamous relationships [33].To our knowledge, the current study is among few studies that have investigated the level of underweight among female married youths in Nigeria using a nationally representative data. Our findings suggest that underweight is still common in Nigeria although a slight decline in prevalence between 2008 and 2013 was found. Interestingly, such slow pace of reduction in the level of underweight among women over a short period has been reported in Ghana, Morocco, Malawi and some other countries in sub-Saharan Africa [37]. The slight decline in underweight in this study might be due to the Nigerian nutrition policy published in 2004 whose main goal was to improve the nutritional status of all Nigerians with particular emphasis on the most vulnerable groups including young women. The policy later keyed into the WHO agenda on the need to promote habits and activities that will reduce malnutrition and improve the nutritional status of women [38]. Slow pace of reduction in the level of underweight found in this study is expected and can be attributed to poor implementation of the nutrition policy, bad governance and harsh economic conditions which have perpetrated the Nigeria system in the last three decades. A monolithic economy with the main focus on crude oil at the expense of agriculture is another possible reason for our finding.Studies in other African countries such as Ghana, Kenya, Malawi and Niger have also reported higher rates of underweight in the rural areas. [39, 40]. Findings from developing countries regarding rural urban differential in underweight also corroborate our outcomes of higher rates of underweight in rural areas [41]. It is generally known that rural areas are usually associated with poor socio-economic status. Although, the rural dwellers in Nigeria are mostly agrarian, but the best and most of their farm produce are often sold in the cities in order to attract huge profit to meet other immediate needs. In this situation, the urban population may have access to food items at even cheaper rates than the rural areas. This may partly explain the higher rates of underweight in rural compared to urban areas. There is always possibility of access to public health information on dietary intake in the urban than rural areas. In the expected direction, our study showed that the prevalence and risks of underweight reduce as the level of household wealth and education increase. This finding was in agreement with the outcomes of earlier studies conducted in Nigeria and other settings [42-44] Although the design of Adesuwa and colleagues study was slightly different from ours, while our study was purely community based, the other study was conducted among adolescents in secondary schools. The finding might suggests that household wealth as a proxy measure of household income may likely have influence on access to health care services, living condition and dietary intake which previous research have found to have implications on nutritional status [45], suggests that adopting a healthy diet constitutes an important strategy to prevent unhealthy outcomes (such as underweight) and optimize long-term health. The pattern displayed by education and underweight in the current study has been widely established in the literature [41, 46, 47].The World Health Organization and some international agencies such as USAID, UNICEF etc. have launched numerous campaigns against child marriage mainly because of its negative consequences on maternal health. As previously found in several studies [48, 49] our study substantiates the fact that the risk of underweight is likely to be higher among women who married at ages below age 18 years than those who married at ages 18 years and above. The direction of the relationship between underweight and age at first marriage found in this study could be as a result of usual difference in socio-economic situations of women who married as a child compared to those who married as an adult. For instance, a previous study conducted in India reported that girl brides were more likely to have no formal education, live in rural areas, live in poverty, and have poor nutritional status compared to those who married as adults [48]. A Bangladesh study also revealed that young women from rural areas, poor families, with low level of education, marry early and who more than two children have had higher risk of being underweight [50].
6. Conclusions
- This study documents that underweight is still common among young married women in Nigeria particularly in the rural areas. Lower age, early marriage and lesser number of children are factors associated with underweight. Our data supports the growing evidence of the effect of early marriage on the nutritional status of women. It also highlights the need for programs to support women who are forced to or who decide to marry early. Parents should be counseled on the benefits of increasing the number of years of the girl child education thereby delaying early marriage.
ACKNOWLEDGEMENTS
- We are grateful to the National Population Commission and ICF Macro Calverton Maryland, USA for releasing the data for this study. We also thank Miss Bridget Afam for providing secretarial assistance for the manuscript.