-
Paper Information
- Paper Submission
-
Journal Information
- About This Journal
- Editorial Board
- Current Issue
- Archive
- Author Guidelines
- Contact Us
Public Health Research
p-ISSN: 2167-7263 e-ISSN: 2167-7247
2017; 7(5): 112-118
doi:10.5923/j.phr.20170705.02

Level of Willingness and Ability to Invest in Sanitation Facilities by Households in Busia County
 Abstract
 Reference
 Full-Text PDF
 Full-text HTML
Vincent M. Ouma1, David Omondi Okeyo2, Rosebella Onyango3
1Amref Health Africa, Nairobi, Kenya
2Chief Executive Officer and Senior Researcher, Kenya Nutritionists and Dieticians Institute, Nairobi, Kenya
3Maseno University, Department of Public Health, Private Bag, Kisumu, Kenya
Correspondence to: Vincent M. Ouma, Amref Health Africa, Nairobi, Kenya.
| Email: |  |
Copyright © 2017 Scientific & Academic Publishing. All Rights Reserved.
This work is licensed under the Creative Commons Attribution International License (CC BY).
http://creativecommons.org/licenses/by/4.0/

Access to sanitation and hygiene is a basic human right which is the lifeblood to good health. Sanitation and hygiene are fundamental to health, well-being, and poverty eradication and must be given a higher place in any agenda for future development. Despite high levels of awareness, sanitation coverage, subsequently the need for assessing the willingness and ability to invest in sanitation at household level remains a challenge. This study assessed the level of willingness and ability to invest in sanitation facilities by households in Busia County. The study adopted a cross-sectional design with a sample size of 421 households as respondent. Data was collected by use of structured questionnaires and analysis done based on descriptive and inferential statistics. Majority of the respondents 361(85.7%) were willing to invest in sanitation while 352(83.6%) self-reported as able to invest in sanitation. The population willing to invest was significantly different from that which was not willing and above the expected frequency in that category (z=14.65; CI = 0.4522 – 0.5478, p<0.05). In the same vein those who self-reported as able to invest, 352(83.6%) in sanitation was significantly different from the expected frequencies of 50% (Z=13.79, CI=0.4522 – 0.5478, p<0.05), hence the general self-reported ability was considered high among the study population. In conclusion, the study established that the level of willingness to invest in sanitation was high among the study population (87.5%), although this did not translate into similar levels ability. The high level of willingness was attributable to high levels of awareness on sanitation, key source of such information being the CHVs who are readily available within the community.
Keywords: Sanitation, Hygiene, Willingness to invest, Ability to invest
Cite this paper: Vincent M. Ouma, David Omondi Okeyo, Rosebella Onyango, Level of Willingness and Ability to Invest in Sanitation Facilities by Households in Busia County, Public Health Research, Vol. 7 No. 5, 2017, pp. 112-118. doi: 10.5923/j.phr.20170705.02.
Article Outline
1. Introduction
- Access to sanitation and hygiene is a basic human right which is the lifeblood to good health. Sanitation, and hygiene are fundamental to health, well-being, and poverty eradication and must be given a higher place in any agenda for future development [1]. On 28 July 2010, through Resolution 64/292 [2], the United Nations General Assembly explicitly recognized the human right to sanitation and acknowledged that sanitation is essential to the realization of all human rights [3]. Inappropriate excreta disposal practices directly and indirectly expose humans to viral, bacterial, protozoal and parasitic infections in their leaps and bounds [4].Poor sanitation is responsible for one of the heaviest existing disease burdens, accounting for 10% of the global disease burden [5]. It continues to be a major challenge in developing countries. Inadequate access to appropriate sanitation and hygiene practices largely impacts on the health of communities resulting to sanitation related illnesses such as diarrhoea, intestinal worms’ infestation and upper respiratory tract infections [6]. This assertion agrees with a study conducted in Vietnam concluding that poor sanitation causes considerable economic and financial loss to while correcting these conditions [7]. Children under 5 are most affected by malnutrition with a long-term effect of stunted growth mainly associated with repeated diarrhoea or intestinal worm infections. In 2016, about 2.4 billion people globally lacked access to improved sanitation. This number was estimated to grow to 2.7 billion by 2015. Wide disparities also exist by region, with sub-Saharan Africa and South Asia continuing to lag behind. Recent data show 69% and 64% of their population’s still lack access, respectively. And the gap between rural and urban areas remains huge, especially in Southern Asia, sub-Saharan Africa and Oceania [8]. Poor sanitation is linked to transmission of diseases such as cholera, diarrhoea, dysentery, hepatitis A, typhoid and polio. Although some 1.8 billion people globally have gained access to improved sanitation since 1990, the MDG target for sanitation was missed” Much of the deficit is in sub-Saharan Africa. A study by JMP shows that 1.1 billion people in the world still practice open defecation, and the highest levels of open defecation are found in South Asia (41%) and sub Saharan Africa (25%). Some critics have however argued that the numbers given do not reflect reality of the situation given the disparities in indicators and definitions across regions [9].Enshrined in the Constitution of Kenya, under chapter 4, Bill of Rights, is the right to “reasonable standards of sanitation” [10]. To achieve this, focus must shift towards investing in sanitation all the way from the national level to the household level. Access to sanitation in Kenya continues to be a major challenge, the WHO/UNICEF Joint Monitoring Programme [11], which considers those using shared facilities as lacking access puts the overall coverage at 31% (rural coverage 32% and urban at 27%). Another study further shows that over 6 million Kenyans still defecate in the open [12]. About half of the Kenyan population does not have access to proper sanitation facilities [13], implications are that about 80% of Kenyans who go to hospital suffer from preventable diseases such as typhoid, amoeba and diarrheal diseases. Diarrheal and gastroenteritis diseases are among the highest causes of infant hospitalization in Kenya today. The Economics Impacts of Poor Sanitation in Africa, a study conducted in 18 countries in Africa by World Bank Water and Sanitation Programme [14] reveals that Kenya loses 27.4 billion shillings annually due to poor sanitation, the poorest quintile of Kenyans is 270 times more likely to practice open defection than the richest. Busia County has been forefront in improving its sanitation profile, specifically; Nambale Sub-County which has excelled in CLTS, managing to achieve latrine coverage of 83.6%, not the same can be said about the other six Sub-counties [15]. The effects of poor sanitation are thus very clear and well documented, in fact a lot of sanitation awareness campaigns have been conducted in Kenya, and particularly in Busia since the adoption of CLTS in 2007. The high levels of awareness however do not reflect in sanitation coverage, hence the need for assessing the willingness and ability to invest in sanitation at household level. This paper thus assessed the level of willingness and ability to invest in sanitation facilities by households in Busia County. A community member’s willingness can be realized through the capacity to raise reasonable financial resources and pay for or construct a sanitation facility, which the ability to invest. Often times, the willingness and ability are affected by access to resources to actualize this desire. According to people’s perception on sanitation, findings from Nepal, knowledge is not a barrier in promoting sanitation and hygiene [16]. Communities are likely to show high levels of willingness when knowledge on sanitation already exits and the benefits of having appropriate sanitation facilities well understood [17]. A study conducted in Iquitos city reveals that community members were twice as willing to compared to ability to invest is water and sanitation services [18].Many programmes promoting sanitation have struggled with the question of how much household are willing to pay for sanitation services, this is yet to be made clear. Other scholars have argued that if community members are less willing or not willing to invest in sanitation, then it follows that they must also be willing or ready to accept the consequences of poor/lack of sanitation [19]. This however is a challenge as no family member will want to lose a loved one due sanitation related morbidity, they will do whatever it takes, including borrowing to pay for treatment. In Busia County, morbidity related to sanitation accounts for 40% of hospital admissions, which is higher than the National figures. Other studies have presupposed that aside from possible income effects, measures of the maximum amounts people will pay to avoid a loss, (in this case sanitation related morbidity) and the minimum compensation (in this case cost of treatment) necessary for them to accept it are generally assumed to be equivalent [20]. This could not be realistic as the cost of poor sanitation has been demonstrably found to be higher than the cost of investing in good sanitation. According to World Bank, 2012, Busia County loses KES 536 million annually, yet it would require an investment of KES 26 million to bring the county to Open defecation free status [21].Limited studies have been done in Busia showing the levels of willingness, the ability, and the underlying factors affecting willingness and ability to invest in sanitation facilities. It is most likely that many households are generally willing to invest in sanitation but this does not reflect in a similar increase in sanitation coverage, a number of interrelated and interdependent factors must be working to influence sanitation investment. In this paper, we have displayed the general level of awareness and ability to invest on sanitation among in Busia County. ‘Willingness to invest in sanitation’ in this context is defined as quality or state of being prepared to do something; readiness. Also expressed as demand - an informed expression of desire for a particular service, measured by the contribution people are willing and able to make to receive this service, also referred to in this study as the willingness to pay for sanitation. On the other hand, ‘ability to invest in sanitation’ is defined as a borrower's capacity to service a loan from his or her disposable income or cash flow, the capacity of a community member to raise reasonable financial resource and pay for sanitation facilities, also expressed as supply. Also referred to in this study as ability to pay for sanitation. ‘Sanitation’ implies all interventions for the safe management and disposal of excreta, with the principal safety mechanism being the separation of excreta from all future human contact [11].
2. Materials and Methods
2.1. Study Area
- The study was conducted in Butula and Teso South Sub-counties of Busia County in Western Kenya (Figure 1). Busia County lies between 0.4333° N and 34.1500° E (Latitude: 0.4530; Longitude: 34.1250). It consists of seven administrative sub-counties namely: Busia, Nambale, Butula, Bunyala, Samia, Teso North and Teso South. It borders the Republic of Uganda on the West and Siaya County on the South. In the North lies Bungoma County while the East border is shared between Bungoma and Kakamega Counties, both in the former Western Province. The Southern tip of Busia County is bordering Lake Victoria. Busia County is home to some 823,504-people distributed in the 164, 701 households [22].
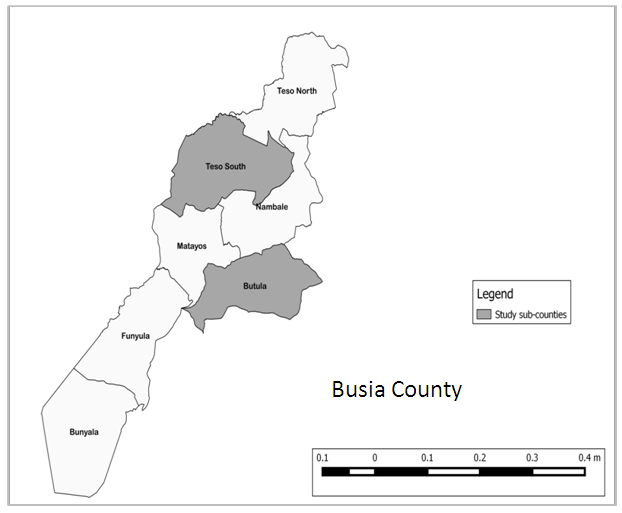 | Figure 1. Map of Busia County showing study sub counties, Butula and Teso South |
2.2. Study Design
- The study adopted a cross sectional design and employed mixed methods of both qualitative and quantitative nature. Being a relatively new area of study within the target communities, the information collected was used to draw inferential statistics about the community.
2.3. Target Population
- The target population for the study was the 287,577 people of Butula (134,903) and Teso South (152,674) Sub-counties of Busia. The study population was 421 residents of Butula (197) and Teso South (224) Sub-counties. The sampling unit was the household, in which the household heads were interviewed, this is based on the assumption that household heads are in a position to make financial decisions for the entire household. The study included adults, aged 18 and above who are household heads and are residents of Butula and Teso South Sub counties and willing to give informed consented to the study. Exclusion Criteria; the mentally challenged, those found to be under the influence of alcohol and other substances, minors, visiting friends and relatives and those unwilling to give informed consent were excluded from the study.
2.4. Sample Size Determination and Sampling Procedures
- The sample size, (n =) was obtained using 95% confidence interval and a significance level of 5%, as per below formula (Cochran’s sample size formula for infinite populations i.e. over 50,000)
 Where,
 = sample sizeZ = standard normal variant represented by statistical constant 1.96P = is the estimated sanitation coverage in Busia = 32%q = 1- P noe = is the required level of precision, 0.05
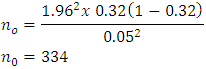 The study added 15% to the sample (total 384) to cater for non-response or any spoiled tools. Eight FGDs were also conducted to collect more qualitative data. Each FDG was composed of 8-12 participants, male and females who were drawn each from a village representing the wards in the sub county.The two sub counties, Butula and Teso South were purposively sampled, picking a third of the total number of Sub Counties. Sampling of Enumeration Areas (EAs) was done independently within each stratum using the probability proportional to size (PPS) method with households being the measure of size. The first step was to determine the number of households to be interviewed in each of the two sub-counties; this was done by calculating the population proportions for each of the two sub-counties. Secondly, a number of sub locations and subsequently villages from each Sub-county were randomly selected by use listing and picking method. Using the Community Strategy Registers, a complete range of HH codes was written on small pieces of papers, folded, thoroughly mixed and a desired number (421 households) randomly picked from the bundle (listing and picking method). The unit of study for the survey was the housing unit defined as the dwelling unit (or units) occupied by one household. The enumerators were each allocated a number of sampled units within the same or nearby sub location for ease of data collection and logistics. The target interviewee was preferably the household head, since typically household heads are in-charge of expenditures within the household and mainly determine how to spend and can make financial decisions. Data collection was done concurrently in all the sites. Quantitative methods were applied to collect information on willingness and ability to invest in sanitation. Using Contingent Valuation Method (CVM) approaches, Household questionnaires were developed and used to collect information on WTP, ATP, and factors that influence them. The Enumerators were taken through a one-day training session covering all aspects of the study prior to data collection. A total of 421 respondents were interviewed from the two sites and 8 FGDs conducted, 4 in either site.
2.5. Data Management and Analyses
- Filled questionnaire were checked for completeness and coded. The questionnaires entered into EPI Data software and analyzed using SPSS V19. For quantitative data, Z-tests were used to analyze variables that influence investment in sanitation facilities.
2.6. Ethical Consideration
- Scientific approval for the study was sought from the Maseno University School of Graduate Studies (SGS. Ethical clearance was sought from Maseno University Ethical Review Committee (MUERC). The County Director of Health of Busia County was briefed of the study and she provided permission. In carrying out the study, informed consent was sought with full information being provided and comprehension being affirmed. Confidentiality was ensured through anonymity (using unique numbers); privacy during interviews and withdrawal at any point was allowed.
3. Results
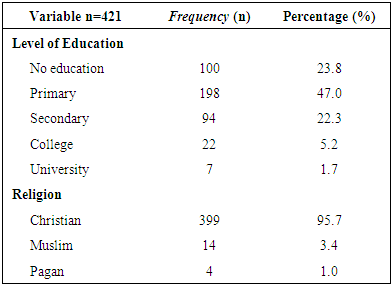
- A total of 421 respondents were interviewed for this study, of which 234 (55.6%) were male and 187 (44.6%) were female. Majority, 198 (47%) of the respondents had primary school education while a small proportion 7(1.7) had university education. They were predominantly of the Christian religion 399 (95.7%) with a small percentage being pagan 4 (1.0%). The population had a mean age of 44.51 years (SD=13.8), meaning majority of the population sampled was in the adult category with an average household size of 6 persons.
|
3.1. Distribution Nature of Willingness and Ability to Invest in Sanitation
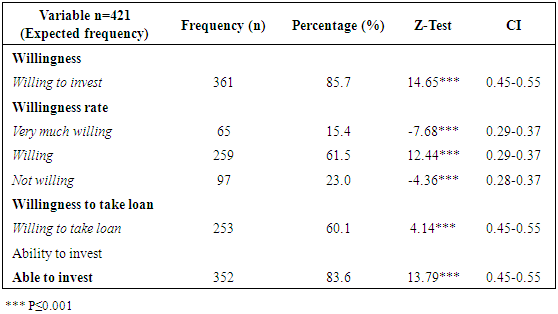
- Majority of the respondents 361(85.7%) were willing to invest in sanitation while 352(83.6%) self-reported as able to invest in sanitation.
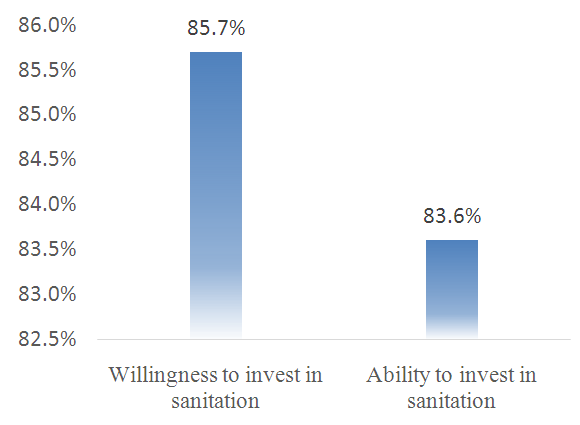 | Figure 2. Distribution of household by level of willingness and ability to invest in sanitation |
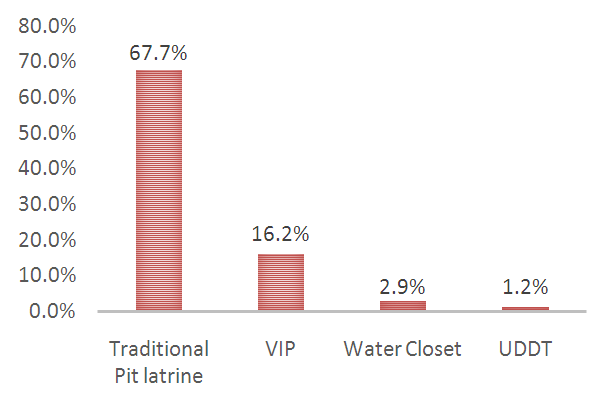 | Figure 3. Distribution of types of latrines owned |
3.2. Level Willingness and Ability to Invest in Sanitation
- The level of willingness and ability to invest in sanitation was assessed based on Z-scores for single proportion in relation to expected frequencies which were established as average percentage of the number of categories under measurement. 361(85.7%) of the respondents were willing to invest in sanitation with a Z score 14.65 (CI = 0.4522 – 0.5478). The population willing to invest was significantly different from that which was not willing and above the expected frequency in that category. When further subjected to willingness categories (very much willing, willing and not willing), those willing were significantly different from the other two categories at Z-score of 12.42(CI=0.2851 – 0.3749), meaning the general willingness to invest in sanitation was high among the study population. In the same vein those who self-reported as able to invest, 352(83.6%) in sanitation was significantly different from the expected frequencies in that categories with a Z-score 13.79 (CI=0.4522 – 0.5478), hence the general self-reported ability was high among the study population. The average amount the respondents were willing to invest in sanitation was KES 18, 925, with the lowest amount at KES 100 and highest at KES 80,000.
4. Discussion
- The study assessed the level of willingness and ability to invest in sanitation facilities by households in Busia County. The demographic factors considered in the study included gender, age, household head, education, religion and house hold size. Access to water, sanitation and hygiene is a basic human right and is essential to the realization of all human rights [3].The Millennium Development Goal seven, target three aimed to reduce by halve the proportion of the population without sustainable access to safe drinking water and basic sanitation by the year 2015. Globally, the safe water targets were met by 2015, on the on the hand the sanitation target was not. Lack of adequate sanitation is a serious health risk and an affront to human dignity. In 2008, an estimated 2.6 billion people globally lacked access to safe sanitation; this number could grow to 2.7 billion if the trend continues [8]. Poor sanitation is responsible for one of the heaviest existing disease burdens, accounting for 10% of the global disease burden [5]. It continues to be a major challenge in developing countries. Inadequate access to appropriate sanitation and hygiene practices largely impacts the health of communities resulting to sanitation related illnesses such as diarrhea, intestinal worms’ infestation and upper respiratory tract infections [6]. This assertion agrees with a study conducted in Vietnam concluding that poor sanitation causes considerable economic and financial loss to while correcting these conditions [7]. In 2012, the World Health Organization estimated that the global economic return on sanitation spending is US$5.5 dollar for every one dollar invested; more than double the economic return on water spending, US$2. This study agrees with a similar study conducted in five developing countries stating that the return on a US$1 investment was in the range US$5 to US$46, The main contributor to economic benefits was time savings associated with better access to water and sanitation services [23]. Not investing in sanitation has proved to be more expensive than doing it, yet households often do not prioritize investing their own resources in sanitation, and society pays the consequences. These statistics reveal that not investing in sanitation could be more expensive than investing it in the long run, this underscores the more need for community members to be more willing to invest in sanitation. According to people’s perception on sanitation, findings from Nepal, knowledge is not a barrier in promoting sanitation and hygiene [16]. Communities are likely to show high levels of willingness when knowledge on sanitation already exits and the benefits of having appropriate sanitation facilities well understood [17]. This assertion agrees with findings in this study, where majority of the respondents 414 (98.3%,) had knowledge on sanitation, its benefits and consequences, as such, 87.5% (Table 2) of the respondents were willing to invest in sanitation. Some community members after realizing the health problems that face them due to poor sanitation, they develop and instant desire to have a proper sanitation facility, but may not have immediate resources to invest in such a venture. The source of knowledge on sanitation matters was attributable to the community health volunteers and public health officers who were reported to be present in the community. Busia County has fully embraced the Community Strategy Concept where with over 80% of the community covered by Community Units. Under the community strategy, a community unit consist of an average of 50 Community Health Volunteer (CHV), each of which is responsible for at least 10 households within their jurisdiction. The CHVs are responsible for providing information to their households which includes promotion of sanitation and hygiene [24].
|
5. Conclusions and Recommendations
- The full benefits of sanitation go beyond improving health and economic out comes, they include other ‘intangible’ impacts, so-called because they are difficult to measure, and most studies leave them out, these include dignity, comfort, privacy, security, and social acceptance. The understanding of this should in itself move any given community members to be more willing to invest in sanitation. The level of willingness to invest in sanitation was high among the study population (87.5%), although this did not translate into similar levels ability. The high level of willingness was attributable to high levels of awareness on sanitation, key source of such information being the CHVs who are readily available within the community. There is need for government and other agencies in sanitation to promote other appropriate sanitation options in addition to the traditional pit latrine.