E. C. Merem1, Y. Twumasi1, J. Wesley1, P. Isokpehi1, M. Shenge1, S. Fageir1, M. Crisler1, C. Romorno1, A. Hines2, G. Hirse2, S. Ochai3, S. Leggett3, E. Nwagboso4
1Department of Urban and Regional Planning, Jackson State University, Jackson, MS, USA
2Department of Public Policy and administration, Jackson State University, Jackson, MS, USA
3Department of Health Policy and Management, Jackson State University, Jackson, MS, USA
4Department of Political Science, Jackson State University, Jackson, MS, USA
Correspondence to: E. C. Merem, Department of Urban and Regional Planning, Jackson State University, Jackson, MS, USA.
| Email: |  |
Copyright © 2017 Scientific & Academic Publishing. All Rights Reserved.
This work is licensed under the Creative Commons Attribution International License (CC BY).
http://creativecommons.org/licenses/by/4.0/

Abstract
Since the discovery of oil in the Niger Delta region, the sector’s contribution to Nigeria’s economy came at a huge environmental cost involving recurrent spills resulting in the spewing of oil into sensitive ecosystems. In the process, gas flaring from the industry has accelerated at an alarming rate and degrading the fragile mangrove ecosystem. The problems are characterized by widespread pollution of water resources and threats to the surrounding ecology in the form of deforestation, loss of habitats, and damage to biodiversity. Yet very little has been done to fully assess the impacts on the Delta region. In that light, this research uses mix-scale methods of GIS and descriptive statistics to assess the environmental liabilities of petroleum activities in Southern Nigeria from 1963-2013. Emphasis is on the issues, ecological analysis of the impacts, factors and spatial analysis. While the results point to changes in production and ecosystem degradation prompted by the concentration of greenhouse gases, rise in CO2 emissions, widespread incidents of gas flaring and oil spills. GIS mappings show a gradual dispersion of various liabilities such as fire outbreaks at facilities all through 2002-2003 along with visible presence of gas flaring in the 2000s followed by a robust spread of oil spills across various states in the Delta between the periods of the 1980s-1990s and a reemergence in the 2000s. The spatial cluster of supply infrastructure stayed intact while oil shipments to different zones in Nigeria fluctuated in the South with slight increases in the North from 2007-2013. With the ecological liabilities linked to socio-economic factors of ineffective guidelines, local demands and oil exports, the paper proffered suggestions ranging from the strengthening of policy to continued impact assessment.
Keywords:
Niger Delta Region, Southern Nigeria, Liabilities, Degradation, Oil and Gas, GIS, Assessment
Cite this paper: E. C. Merem, Y. Twumasi, J. Wesley, P. Isokpehi, M. Shenge, S. Fageir, M. Crisler, C. Romorno, A. Hines, G. Hirse, S. Ochai, S. Leggett, E. Nwagboso, Assessing Ecosystem Liabilities of Oil and Gas Activities in Southern Nigeria, Public Health Research, Vol. 7 No. 1, 2017, pp. 3-26. doi: 10.5923/j.phr.20170701.02.
1. Introduction
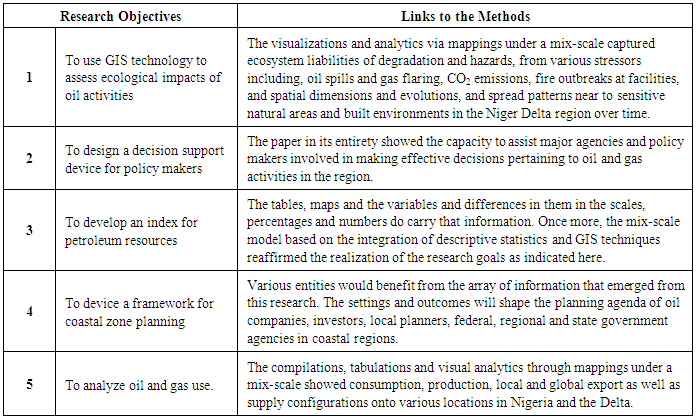
With its endowed deposits largely concentrated in the Deep South, the oil and gas sector in the Niger Delta region has for years dominated Nigeria’s economy with little consideration for environmental liabilities. In 2004 when the sector accounted for 80% of all government revenues, 90-95% of export proceeds and over 90% of foreign exchange earnings all came from the oil industry [1, 2]. Being Africa’s leading producer, the country at the global level ranks in the top 10 among oil producers [1], with most of the output in the Niger Delta region delineated by the boundaries of nine states made up of Abia, Akwa Ibom, Bayelsa, Cross River, Delta, Edo, Imo, Ondo and Rivers. Notwithstanding, the glowing profile being painted, ecological liabilities such as oil spills have had a major effect on the ecosystem of the region whenever released and thus constitutes serious health hazards [3]. In a highly diverse ecosystem with largest deposits of oil and natural gas in Africa, the region’s four eco-zones (coastal inland, freshwater, mangrove swamps and low land forest zone) are epicenters of widespread degradation by hazards posed by over 7,000-3,000 km2 pipelines and production activities in which 9-13 million barrels of oil were spilled in a spate of 50 years [4, 5]. In the process, enormous strips of mangrove forest, which are explicitly prone to oil spill, have not only been destroyed, but human impacts from poor land management upstream coupled with pollution by petroleum activities have accelerated the disappearance of 5 to 10% of the mangroves in the area. The gravity of these liabilities is further characterized by the wanton destruction of large tracts of green cover in areas associated with oil and gas activities. This involves fast moving spills and debris in built up zones spread over large areas ravaging crops and aquaculture through the pollution of ground water resources and soils. Under those circumstances, agricultural output is gravelly impacted in most farm communities [6, 7]. Considering the reckless approach to oil and gas activities in the Delta during production, the environment is becoming degraded. Individuals in affected communities who lament about health problems such as respiratory and dermatological disorders seem to have lost their fundamental rights of access to nutrition, healthiness, fresh water, and capacity to gainful employment. With the benefits of oil and gas, and the effects of proposed infrastructural development in the sector is having on the ecology of the producing states of the Niger Delta. Nigeria remains one of the major sources of global gas flare rates representing 76% of its natural gas. Against that background, it is not then surprising that about 2.5 billion cubic feet to 17.2 m3 of flared natural gas valued at 2.5 billion dollars occur yearly in the region. This is associated with the emission of greenhouses and the atmospheric concentration of toxic gases therein [8, 9]. In all these, gas flaring continues to wreak havoc by warming up the ecosystem of the Niger Delta [10]. The same can be said of pollution of water resources and the threats to the surrounding ecology in the form of deforestation, loss of habitats, and biodiversity decline, the symptoms of respiratory disorder and the violation citizens right by the concentration of toxic cocktail from flares in the Niger Delta region of southern Nigeria. With the emergent liabilities linked to socio-economic elements from global export of oil to local demands, policy lapses and over dependence on oil revenues. Recurrent oil spills, gas flaring, pollution, CO2 emissions and acid rain threaten the head waters of an already fragile environment in the Delta. These impacts not only raise the risk levels of the surrounding ecology of the Delta, but the temperature is heating up with 48 billion kw of heat discharged into the air daily at the expense of the livelihood and health of local communities.In the context of the foregoing, there exists a growing body of work on liabilities such as gas flaring in the study area and these include Raimi [11] Ismail [12], Oseji [13], Ubani [14] and others. From these studies, [12] saw gas flaring as a local and global concern and one of the most challenging energy and environmental problems. Elsewhere [11] links the endemic nature of gas flaring in Nigeria to the nation’s regulatory agency lack of political will to stop the recklessness of the oil sector. Just as [13] outlines the effects of gas flaring under the rubric of increased temperature and acid rain within Umuntu Ebedie gas plant in Delta State, [15] assesses the evolution of oil exploration and the hazards along the coastal region of Ondo state. Along these themes covered in the studies came several remedies ranging from national gas flaring policy [11], the involvement of regulatory agencies in policy implementation, oil spill contingency plan and surveillance mechanism [15]. While similar studies can be gleaned from [16], and [17], the use of Geographic Information Systems(GIS) in pinpointing emerging ecological liabilities from oil and gas impacts in the Niger Delta seems sketchy. However, studies highlighting GIS applications in the management of petroleum and other resources in the Niger Delta and elsewhere can be found in the work of Merem under various years [18-21]. Given the gaps and the abundance of oil and gas in the Niger Delta Region of the country, assessing the impacts of liabilities using GIS provides valuable opportunity to monitor the trend regionally for policy makers and the industry. The belief is that effective decision making in the face of mounting liabilities in the oil sector requires adequate use of spatial tools such as GIS in pinpointing dispersion and scale of ecosystem risks such as oil spills, gas flaring, fire outbreaks at oil facilities and greenhouse gas emission sources. In so doing, environmental management can benefit from it in monitoring the ecological threats faced by communities in impacted areas in the Niger Delta. Accordingly, this paper assesses the growing ecological liabilities of oil and gas activities in the Niger Delta using a mix-scale method of GIS and descriptive statistics. Emphasis is on the issues, analysis of the trends (production, flaring, emissions and impacts) spatial analysis and the factors. The paper has five objectives. The first aim focuses on the use of GIS technology to assess ecological impacts of oil activities, while the second objective is to design a decision support device for policy makers. The third aim emphasizes the development of an index for petroleum resources. The fourth objective is to devise a framework for coastal planning. The fifth objective is to analyze oil and gas use. The paper has five parts. The first section presents the introduction while part two covers materials and methods. Part three highlights the factors and results with GIS mapping. While the fourth section contains the discussion, part five provides the conclusion and findings of the research. For more on the links between the research objectives and the results, please see Appendix 1.
2. Methods and Materials
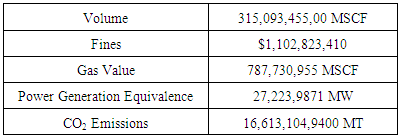
The study area (Figure 1) stretches through 112,110 Km2 across 9 states in Southern Nigeria's Niger Delta region. With a combined population of 39 million and 25% of the nation’s overall total in 2015, the region had a steady growing population of approximately 30 million people as of 2005, accounting for more than 23% of the Nigeria’s total population in that period [2]. Accordingly, the region boosts of a tapestry of forests, farm lands, rivers, creeks, estuaries and stagnant swamps spanning over 8,900 Km2. Being in a tropical rain forest ecosystem comprising of diverse species of flora and fauna with both aquatic and terrestrial species, the Niger delta region can be classified into four ecological zones; coastal inland zone, freshwater zone, lowland forest zone, and mangrove swamp zone considered as one of the ten most important wetlands and marine ecosystems in the world. Notwithstanding such diverse ecological attributes, these natural areas are now being threatened by spills from oil and gas activities [22]. In the middle of the 2015 fiscal year, the volume of flared gas in the region often toxic to the fragile environment stood at 315,093,455,000 MSCF cubic feet with gas value of 787,730,955 MSCF. The estimated volume of flared gas in mid-2015 in the region is not only large enough to generate the equivalence of 27,223,9871 megawatts in electricity power, but it represents about 16,613,104,9400 metric tons in CO2 emissions with threats to the surrounding ecosystem [23, 24], (Table 1). Table 1. Gas Flaring Impacts in the Niger Delta, Mid 2015
 |
| |
|
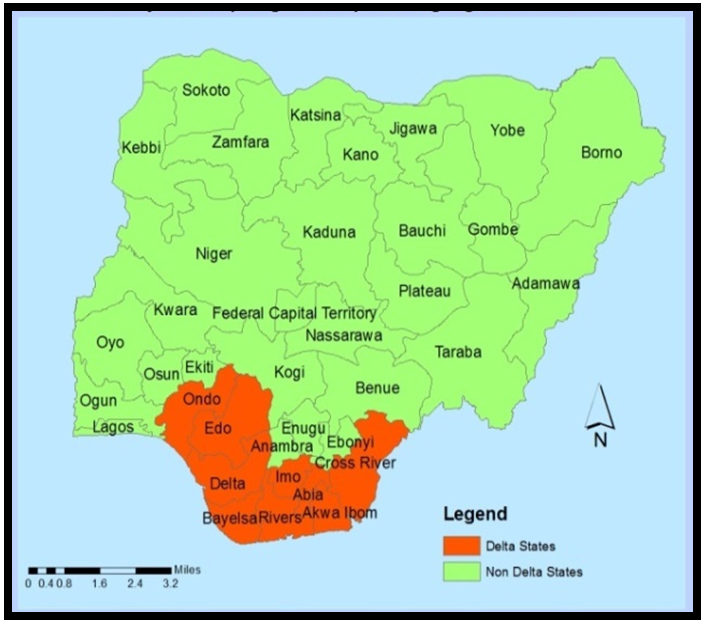 | Figure 1. Study Area Niger Delta |
In Nigeria where 3,000 km2 petroleum pipeline traverses the entire country’s geo-political zones ranging from the subsea swamp, rain forest, to diverse climates and soil conditions with varying consequences. The installed network of oil and gas pipeline facilitating the daily distribution of crude oil products to other parts of the country come at both human and ecological costs to the local people in the Niger Delta. These pipelines not only run across the rainforests and mangroves with incidences of leakages. The seeping of petroleum products during the distribution process has damaging implications for communities and the fragile Delta ecosystem where ecological liabilities from oil and gas activities remain a recurrent problem. With vast deposits of oil in the Niger Delta region [25, 26], pipeline construction and the right of way for exploration has for decades obliterated the surrounding ecology of the area. Much of the reported cases of spillages have occurred in the fragile mangrove swamp forest, which is one of the most reproductive ecosystem rich in fauna and flora with mounting impacts [27-30].
2.1. Methods Used
The paper uses a mix-scale approach involving descriptive statistics and secondary data connected to GIS to analyze the impacts of oil and gas activities in the Niger Delta area of Southern Nigeria. The spatial information for the research was obtained from the United States Geological Surveys (USGS), The Oak Ridge National Energy Laboratory, The US Department of Energy, The Energy Information Administration (EIA), Niger Delta Development Corporation (NDDC) and Nigerian National Petroleum Corporation (NNPC) and an Environmental NGO, Environmental Rights Action (ERA). All in all, the oil and gas data for the Niger Delta and fire data and others came from Nigerian National Petroleum Corporation (NNPC), the Energy Information Administration (EIA), and Environmental Rights Action for the periods of 1976 to 2013. On the one hand, The Oak Ridge National Energy Laboratory and the Environmental Rights Action group offered the emission data. On the other, The Nigerian National Petroleum Corporation (NNPC) produced the gas flaring information along with the time series economic data. While the federal geographic identifier codes of the states were used to geo-code the info contained in the data sets. This information was processed and analyzed with basic descriptive statistics, and GIS with attention to the temporal-spatial trends at the state and regional levels in Nigeria. The relevant procedures consist of two stages listed below.
2.2. Stage 1: Identification of Variables, Data Gathering and study Design
The first step involves the identification of variables needed to assess oil and gas impacts in the nine states of the Niger Della region in Southern region. The variables consist of the frequency of spills, percent of spills, percent of quantity spilled, percentage of change for spills, tonnage of CO2 emissions, natural gas production, total gas utilized, percent of gas flared and fire outbreaks. The others encompasses the number of spills, net volume of spills, production capacity and the percentage distribution of petroleum to Nigeria’s geopolitical zones. Added to the list, are the quantity of crude oil export by region, gas flaring among Sub Saharan African nations in cubic meters, estimates of gas flaring in selected countries, ratio of gas flared to oil produced, CO2 emissions from fossil fuel and pipeline explosions. Additionally, access to databases that are available within the federal and state archives in the Southern Nigerian region and other agencies quickened the search process. The process continued with the design of data matrices for socio-economic and environmental variables covering the periods from 1963, 1976-1986, 1996, 1998, 2000, 2005, 2011 and 2013. The design of spatial data for the GIS analysis required also the delineation of state boundary lines. With boundary lines unchanged, a common geographic identifier code was assigned to each of the units to ensure analytical coherency.
2.3. Stage 2: Step 2: Data Analysis and GIS Mapping
In the second stage, descriptive statistics and spatial analysis were employed to transform the original socio-economic and energy data into relative measures (percentages/ratios). This process generated the parameters for estimating and assessing the trends, oil and gas production, quantity spilled, and flared, quantity used, and the distribution of oil and gas across the geopolitical zones. This was facilitated by measurements and comparisons of the trends over time. While this approach helps track the levels of use, the tables highlight potentials, number of fire outbreaks in oil facilities, frequency and percentages, export volumes, the environmental and economic costs. The remaining steps involve spatial analysis and output (maps-tables-text) covering the study period, using Arc GIS 10.4 and SPSS 20.0 The spatial units of analysis under a mix-scale consist of states, region, the nation and the boundary and locations where oil exploration is active. The geographic data for the Niger Delta which covered its boundaries and states, also includes ecological data of land cover files, and paper and digital maps from 2002-2013. The outputs of the spatial data were mapped and compared across time from the 1970s to 2013 to see the dispersion of the trends in oil and gas spills, usage, production, flares, and the socio-economic factors fuelling the proliferation of ecosystem liabilities in the activities of the sector in the study area. For more on the mix- scale methods, the steps involved and the GIS approach, see Appendix 2-3.
3. Results
This section of the paper presents the results of the data and environmental analysis of oil and gas liabilities in the study area. There is an initial focus on the temporal profile of gas production trends, and the percentages of change, the extent of regional flaring and spills, and their percentages. This is followed by the analysis of CO2 emission from fossil fuel and flaring, the ecological effects and the GIS mapping of the trends over the years. The others include identification of factors behind the ecological liabilities most notably global export, local demands and ineffective policy.
3.1. Gas Production Trends
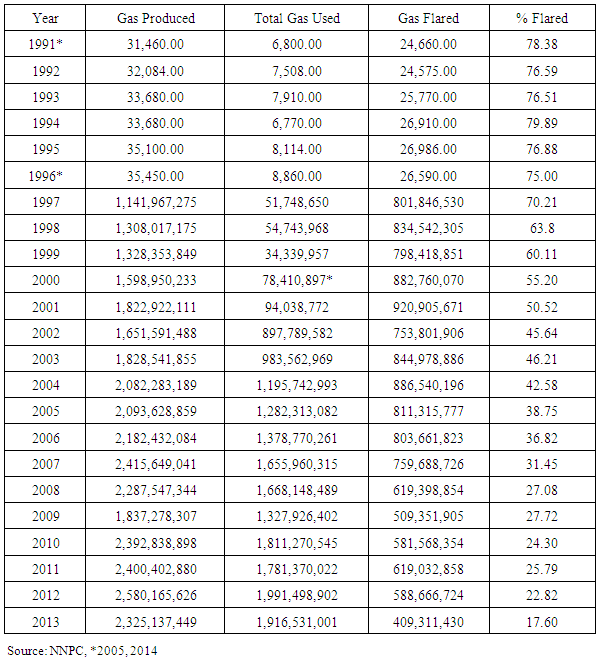
To better understand the ecosystem risks posed by gas flaring and the liabilities involved in the Niger Delta, one needs to consider such indicators as gas production, the amount utilized, the percentage of flares as a measure of the activity in the region under three different phases from 1991-1996, 1997-2003 and 2004 through 2013. The opening production activity indicates gas production volumes went up from 31,460.00 to 32,084.00 MCM between 1991 and 1992. By 1993-1994 through 1995-1996, the output soared further at levels exceeding 33,680 and (over) thirty five thousand MCM (Million Cubic Meters). While the period of 1997-2003 saw increased gas volumes estimated at levels higher than million cubic meters, with time, production reached 1,141,967,275 MSCF (Thousand Standard Cubic Feet) in 1997 and continued (in 1998-1999 and 2000) at over 1.3-1.5 MSCF. Between 2004 through 2013, production jumped to over 2 MSCF plus followed by maximum levels of 2,415,649,041-2,400,402,880 MSCF in 2007 to 2011. In the later periods, gas capacity surged further to an all-time high of 2,580,165,626 MSCF by 2012 until a gradual slide to 2,325,137,449 in 2013. With the soaring production levels over these years, came increased volume between 2004 through 2013 compared to the previous years when demands stood at lower levels. Note also that in the 2002-2003 periods, gas utilization rose to significant levels of 897,789,582-983,562,969 MSCF (Table 2).
3.2. Gas Flaring Trends
The volume of gas flaring in early 1999s of 1991-1996 was different from 1997 through 2013. Flaring not only grew in geometric proportion as the table implies, but it did get out of hand even though the percentage waned in the later years. Surely, the incidence of gas flaring stayed frequent in the early 1990s (1991-1996) with the volumes at 24,600.00-25,575.00 MCM in 1991-1992 while in 1993 the study area discharged 25,770.00 million cubic meters of gas. Considering the slightly identical flared volumes (26,910.00 -26,986.00 to 26,590.00 and 26,000 million cubic meters) between 1994 through 1996. In a span of 10 years (1997-2007), gas discharge grew to unprecedented levels with the highest point in 2001. This trend continued all through 1997-2000 when flared gas fluctuated from 801,846,530-834,542,305 thousand standard cubic feet to 798,418,851-882,760,070. While in the ensuing periods (2001-2004), atmospheric blazing in 2001 reached its highest level of 920,905,671 along with 753,801,906 for 2002. From 2003 to 2004, gas burning practices held firm at identical levels of 844,978,886-886,540,196 and persisted in 2005-2006 (at 811,315,777, 803,661,823 MSCF). This was followed by another 759,688,726 MSCF dispersed into the air in 2007. By 2008 to 2013, flared gas dropped from 619,398,854 to 409,311,430 MSCF (Table 2).Table 2. Gas Production, Consumption, and Flared 1991-2013
 |
| |
|
3.2.1. Percentage of Changes in Flared and Produced Gas
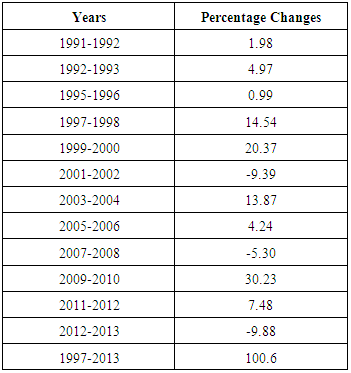
In a 10 year span of 1991 to 2001, the incidence of gas flaring was so widespread that the percentage equivalence and quantity exceeded consumption. With time, these figures dropped from 55% to 17.60 by 2000 through 2013. Furthermore, during 1991 to 1997, the volume of flared gas also averaged about 76.20% of the overall output. This was evident in the opening four years (1991-1994), when the percent of flared gas opened at higher rates of 78.38 -76.59 and 76.51-79.89. The trends continued unabated in the periods of 1995, 1996, 1997, 1998 with the percent of flared gas at maximum levels (of 76.88 to75.00 and 70.21-63.8% and 60.11%) respectively. In the opening decades of 2000 to 2004, at an average of 48.03 percent, flared gas plummeted by 55.20% to 50.52 in 2000 to 2001 and continued (45.64-46.21, and 42.58% in 2002, 2003, 2004). Note also that due to the growing volumes, the percent of flared gas leveled up at 35.67% to 25.54 averages over the later years (2005 to 2007 and 2008-2012) followed by17.60% drop by 2013. Accordingly, the percent of flared gas in the early periods of 1991-1993 reached astronomical levels that surpassed consumption (Table 2).In all those years, the volume of gas production stayed on the rise much of the time with the exception of three different periods (2001-2001, 2007-2008, and 2012 -2013) when it dropped by -9.39 to -5.30 and -9.88%. While during these periods, came multiple gains from 1992-1992 to 2011-2012. Note also additional gains in double digits (14.54- 20.37 and 13.87 to 30.23) from 1997-1998 to 1999-2002 followed by the strong jump of 100.6% in production in 1997 - 2013. These changes show rising gas production with emergent liabilities over the years (Table 3).Table 3. Gas Production Percentage Changes
 |
| |
|
3.2.2. Oil Spills Incidents in the Region
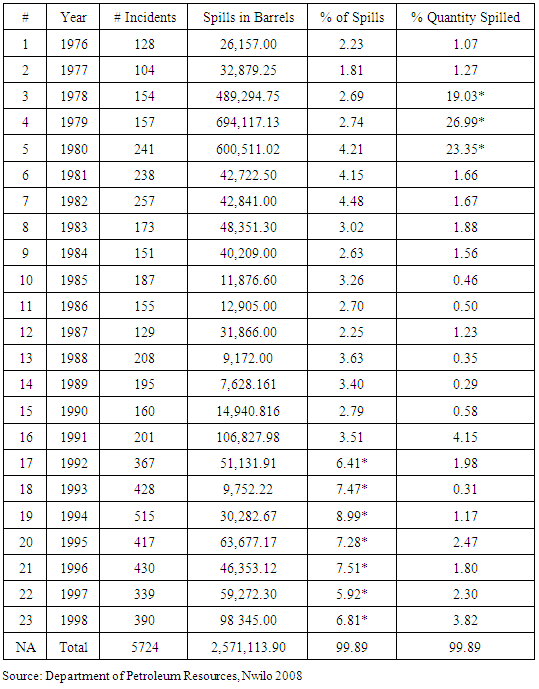
Based on the information from the table, about a total of 2,571,113.90 barrels were spilled over a 22 year period. Notwithstanding the volumes spilled (26,157.00-32,879.25 barrels) in the initial years of 1976 through 1977. In the other periods (1978, 1979 and 1980), the region saw larger quantities of oil spills estimated at 489,299.75 to 600,000 barrels than any time. From 1981 through 1984, the volume of oil spills at over 40,000 barrels not only outpaced the 1976-1977 levels, but a drop off occurred in 1985-1989. This was followed with visible increases of 106,827.9 8 and 51,131.91 barrels during 1991 to 1992. By 1993, 1995 through 1998, spillages reached substantial levels with 1995 and 1996 accounting for 63,677.17-46,353.12 barrels. Just as the other periods, the region saw more spills of immense volumes measuring 59,272.30-98 345.00 barrels in 1997-1998 (Table 4). The threats posed to the Niger Delta ecosystem can be seen with the frequency of spills and the actual quantity of oil involved. As mentioned earlier, of the total of 5,724 incidents in oil spills recorded, about 2,571,113.90 barrels were spilled in the area. The opening number of spills began at 128 to 104 from 1976 to 1977 and continued at 154 to 157 all through 1978 and 1979. By 1980 to 1982, the frequency of spills jumped to 241, 238 and 257 until a multiyear skid (during 1983 to 1987) of 173, 151, 187, 155 and 129. Aside from numerous fluctuations of 208-201 to 195-160, the number of spills in the study area reached higher levels in 1992 to 1998. During these periods, 1995 outpaced other years with 515 spills followed by 1993, 1995, and 1996 with spillages numbering in the four hundreds. With notable number of spills evident in 1992-1998, the incidents during the 1976 -1979 era appeared lower compared to the other periods (Table 4).With twenty three incidents between 1976 through 1988, the percent of spills in the region occurred at sizable levels. In the early years, the percent of spills incidents from 1 to 16th went from 2.23-3.51. Of those years, 1994, 1992, 1995, and 1996 outpaced the other periods in the percent of spills (8.99%-7.47 and 7.28 -7.51%) followed by the 2.74% in 1979. By the early and the mid1980s to early 1990s, the region averaged 3.69-3.02% in the incidents of spills. Even though the early years of 1978-1980 saw much lesser frequency in oil spills, the overwhelming nature of such a disaster at that time in the absence of a reliable emergency preparedness hindered cleanup efforts. In other words, the volumes of spilled oil in those periods were so big that they exceeded the other years and the capacity of the authorities to initiate complete mitigation (Table 4). As a measure of the gravity of what transpired during those years, the periods of 1978, 1979, and 1980 stood out with large percentages (19.03, 26.99, 23.35) in volumes of spilled oil. They also averaged about 23.12% with a total of 69.37% which exceeded the other periods. Regardless of the frequency, there is no doubt the volumes spilled oil in those early periods of 1978-1980 were not only ecologically damaging, but they did reach calamitous proportions given the relatively lower numbers that followed in the later years of 1981-1998 (Table 4). These indicators as stressors and liabilities represent a measure of the threats oil spills pose to the Niger Delta environment. Table 4. Distribution of Oil Spills 1976-1998
 |
| |
|
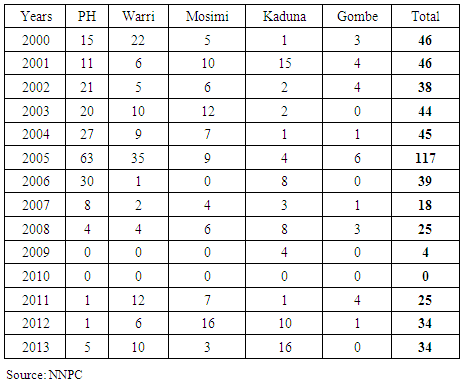
3.2.3. Oil spills by Location and Fire Incidents
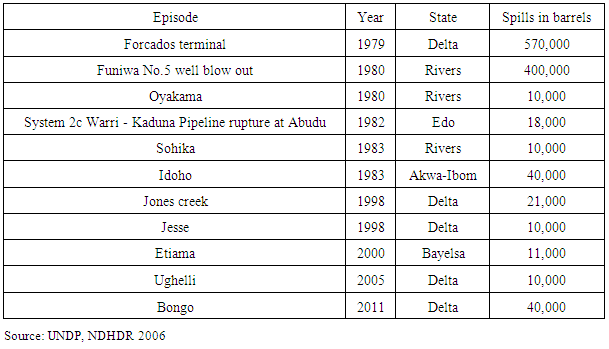
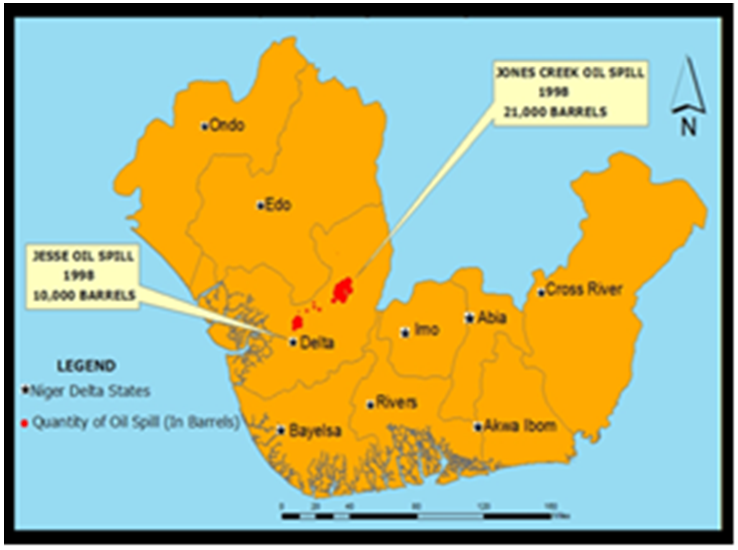
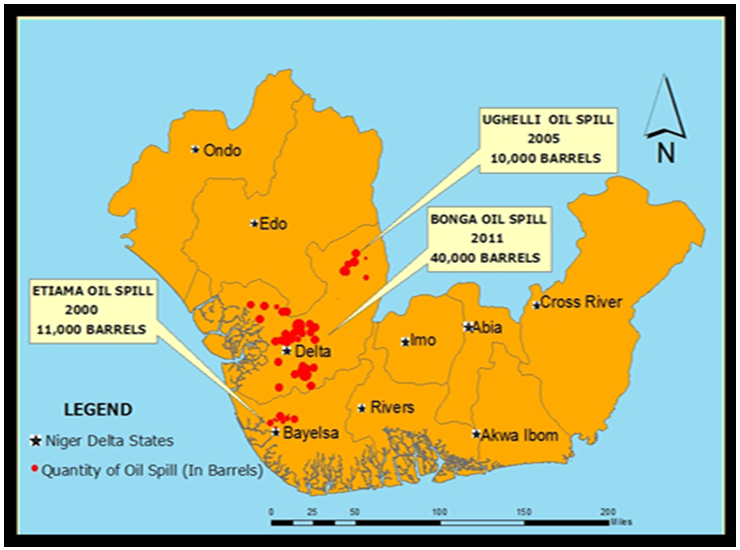
The incidence of oil spills on specific location reached catastrophic proportion between 1979 through 1980 with the Forcados and Funiwa oil spills and well blow out in both Delta and River states. The quantities spilled in these incidents stood at 570,000 to 400,000 barrels of crude petroleum. The same can be said of the Oyakami incident which involved 10,000 barrels during 1980 as well. In the later years, additional cases of oil spills totaling 68,000 barrels occurred in the Warri, Sohika and Idoho areas of Edo, Rivers, and Akwa Ibom between 1982-1983 By 1998-2001, oil spills incidents reemerged with combined 92,000 barrels spewed in Jones creek and Jesse, Ughelli and Bongo in Delta and the Etiam area of Bayelsa states (Table 5). At the same time, casualties from pipe line explosion have also risen in the Niger Delta region with close to 1,300 deaths between 1998 through 2000. Turning to the outbreaks of fire incidents within oil facilities, the Niger Delta oil cities of Port Harcourt and Warri saw more incidents when compared to the other areas in the country during 2000-2013 as presented in the table. Given the volume of activities at the peak of fire outbreaks from 2000-2005, both cities experienced the bulk of most fire mishaps. For both cities, their combined totals in fire accidents ranged from 37-17 and 26-30 in the periods of 2000 and 2001, 2002 through 2003. From 2004 to 2005, the total number of fire incidents in the two major oil cities of Port Harcourt and Warri rose from 36 to 96. Even when the incidents subsided, the two cities also saw notable fire outbreak as well (Appendix 3).Table 5. Summary of Oil Spills in the Niger Delta 1979-2011
 |
| |
|
3.3. Carbon Dioxide (CO2) Emissions from Gas Flaring
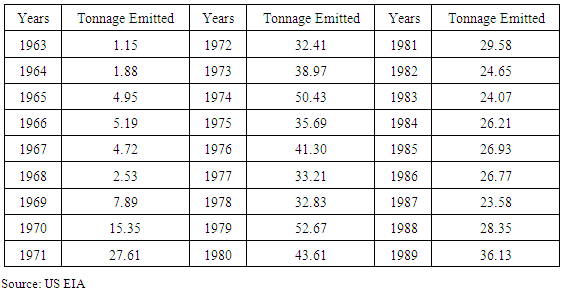
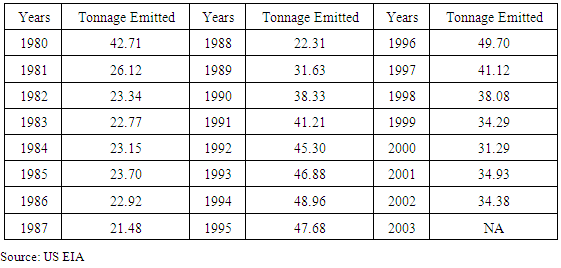
Based on the table, the decades of the 1960s, 1970s and 1980s (1963-1971, 1971-1980 and 1981-1989) each experienced relatively different levels of exposure to CO2 emission from gas flaring. While the initial decades of 1963-1971 saw a much lower emission average of 7.91 million tons, in the two ensuing decades (of 1971-1980 and 1981-1989), the study area averaged much higher values of 40.12 -27.3. The period of 1972 to 1980 had an average CO2 emission volume of 40.1 million tons. The level of CO2 emissions from gas flaring in the fifteen year span shows lower tonnages (of 1.15 - 1.88, 4.95,-5.19 million tons) in 1963 to 1964 and 1965 through 1966 due to low population. By 1967 to 1970, discharged carbon dioxide from gas flaring continued again at different volumes (4.72, 2.53, 7.89, 15.35, and 27.61 million tons). In the second decade of 1972 to 1980, CO2 rose significantly at a mean value of 40.12. However, during 1981-1989, the discharge of carbon dioxide showed variances at an average of 26.26 MT followed by a visible jump to 36.13 in 1989 (Table 6). Furthermore, the CO2 emission trend for the other periods (1980, 1988 and 1996) adds another interesting perspective. The three decadal averages at maximum volumes (of 25.77, 40.28, and 37.68, million tons) surpassed the emission levels of the 1960s in the region. With an opening CO2 emission of 42.71-26.12 million tons all through 1980 1981, note a gradual stability in emission levels from 1982 through 1987 at an average of 22.89 MT. In spite of the 22.31 million tons in emitted carbon dioxide in 1988, the table reveals a mix of emission patterns fluctuating under a common scale in the low to high 30s-40s in Million Tons by 1989 through 2002. Such temporal snapshots of emission trends do indicate that the Delta has been at the receiving end of huge negative externalities over the years (Table 7).Table 6. CO2 Emissions from Gas Flaring 1963-1989 in Million Tons Per Year
 |
| |
|
Table 7. CO2 Emissions from Nigeria’s Gas Flaring 1980-2002
 |
| |
|
3.3.1. CO2 Emission from Fossil Fuel
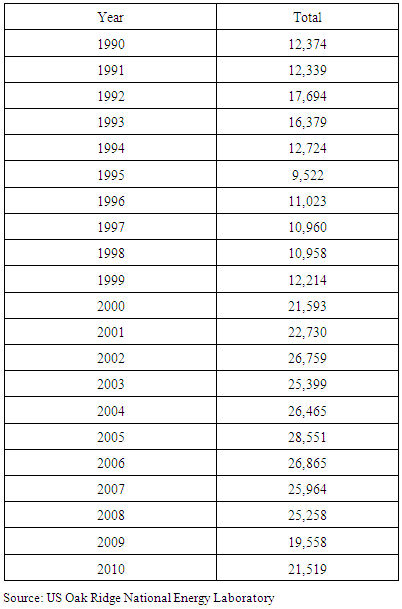
The episodic profile of carbon dioxide emission from fossil fuel is consistent with the continued erosion of Nigeria’s air quality over the years from oil and gas activities. For that reason, note the mounting pace at which carbon dioxide emissions from fossil fuel changed from 1990 levels (1990-1999) to a high frequency within an eleven year span from 2000 to 2010. By 1990 to 1993, the volume of carbon dioxide emissions not only stood firm at 12,374-12,339 to 17,694-16,373 tons, but the discharges still persisted at 12,724 to 9,522 and 11,023–10,960 thousand metric tons in 1994-1997. In the following period of 1998 through 1999, CO2 emission values from fossil fuel soared from 10,958 to 12,214 thousand metric tons. Going by the data on the table, beginning from the 2000-2008, much of the emissions levels at that period, seemed to have exceeded the 21,000 metric tons mark with the exception of 2009 when the emission level plummeted to 19,558 metric tons. The individual breakdown of the trends by year points to maximum emission volumes between 2000 through 2005. This was followed by additional tonnages of 26,865-25,964 and 21,519 for 2006-2010 at levels higher than the 1990s (Table 8).Table 8. CO2 Emissions from Fossil Fuel in Thousand Metric Tons
 |
| |
|
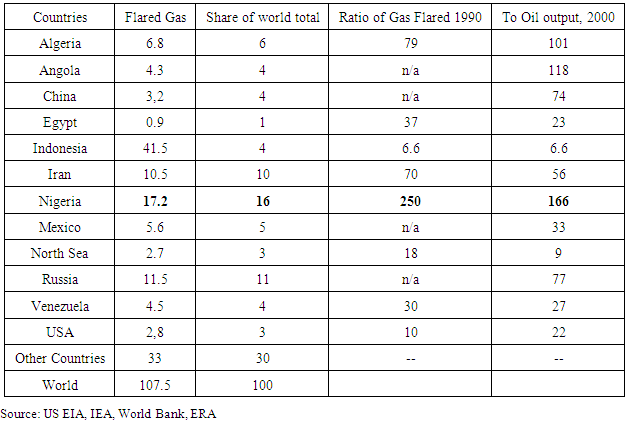
Another way to measure the extent and form of ecological liabilities from oil and gas activities in the Niger Delta region of the country comes from looking at the flaring and ratio of gas flared to oil production between 1990 through 2000 in selected countries. The geographic scope of the distribution with nations of the global south and northern hemisphere puts flared gas figures for Nigeria of 17.2 much higher than the African nations of Angola and Egypt at 4.3 to 0.9. In comparison to the non OPEC economies such as China, Russia, and the United States, note that their flared gas levels of 3.2, 11.5 and 2.8 appeared lower than that of Nigeria. While the other OPEC members like Venezuela and Iran had lower levels of flared gas than Nigeria. The share of the world total ratio of flared gas to oil produced all through 1990 to 2000 still showed Nigeria ahead of the others. At that time, Nigeria’s share of the world total stood at 16 and those of Russia and Iran remained at 11-10 respectively. The figures for other nations like China, USA and Venezuela stood at 3.2, 4.5 and 2.8 individually during these periods. For Nigeria, the ratio of flared gas in 1990 to produced oil in 2000 held firm at 250 to 166 than other nations (Table 9).Table 9. Flaring in Selected Nations in 2000 and Ratio of Gas Flared in 1990
 |
| |
|
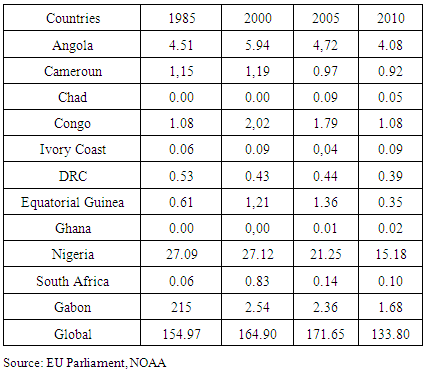
Turning to Gas flaring distribution among Sub-Saharan African Nations between 1985 through 2010, the numbers for Nigeria once gain outpaced other nations therein listed. In 1985 when Nigeria accounted for 27.09 cubic meters in gas flaring, the values of flared gas for other countries were not only miniscule in comparison, but even those that stood out most notably Angola, Cameroons, and Congo and Gabon all had single digit values of 4.51, 1.15, and 1.08, 2.15 in million cubic meters. In the ensuing years of 2000, 2005, to 2010, the gas flaring values for Nigeria at 27.12, 21.25, and 15.18 still exceeded those of the Sub-Saharan African countries at much higher levels. That is still quite substantial when compared to the only nation, Angola whose volumes of flared gas during those years were estimated at 5.94-4.72 and 4.08 million cubic meters. What this implies is that Nigeria’s level of gas flaring by far exceeds those of other nations in Sub-Saharan Africa and that threatens air quality and the fragile ecosystem of the Niger Delta region (Table 10).Table 10. Gas Flaring in Sub Saharan Africa (SSA) in Billion Cubic Meters (BCM)
 |
| |
|
3.4. The Impacts on the Ecosystem
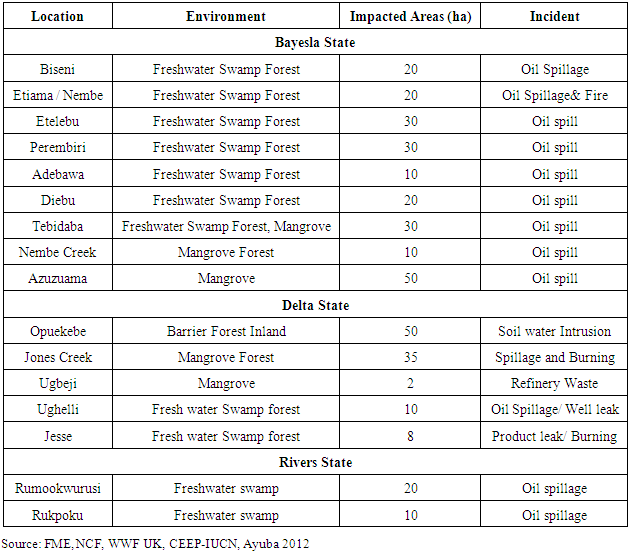
In terms of the threats posed by ecological liabilities of petroleum activities, the table indicates that in the states of Rivers, Delta and Bayelsa, significant acreages of the local ecology such as fresh water swamp forest, mangroves forest, and mangrove swamp, have been severely impacted by recurrent cases of oil spills in the region. Being an ecozone rich in biodiversity with habitats for different life forms, the frequent spill incidents in these places threatens the carrying capacity of these natural systems and the social environment which the local community depend on [26-29]. Among the impacts within the states and communities, Bayelsa experienced more oil spills on about 220 acreages of sensitive fresh water swamps and mangrove, followed by 105 in Delta and another 30 acreages of fresh water swamp in Rivers. The damage done by oil spill incidents impedes critical life support functions of these complex ecosystems, natural processes and ecosystem stability necessary for survival in the Niger Delta. Such impairments also occur at the detriment of adjoining communities especially those in the three states with more acreages of local ecosystem under oil spillage. The breakdown among the areas shows both Azuzuma, and Opuekebe in Bayelsa and Delta with 50 acreages of mangrove and barrier forest inland severally threatened while Rumookwurusi saw 20 acreages of its freshwater swamp laced with oil (Table 11).Table 11. Impacted Natural Habitats in the Delta Ecosystem
 |
| |
|
Further deep in the region, during the month of December of 2008, oil spills disrupted the lives of 60,000 people in Bodo a town in Ogoni land. Estimates of the incident, suggest that the volume of oil spills were as large as the Exxon Valdez spill in Alaska in 1989 that three years after, the impacts continue to disrupt the community [6]. More troubling things about gas flaring in the Niger Delta region comes from the threats posed to farm productivity through the diminished output of crop yield from flare sites. In these areas, most farmlands within a distance of 200 meters from flare sites face the risk of a 100% loss in crop yield, while similar outcome awaits agricultural land areas within 600 meters to 1 kilometers radius. There are also the impacts on fisheries, land use, water quality, and the threats of acid rain and altered hydrology in the region.
3.5. GIS Mapping and Spatial Analysis
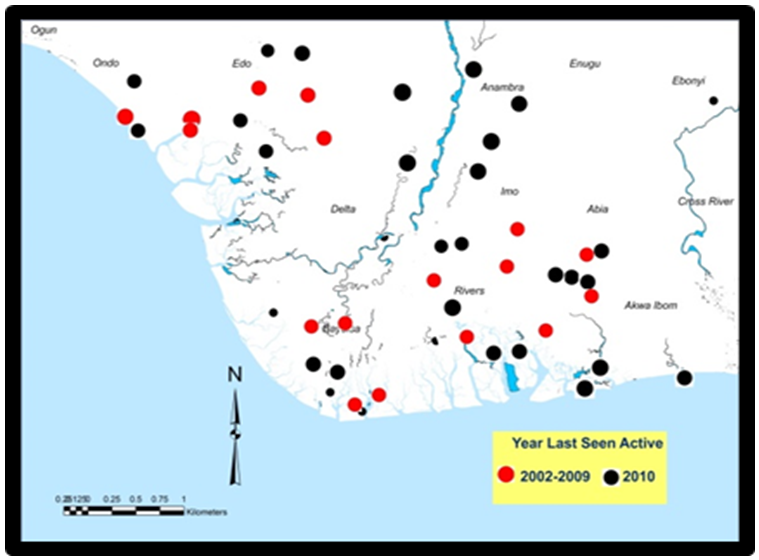
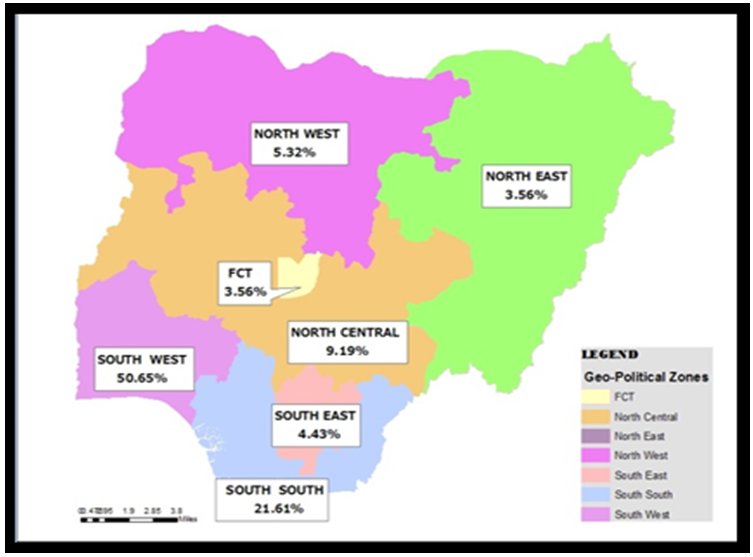
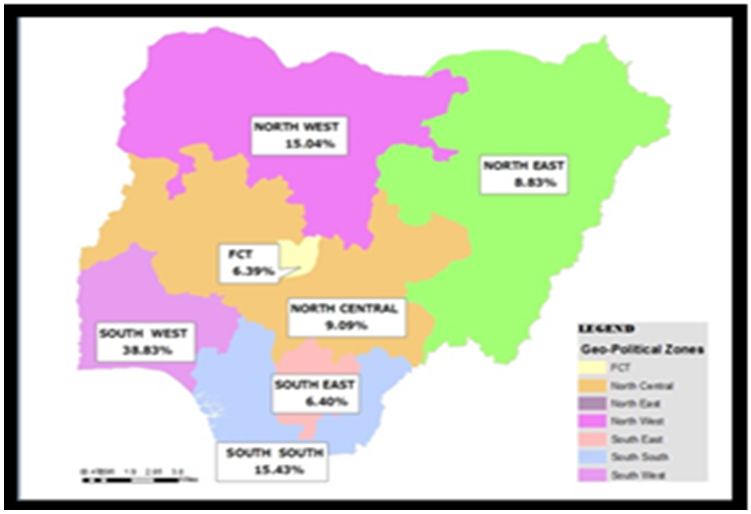
From the GIS mappings, the growing liabilities of oil and gas activities in the Niger Delta region, accelerated a gradual spread of stressors such as fire incidents in oil facilities (Figures 2-5), gas flaring, oil spills on the mangroves and freshwater environments and degradation in some of the states and towns (Figures 6-8). Consistent with the patterns are the threats posed to the natural ecosystem by the presence of oil and gas infrastructure from refineries, oil and gas fields, pipelines, and terminals where spills and pollution are recurrent. This is evident from the spatial dispersal of the trends. Accordingly, the information on the maps point to a continuum of dispersions in induced fire incidents, gas flaring, oil spillages and other liabilities due to the vicinity of pipelines and gas fields to open waters and sensitive natural areas (Figures 2-9). With the mappings showing the threats of fire outbreaks, flaring and spills with dangers to biodiversity through the dicharge of contaminants into streams and the atmosphere in the study area. There exists a vast load of accumulated pollutiants along the lower edges of the maps mostly in the coastal and ecologicaly fragile areas of the Delta. In the past years, begining from the 1970s, 1980s, 1990s and the 2000s, the Niger Delta region saw vast areas of its natural habitats constantly degraded by toxics unleashed from spills.In the case of the spatail dispersion of oil and gas induced fire outbreaks (Figure 2-5), it is evidednt that the producing areas of Port Harcourt and Warri and their adjoining places known for rich tapestry of biodiversity experienced more fire incidents at the expence of ecological health. The dangers of flaring and increased temperature on the lives of citizens can be seen with the vast concentration of these stressors on the airsheds of the Delta within largely built up settlements and natural areas. The spatial analysis of the liabilities of oil and gas between 1979-2005, not only showed the presence of disturbances, but degradation grew with visible damage to the region’s moist tropical ecosystem.Of great importance is the recurrent frequency of oil spills as manifested from 1979 through 2011 in the three states of Edo, Delta and Bayelsa (Figures 6-8). The potential impact of oil and gas liabilities on the ecology also comes with the vast petroleum infrastructure presence in the region (Figure 9). Furthermore, between 2000 through 2010, spatial distribution of hot spots of gas flaring detection and fire seemed concentrated across the region. The same spatial pattern emerges in 2000-2010 when the dispersal of toxics from both fire and flare sites to human habitats stayed visibly intact along the central, eastern, and southern or lower parts of the Delta region (Figures 10-11). The maps also confirmed close proximity of flaring to at risk populations within human settlements along several states in the Niger Delta region between 2000, 2009 and 2010. While future expansions of oil and gas infrastructure are slated in the coming years for the area despite current liabilities, GIS analysis herein helped identify the enormity of risks and the degree to which the natural areas, biodiversity, water quality and the critical ecosystem functions vital to the region were eroded. The belief is that opportunity exists for informed decision and synchronized management of Niger Delta ecosystem from the liabilities posed from oil and gas activities. The spatial distribution of oil to Nigeria’s six geopolitical zones as a conduit for ecological liabilities shows sizable concentration in the Delta region as well. The South-South in the Niger Delta accounted for over 20% in average than other zones in petroleum distribution. The delivery to the South-South from 2007-2013 stood at 21.61-23.89 to 22.31-23.87% and it continued at 24-25% until it dropped to 15.43% in 2013. Aside from the percentages of petroleum distribution (9.19-18.40, to 12.51-16.64, 17-24, 9.09%) for the North central region of the Middle Belt, the share of the other zones most notably, the arid and desert environments of the North west, North east coupled with the South east and FCT remained miniscule compared to the demands from the South west and the South-south. With these demands and regional distributions come ecological externalities at the expense of communities of the Delta where the actual extraction, and processing and refining of petroleum products occur before shipment to consumers and markets in the various geopolitical zones (Figures 12-13).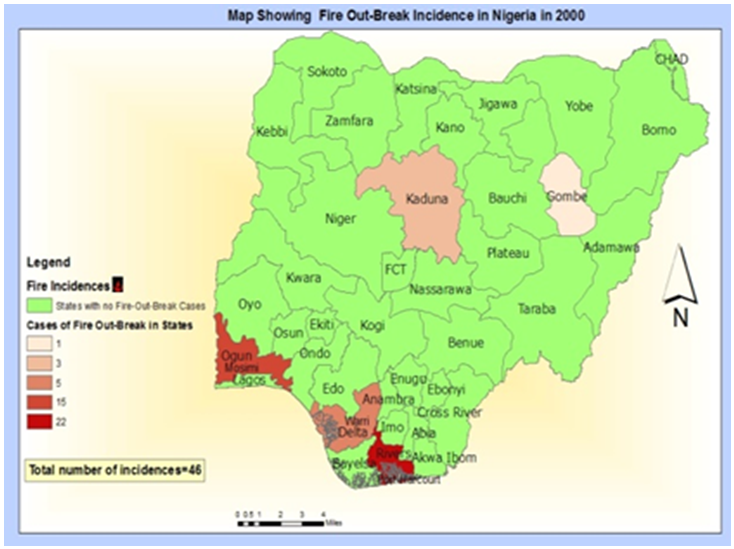 | Figure 2. Fire Incidents in Oil Facilities in Nigeria, in 2000 |
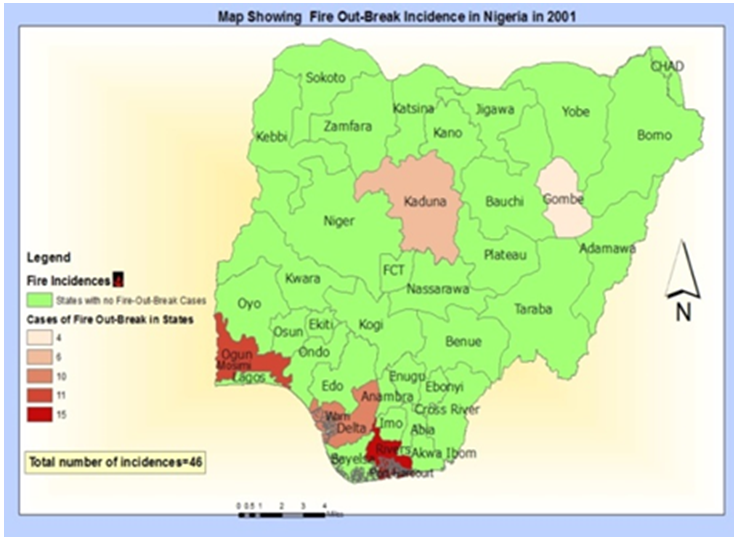 | Figure 3. Fire Incidents in Oil Facilities in Nigeria, in 2001 |
 | Figure 4. Fire Incidents in Oil Facilities in Nigeria, in 2002 |
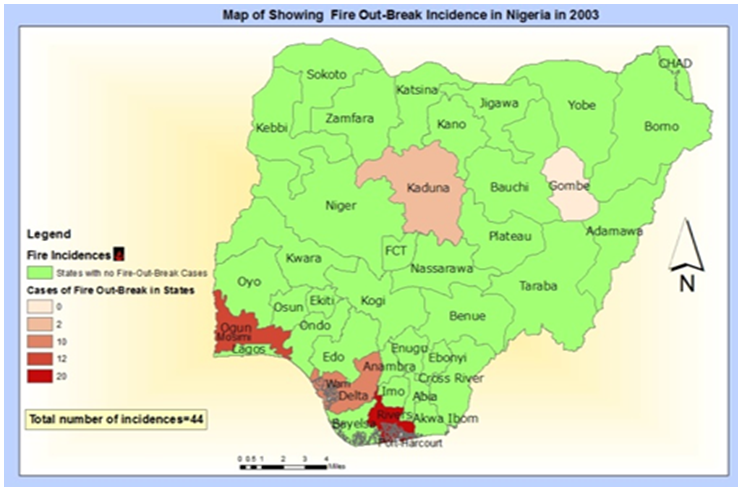 | Figure 5. Fire Incidents in Oil Facilities in Nigeria, in 2003 |
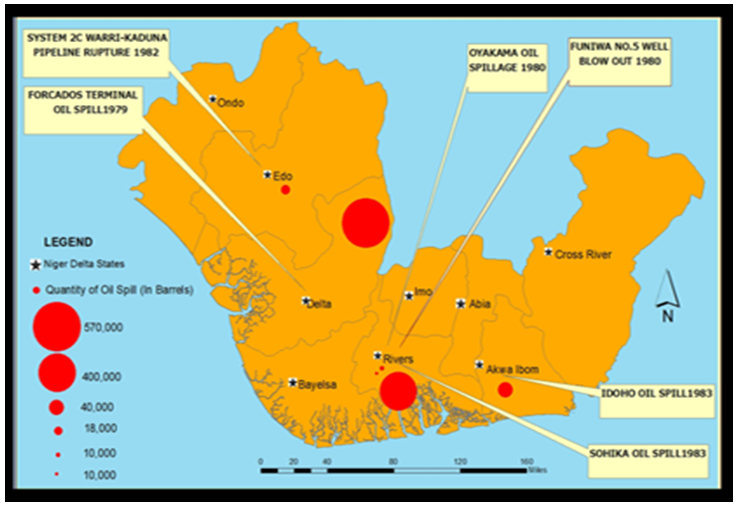 | Figure 6. Oil Spill Incidents, 1979-1982 |
 | Figure 7. Oil Spill Incidents, 1998 |
 | Figure 8. Oil Spill Incidents, 2000-2011 |
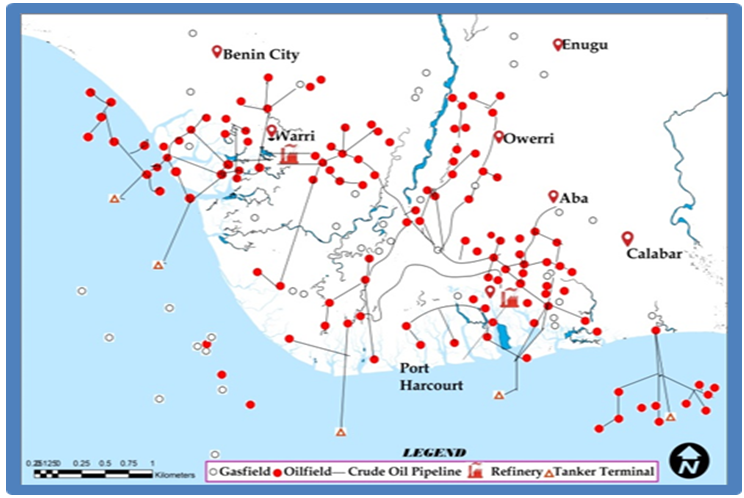 | Figure 9. Oil and Gas Infrastructure and Natural Areas |
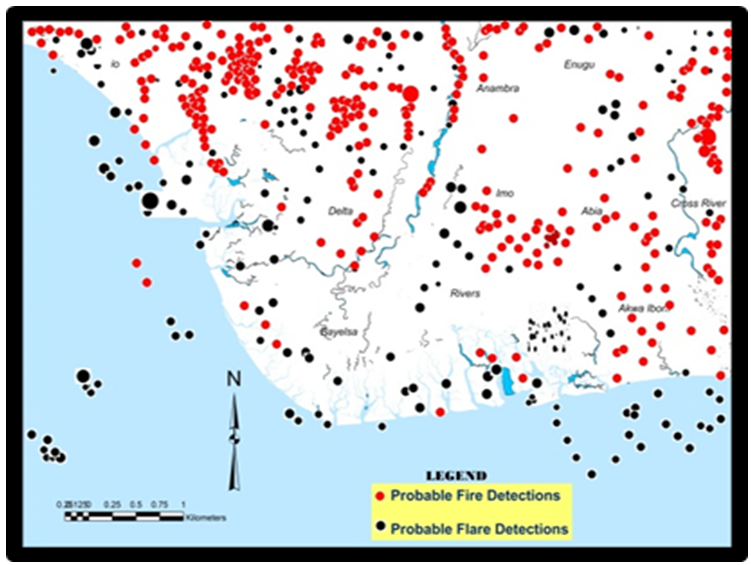 | Figure 10. Hotspot Detections in the Niger Delta, 2000-2010 |
 | Figure 11. Flares in Proximity to Human Habitation, 2002-2010 |
 | Figure 12. Petroleum Delivery to Geopolitical Zones, 2007 |
 | Figure 13. Petroleum Delivery to Geopolitical Zones, 2013 |
3.6. Factors Responsible For the Growing Liabilities
In terms of factors responsible for ecological changes prompted by oil and gas activities, it is evident that they do not operate in a vacuum. They are linked to socio-economic elements of global export and local demands, economic elements, and ineffective policy. Detailed analysis of these elements is presented in the following paragraphs.
3.6.1. Export and Local Demands
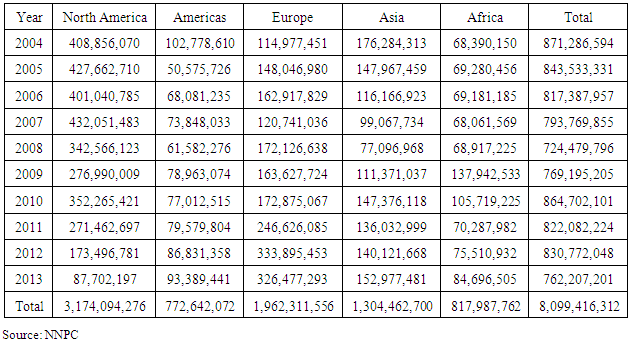
The demand for petroleum products from Nigeria stands out as one of the major factors fuelling the mounting ecological liabilities in the Niger Delta region of the nation [26-29]. In a globalized world where all markets are integrated into a single economic system on a 24-7 circle, the regular exports of petroleum by producing nations such as Nigeria to other countries is very important not only to the exporters, but to the market destinations. Oil cartels involved in the petroleum trade built on exports, influence local pricing in the importing regions where Nigerian crude is heavily traded upon by investors in major international capital markets. In the process, the export of petroleum continues to drive the economy of many nations in both Northern and Southern hemispheres of the world. Considering the relevance, oil export from Nigeria to the North American region in 2004-2013 stood at 3,174,094,276 million barrels followed by European and Asian markets which imported 1,962,311,556 and 1,304,462,700 million barrels. The other destinations consist of South America and the African region where crude oil from Nigeria during the same periods reached similar levels of 772,642,072 - 817,987,762 barrels respectively (Table 12). Table 12. Yearly Export of Petroleum by Region in Barrels
 |
| |
|
Notwithstanding market volatilities which caused soft demand from North America, the uncertainties in global oil export as essential components of Nigeria’s economy puts enormous pressure on fiscal planning in the country for increased output which often results in unintended ecological disasters from spill to gas flaring. Because the inherent disasters do not occur in isolation, the exploration of oil for export requires rights of way and the installation of pipelines which involves vegetation clearance, and eventual spillages of petroleum. This results in the degradation of sensitive mangrove and fresh water swamp marshes and water pollution in fragile ecosystems. As a result, the liabilities in the region could not have happened without the pressures mounted from global export demands and the need for regular revenues from oil export on the part of Nigeria to sustain fiscal expenditure. Furthermore, the regional distribution of petroleum requiring pipelines and access to Nigeria’s six geopolitical zones between 2007 through 2013 can impact the ecology of Niger Delta where the products originate from. In a country with almost 200 million people scattered along 36 states in six geo-political zones, the shipment of petroleum products is vital in driving the basic economic activities of distribution and exchange on a daily basis. In that light, the South west and South-South geopolitical zones: two major commercial hubs critical to the economy of the country saw more petroleum products than the other places over these years. The movement of these products are also not isolated from current level of degradation and liabilities being experienced in the Niger Delta hence the linkages.
3.6.2. Economic Elements
From an economic perspective, the Nigerian government’s main interest in the oil industry is to maximize monetary profits from oil production. With the continual contributions of oil and gas revenues to the national budget over the past decades in Nigeria, oil companies in the country find it more economically expedient to flare the natural gas and pay the insignificant fines than re-inject the gas back into oil wells. Given the insufficient returns from energy markets especially in rural areas oil companies who do not see economic incentives of collecting the gas, just let the flare go on. From a social perspective, the oil producing communities have always experienced marginalization and neglect to the extent that their environment and human health have frequently been a secondary consideration for oil companies and the Nigerian government. While there may be other reasons for the continuous gas flaring, there are strong arguments suggesting that it should have been stopped had it not been for economic interests.
3.6.3. Ineffective Policy
Since 1979 the Nigerian government has had policy in place for regulating gas flaring in the petroleum sector. Based on the 1979 associated gas reinjection rules, no oil company was permitted to flare gas after January 1984 without ministerial authorization. However, the flaring policy and regulations were never well enforced and Nigeria flares over 75% of the associated gas it produces, representing the equivalent of 43 million tons of CO2 per day. Presently, there are over 123 flaring sites located in the Niger delta region, and Nigeria has been regarded as one of the largest emitters of greenhouse gases in Africa due to policy lapses, while in developed nations, several corrective actions have been adopted to address the issues. Being the largest producer of gas in Africa, Nigeria ranks higher than other flaring countries like Russia and Iraq. In as much as the petroleum sector has not done much to end gas flaring in the Niger Delta region in the last 5 decades, the issue is compounded by the slow adoption of the latest technologies needed in the eradication of indiscriminate gas burning. For that, the role of ineffective policy in fuelling the ecological liabilities ravaging the Niger Delta region cannot be overlooked.
4. Discussion
The study area of Southern Nigeria’s Niger Delta as a major revenue base boosts of vast deposits of oil and gas. In the process, over the last decades, increased production of petroleum resources in the Delta has resulted in recurrent ecological liabilities as manifested by oil spills, gas flaring, water pollution and the other forms of environmental degradation. With the contribution of oil and natural gas to the overall economy of Nigeria, one need not forget that the activities of sector has had far bigger negative consequences for the inhabitants of the Niger Delta region for decades. This involves the impairment of natural habitats and agricultural farmlands, the deterioration of water quality and fatalities in pipeline explosions. All in all, mix-scale analysis of the trends showed fluctuations in the form of gains and declines in the natural gas deposits of the Niger Delta between 1991 through 2013. Accordingly, natural gas production in the region grew in 1991-1992 followed by visible increase from 1997 to 2013 and a drop off between 2012 through 2013. During those years, gas production reached an all-time high of 2,580,165,626 MSCF in the fiscal year 2012. This happened in the face of mounting ecological liabilities from gas flaring, the disruption of lives by oil spills, and blazing of the atmosphere from gas burning. Environmental impact analyses of the liabilities points to widespread spills, recurrent flaring and growing incidence of CO2 emissions from blazing and fossil fuel emission in the region. Just as the periods of 1978, 1979 and 1980 saw larger quantities of spills estimated at 489,299.75 to 600,000 barrels than any other time. Between 1976-1979, the frequency of spills appeared lower compared to 1992-1998 period which stood out as the highest at 515, followed by significant levels in the other years most notably 1980-1982, 1988 and 1991. While oil spills incidents at precise locations reached catastrophic proportions from 1979 to 1980 in Delta and Rivers state, Akwa Ibom and Bayelsa, there were about 1,300 pipeline hazards related deaths from 1998-2000. From what transpired in the region, recurring fire incidents in oil facilities remained a concern with both Port Harcourt and Warri facilities accounting for the bulk of those accidents in human casualties than other areas in 2000 through 2013. Just as carbon dioxide emissions from gas flaring and fossil fuels intensified over the years in the region, when compared to the nations in Sub-Saharan Africa and the World, Nigeria’s share of both global and regional thresholds exceeded those of many nations. This reaffirms the growing propensity to ecological liabilities in the oil producing Delta region. In light of these trends and mounting liabilities from oil and gas activities, it came as no surprise that from an operational perspective, some 45.8 billion kilowatts of heat are discharged into the atmosphere of the Niger Delta from the combustion of 1.8 billion cubic feet of gas every day. In addition, flaring and venting of associated gas in the Niger Delta contribute to approximately 35 million metric tons of CO2 per year, with methane (CH4) a large number of hydrocarbons and other forms of greenhouse gases (GHGs) discharged into the atmosphere.The magnitude of these discharges from oil and gas activities coincides with biological and chemical impacts and the growing risks to the local hydrology and cases of water and atmospheric and soil contamination. Accordingly, the Niger Delta region experiences notable scale of acid precipitation since it emerged as one of the core ecological liabilities associated with the oil producing areas in the last decades. The threat of acid rain in such a sensitive ecozone has caused significant damages to the freshwater, coastal and mangrove and benthic ecosystems. This is often manifested by visible declines in biodiversity coupled with reduction of fisheries in the Niger Delta. The other dangers posed to the region involves reduced crop yield, degradation of agricultural land and forest clearance. Aside from the human health risks of exposure to carcinogenic compounds, gas flaring triggers many negative consequences on flora and fauna, and socio-cultural settings at large. The mix-scale tool of GIS was not only effective in mapping numerous externalities from gas flaring to oil spills, but it highlighted the spatial dispersion of stressors impeding marine ecosystems in the Niger Delta. Tracking these liabilities and their gradual spread through distribution from refineries to oil fields and pipelines, affirmed the analytical and visualization proficiency of GIS in pinpointing the emergent liabilities, and risks from the interactions between oil and gas activities, and the fragile ecosystems in the Niger Delta area. Additionally, the activities leading to the liabilities do not operate in isolation; they are linked to socio-economic elements of global export and local demands, economic elements, and ineffective policy in the country. To remedy the problem, the paper calls for improved policy and regulations, assessment of impacts, regular geospatial mapping of liabilities and immediate clean up and recovery of degraded ecosystems in the Delta.
5. Conclusions
This study focused on an analysis of ecological liabilities of oil and gas activities in the Niger Delta region of Southern Nigeria with important outcomes: a) Ecological liabilities of petroleum activities on the rise, b) Mix-scale approach essential in assessing the hazards c) Ecosystem degradation attributed to different factors; d) Mounting impacts evident in the Delta region. From the analysis, it is worth pointing that the ecological liabilities of petroleum activities stayed on the rise with mounting evidence in the Southern region of Nigeria. By and large, the growing effects on the Niger Delta environment are painfully clear and should no longer be discounted given the scale of economic and ecological uncertainties from oil and gas liabilities. With recurrent liabilities, the study area as shown in this study has in the last several years been the epicentre of ecological mishaps by location given its role as crude oil source to other regions of the country and the globe. Spilled crude measured at 570,000 to 400,000 barrels started at Forcados and Funfiwa terminal in 1979 and stretched further to Oyakami with the spewing of anther 10,000 barrels in 1980. Further along these lines, oil spillages tallied at 68,000-92,000 barrels occurred (in 1982-1983 and 1998-2001) in multiple sites from Warri in Delta state to Etiam area of Bayelsa. Considering that fatalities from pipe line blasts rose significantly in the Delta region, 70% of natural gas production were lost to flaring during 1991-1996 while CO2 emission average reached over 20 million in the 1980s. Given the gravity of these liabilities, this study provides a renewed platform for advancing future research in such a vital area. At a time when many have realized the dangers of environmental injustice meted on oil producing states without clean-up efforts. The ability of this enquiry in outlining the liabilities and injustices did provide a frame work for dialogue among stakeholders, seeking policy response in coastal zone planning through remediation measures of site clean-up, and compensation for citizens. Invoking the polluter pay principle in line with policy demands and payment to victims makes the research timely for the Delta. Thus, the analysis provides opportunity to re-examine the call for fairness, efficiency, accountability and sustainability on the part of the oil sector. The belief is that the result has the ingredients to improve the ability of policy makers as a decision support tool in addressing the fallout from unequal presence of greenhouse gases and oil spills in the Delta. This will help reduce the disruption of communities and pressures on fragile ecosystems pushed beyond their limits by oil sector’s liabilities. Taking into account the scale of ecosystem degradation in the Niger Delta from oil and gas activities, mix-scale approach of descriptive statistics and GIS was quite effective in the compilation of information profiling oil production, consumption and the spatial dispersion of stressors impeding marine ecosystem. In the process, GIS mappings showcased a cluster of liabilities involving negative externalities such as fire incidents in oil facilities, gas flaring, contamination of mangroves and freshwater environments from oil spills in the region. Tracking these threats and the recurrent disasters not only buttressed the visualization proficiency of GIS as analytical tool. It pinpointed the risks to open waters and natural areas from the dispersion of induced fire, gas burning, and oil spillages due to their vicinity to pipelines and refineries in a manner that would galvanize intervention in affected areas. Utilising a mix-scale approach ushered new direction to regional assessment of ecological implications of oil and gas liabilities by outlining the exposure of the Delta as shadow ecology of global markets where the demand for oil influence production and negative externality. For that, this method remains very essential in serving the needs of scholars, researching impacts of oil and gas liabilities on fragile ecosystems, and as a result the study represents a step towards effective coastal zone planning and mitigation efforts. Pinpointing these risks through the model, enhances decision making priorities in locales deemed vulnerable to ecological declines with critical benchmarks, for evaluating the conditions of oil producing communities often deprived of their legitimate share of revenues. In so doing, the practical applications of a mix-scale approach, involving spatial mapping and time series, improves our understanding of ecological issues from petroleum operations, in a way that strengthens the development of an index for petroleum resources and regulatory skills, best suited to the eradication of hazards in the oil producing states of the Niger Delta. The ecosystem disturbance in the Southern region from oil and gas activities over the years does not operate in a vacuum. It is attributed to ineffective policy, economic elements, global exports and local demands involving the distribution of oil to the nation’s geopolitical zones. With all these come the right of way for pipelines and their impacts on the ecosystem through the loss of fragile mangrove and fresh water swamp marshes and water pollution. This is compounded by government’s sole interest in revenue generation, and the economic benefits in the sector to flare natural gas with little fines instead of re-injecting the gas back into wells. In outlining the links between socio-economic elements and the liabilities, the study herein did insert a compelling concern into the front pole of energy planning and research. In the absence of such comprehensive analysis focusing on these links, there would have been little understanding of the extent to which various elements located in the oil sector impact the ecology. In that light, the research ushered in a conduit for tracking these elements for the purposes of strengthening mitigation schemes, so that managers can assess the traits with commitment towards risk abatement in fragile ecosystems. Being a step predicated on recovery, understanding these factors quickens the efficacy of decision makers in tracing the stressors, and the role of various elements located within the oil sector in fuelling the liabilities. This should assist the states and communities at risk, and the federal government, in formulating the right schemes for minimizing the vulnerability of coastal marine ecosystems to recurrent liabilities. Seeing that the liabilities associated with various elements impeded the region’s ecosystem, the analysis herein through the development of an index of petroleum resources, can instil novel ways of managing the liabilities threatening oil producing communities. Accordingly, the enquiry provides managers a new index, with a better understanding of unknown dangers that may resurface in the region and for that, must be taken seriously. Thus, pointing out these risks to the region’s marine ecosystem under a new index, exemplifies the right way to minimizing risks from oil and gas activities before it turns into an insuperable challenge.The one major thing that stands out in the research touches on the mounting levels of impacts that besieged oil producing areas of the Niger Delta. Being a region endowed with vast tapestry of biodiversity and large agricultural potentials, and network of wetlands and swamps, the area was at the receiving end of oil induced hazards to the detriment of its inhabitants. The impacts involve the risks from gas flare sites hovering over 100 meters to cultivated farm land area, in riverine communities of the Delta, and the emergent declines in crop yield. With 123 flaring sites in the region, and the fact that Nigeria is the largest emitter of greenhouse gases in Africa. Stressing these threats along with the dangers of oil spills to farm output and biodiversity in a fragile marine ecosystem like the study area remains a major contribution that is of great benefit to policy, and recovery efforts in risk mitigation in coastal farming. The policy significance is that without such an analysis and compilation of the stressors as shown in the study, natural resource managers would not have known the extent to which gas flaring from oil operations impede farm yield to the detriment of communities. This creates the basis for serious consensus building between the oil industry, environmental regulators, and host communities, who are endlessly clamoring for effective mitigation in the Delta region. In so doing, the research added an environmental safeguard dimension critical in detecting hazards, and for ensuring the welfare of communities, and the preservation of a delicate ecosystem already overstretched by unsustainable practices. Showing these warning signals in the face of mounting stressors, dwindling farm output, and ecosystem liabilities driven by petroleum activities remain steps in the right direction. Making citizens aware of these facts gives them the opportunity under a decision support tool, to track areas at risk within their vicinity, and the need to target such places for mitigation due to the dangers to their wellbeing. In showing such vulnerability to ecosystem degradation in the region, the study not only showed its promise in decision support, but it reiterated that the assessment of oil and gas liabilities in the region remains central to the lives of citizens. Bearing in mind the liabilities of petroleum explorations, the large endowments, and the problems posed by negative externalities as shown in this enquiry, the sector and policy makers and researchers in the region will be challenged in the coming years to find critical responses to many pressing queries that are germane to oil and gas resource management. The questions involve how will oil and gas depletion trends be manifested in the Niger Delta Region? How will the scale of recurrent liabilities be felt in the surrounding communities? What are the relationships between petroleum activities and climate change? How is local use of oil in Nigeria impacting the ecology of the Delta? In what way will proposed expansions of petroleum infrastructure and improved regulatory framework influence coastal zone planning? How will the spatial distribution of liabilities be in the next decade? From the framing of these questions, there are plenty prospects from all these for researchers and managers and policy makers to refocus the strategy on oil and gas management with guidelines stressing sustainable and efficient use and ecologically benign ways of drilling and processing for the safety of communities. This will assist the country recognize and respond to its constitutional obligation of securing, and protecting the ecological assets of the communities at risk in the Delta in the years ahead. To that end, the paper offered many suggestions ranging from the strengthening of policy to continued assessment.
Appendix - 1
1.2. Links between Objectives and Methods (Contd.)The paper has five objectives and efforts are made to here to briefly outline the links between them and the methods of the research. There is no attempt to provide a full blown description since it is beyond the intention of the paper to do so. The linkages are presented on the table for clarity purposes.Appendix 1. The Links between Objectives of the Paper and the Methods
 |
| |
|
Appendix - 2
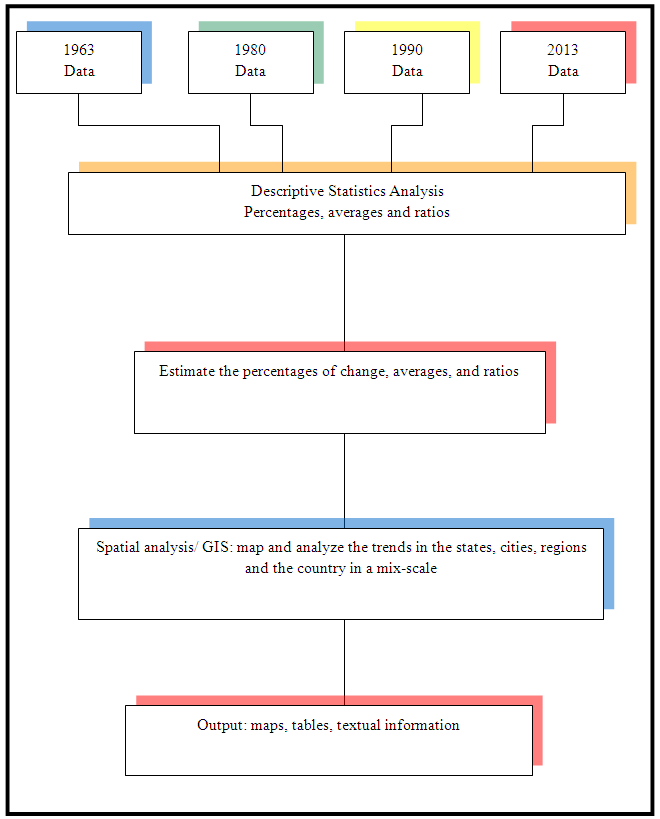
2.3.1. Mix-scale Methods and the Steps Involved (Contd.)The mix-scale approach as highlighted involves serial coverage of region(s) and states on the one level, and the nation on another using basic descriptive statistics and GIS. Because patterns of oil and gas use and production, and degradation and impacts in a nation may not be a true reflection region wide and the state. Collecting data on oil and gas use, and the associated stressors like spills, gas flaring, and CO2 emissions on multiple levels in the study area, through various sources offers reliable path to gage the prevailing liabilities, trends and impacts on the ecosystem. In the process, the analysis focused on a mix-scale with highlights on oil and gas activity and impacts, on the surrounding ecology of individual states or areas at risk recurrently and the region as a whole over time. With the various stages involving a gathering segment under different periods, there is also the handling, and the actual data analysis on various scales. See the flow chart for a summary of the process and the steps involved.Considering that the information assembled as a result of the implementation of these tasks formed the basis for the results, and the discussions and the conclusions presented. The steps entailed the initial grouping of data sets under different periods starting from 1963, 1980, 1990, and 2013 followed by the transformation of the information into relative forms of ratios, percentages and averages through descriptive statistics at the state, national and regional scale. While this process helped show the tabular portrait of oil and gas use, production, export and the impacts through flaring, spills and emissions in affected states of the Delta region. The GIS component illustrated the visual representation of local supplies, stressors, degradation, fire hazards, geographic patterns of spills and gas flaring. Additionally, the emergent spatial patterns in the region and the country were identified under different scopes (characterized in orange, black, green, grey, purple, blue, pink) denoting various trends based on supplies, and liabilities as shown by fire outbreaks, pollution risks, flaring and spillages. The remaining steps involved spatial analysis and output (maps-tables-text) covering the study period, using Arc GIS 10.4 and SPSS 20.0. Given that the spatial units of analysis covered 9 states in the region. GIS as used here remained vital for mapping and analyzing the geographic data. They are versatile tools for studying many types of information and for managing several kinds of resources essential to the sustainability of natural resources in a country, its regions and states. Assessing the ecosystem liabilities in the Niger Delta using such tools is a vital contribution towards the development of novel strategies vital in planning along coastal zones [21].
Appendix - 3
2.3.2. Benefits of GIS Methodology (Contd.)The GIS mapping highlighted the spatial distribution of oil and gas indicators, the trends, liabilities and the risks to ecosystems in various states and the Delta region of Nigeria and the vicinity of the states under a common spatial network. In the current study, the availability of temporal spatial data and analysis played a vital role in facilitating the analysis of oil and gas activities, the production and consumption in Nigeria and the generation of negative ecological externalities over time. The assemblage of the information and analysis using a mix-scale methodology as an emerging approach devoted to the study area, not only quickened the data processing stage of the study, but it unveiled a view of the activities, and the emergent liabilities and risks, posed to environmental quality in a manner not seen before in Nigeria and the Niger Delta. It is essential for effective decision making through timely access to data on the state of the region’s hydrocarbon resources, and observance of mitigation measures vital in the minimization of impacts. In the study area, this involved the generation of maps highlighting distribution patterns across the country, dispersal of fire outbreaks, oil spills and gas flaring incidents and other liabilities. Visualizing the vulnerability of the region to such degradation through emergent liabilities in these settings, not only helped focus the scope of GIS analytics on hydro carbon activities with records of use, the hazards and the trends in affected areas, but it furnished information on the pace at which the distribution, liabilities and impacts in the region and the country are evolving. With the capability to generate temporal spatial information, this perspective serves the needs of decision makers in weighing the gravity of ecological liabilities on fragile habitats, and the impacts of degradation on sensitive mangrove ecosystems and biodiversity in the Niger Delta region. For that, GIS applications under a mix-scale model connected to descriptive statistics can serve a useful purpose in future studies and will advance further through applications in a variety of settings in the study area and elsewhere under conditions rooted in sustainable use of oil and gas and minimization of risks to the ecosystem. This then encourages the development of a regional vision and belief which enhances the capacity to enforce guidelines for sustainable use of oil and gas through efficient planning. Such role of GIS as decision support tool, can lead to genuine consensus as more operators, and managers in Nigeria have faith in the methods and make a concrete decision to increase their uses in future. The applications of this technique in the study along with the results from it therefore make a contribution. to our knowledge of GIS applications under a mix-scale in the analysis of ecosystem liabilities from petroleum activities and the design of strategies and petroleum index at the state, regional and national level. While these techniques play a fundamental role with steps upon which the analysis of ecological impacts of oil and gas activities is based. The research revealed the utility of GIS applications under a mix-scale in oil and gas analysis, and thus serves as a road map for future applications in states and regions threatened by degradation, spills, gas flaring CO2 emissions and acid rain and climate change risks precipitated from the petroleum sector.
Appendix -4
The Number of Fire Incidents in Oil Facilities, 2000-2013
 |
| |
|
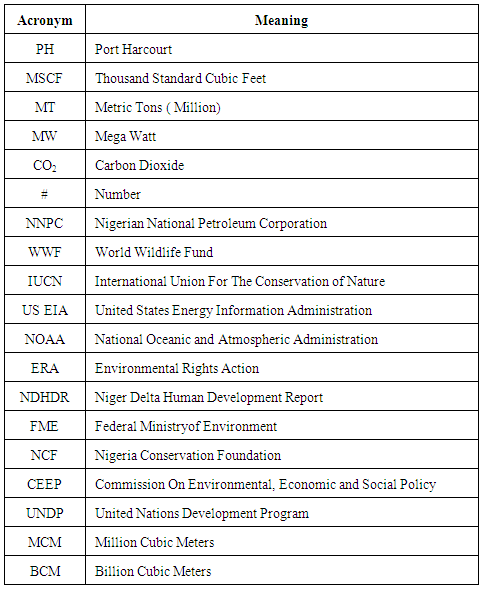
Acronyms
 | The Steps Involved in the Data Analysis under Mix-scale |
References
| [1] | Nga, M. (2006). The Economic Impact of Oil and Gas Production on the Nigerian Economy: A Rural Sector Econometric Model. International Business and Economics Research Journal February 5:2:61-76. |
| [2] | Ugochukwu, C. (2008). Negative Environmental Impacts of Oil Exploration on Biodiversity Management in Niger Delta Area of Nigeria. Impact Assessment and Project Appraisal. 26:2: 139-142. |
| [3] | Orubu, C. (2004). The Nigerian Oil Industry Environmental Diseconomies, Management Strategies and The Need For Community Involvement. Journal of Human Ecology. 16:3:203-214. |
| [4] | Baghebo, M. (2012 Nov-Dec). Environmental Damage Caused By The Activities of Multi National Oil Giants In The Niger Delta Region of Nigeria Journal of Humanities and Social Science 5; 6 9-13. |
| [5] | Ogwu, Friday. (2012 June). Challenges of Oil and Gas Network and the Role of Physical Planners in Nigeria. Forum Ejournal. 41-51. |
| [6] | Amnesty International. (2015). Eyes on Nigeria. Retrieved 14th December 2015 Fromhttp://eyesonnigeria.orgEON_Esxtractives.html. |
| [7] | Chinweze, C. (2012). Oil and Gas Activities and the Nigerian Environment. Proceedings of The 32nd Annual Meeting of The International Association of For Impact Assessment, Porto Portugal, May 27–June, 1st .l 1-8. |
| [8] | Environmental Rights Action (ERA)/Friends of the Earth Nigeria. (2005). “Gas Flaring In Nigeria and Human Rights. Environmental and Economic Monstrosity” ERA. P.H: Rivers State. |
| [9] | Ajugwo, A. (2013). Negative Effects of Gas Flaring: The Nigerian Experience. Journal of Environmental Pollution and Human Health. 1:1 6-8. |
| [10] | Ite. Aniefiok, (2012). Gas Flaring and Venting Associated with Petroleum Exploration in Nigeria’s Niger Delta. American Journal of Environmental Protection. 1:4:70-77. |
| [11] | Raimi, I. (2013). Redressing The Energy Challenge of Gas Flaring In Nigeria The MEEs Approach. Journal of Sustainable Development Studies. 2:2:242-257. |
| [12] | Ismail, S. (2012). Global Impact of Gas Flaring. Energy and Power Engineering. 4:290-302. |
| [13] | Oseji, J. (2011). Environmental Impacts of Gas Flaring Within Unutu Ebedei Gas Plant In Delta State, Nigeria. Archives of Applied Science Research. 3: 272-279. |
| [14] | Ubani, E.C. (2013). Environmental Impact Analyses of Gas Flaring In The Niger Delta Region of Nigeria. American Journal of Scientific and Industrials Research 4:2:246-252. |
| [15] | Abayode, O. (2011). Environmental Implications of Oil Exploration and Exploitation in the Coastal Region of Ondo State, Nigeria. A Regional Planning Appraisal. Journal of Geography and Physical Planning. 4:3:116-121. |
| [16] | Ayuba, K. (2012). Environmental Impacts of Oil Exploration and Exploitation In The Niger Delta of Nigeria. Global Journal of Science Frontier Research Environment and Earth Sciences. 12:3:1-17. |
| [17] | Chindo, M. (2011). Communities Perceived Socio-Economic Impacts of Oil Sands Extraction In Nigeria. Human Geographies: Journal of Studies and Research in Human Geography. 52:69-77. |
| [18] | Merem, E.C. (2006). GIS and Remote Sensing Applications In The Assessment of Change Within a Coastal Environment In The Niger Delta Region of Nigeria. The International Journal of Environmental Health and Public Health. 3:1:98-106. |
| [19] | Merem, E.C. (2010 May). Using GIS In Environmental Management: Green Assessment of The Impacts of Petroleum Activities In The State of Texas. The International Journal of Environmental Research and Public Health. 7:5: 2101-2130. |
| [20] | Merem, E.C. (2007). GIS Applications in Global Environmental Protection: The Case of Environmental Monitoring of Fossil Fuel Emission From Oil and Gas Activities In Africa. World Resources Review 19:3: 657-680. |
| [21] | Merem, E.C. (2011). Environmental Accounting For oil and Natural Gas A North American Case Study. New York, NY: Edwin Mellen Press. |
| [22] | Niger Delta Development Corporation (NDDC). (2004). Niger Delta Master Plan. P.H: Rivers State, NDDC. |
| [23] | Merem E.C. (2015). Ecosystem Liabilities of Oil and Gas Activities in Southern Nigeria. Proceedings of the 12th International Symposium on the Recent Advances in Environmental Health. Jackson: MS. September 15th 2015. |
| [24] | IRIN (2016). Gas Flares Still a Big Issue In The Niger Delta. Retrieved 12th December Fromhttp://www.irinnews.org/report/95034/nigeria-gas-flares-still-burning-issue-niger-delta. |
| [25] | Nigerian National Petroleum Corporation (NNPC). (2013). Various Years Data: Annual Statistical Bulletin. AB: FCT. NNPC Corporate Planning and Strategy. |
| [26] | US Energy Information Administration (EIA). (2015 February). Country Analysis Brief: Nigeria. Washington, D.C: US Department of Energy, 6-4. |
| [27] | US Energy Information Administration (EIA). (2016 May). Country Analysis Brief: Nigeria. Washington, DC: US Department of Energy, 1-20. |
| [28] | Ohimain, E. (2003). Environmental Impacts of Oil Mining Activities in the Niger Delta Mangrove Ecosystem. Proceedings of the 8th International Conference on Mine Water and the Environment. Johannesburg, South Africa: 503-517. |
| [29] | Ohimain, E. (2004). Environmental Impacts of Dredging In The Niger Delta. Terra et Aqua. 97:9-19. |
| [30] | Anyadiegwu, C.I.C. (2012 August-Dec). Overview of Environmental Impacts of Oil and Gas Projects in Nigeria. AFRREV STECH An International Journal of Science and Technology.1:3:66-80. |

 Abstract
 Reference
 Full-Text PDF
 Full-text HTML