-
Paper Information
- Paper Submission
-
Journal Information
- About This Journal
- Editorial Board
- Current Issue
- Archive
- Author Guidelines
- Contact Us
Public Health Research
p-ISSN: 2167-7263 e-ISSN: 2167-7247
2016; 6(6): 161-167
doi:10.5923/j.phr.20160606.03

Determining Risk Factors of Malnutrition among under – Five Children in Sheka Zone, South West Ethiopia Using Ordinal Logistic Regression Analysis
 Abstract
 Reference
 Full-Text PDF
 Full-text HTML
Yilkal Messelu1, Kassahun Trueha2
1MSC in Biostatistics, Department of Statistics, Mizan Tepi University, Ethiopia
2MSC in Applied Statistics, Department of Statistics, Mizan Tepi University, Ethiopia
Correspondence to: Yilkal Messelu, MSC in Biostatistics, Department of Statistics, Mizan Tepi University, Ethiopia.
| Email: |  |
Copyright © 2016 Scientific & Academic Publishing. All Rights Reserved.
This work is licensed under the Creative Commons Attribution International License (CC BY).
http://creativecommons.org/licenses/by/4.0/

Malnutrition continues to be an important public health problem not only in developing country but also in the world. In Ethiopia, child malnutrition rate is one of the most serious public health problems and highest in the world. The aim of this research is to assess prevalence of malnutrition and associated factors among under – five year’s children in Sheka Zone. A community based cross sectional study was conducted on 628 children from April 1-6, 2015. Multistage sampling method was used to select the study subjects. Data was collected using a pre-tested structured questionnaire by trained data collectors. Based on weight – for – age anthropometric index (Z – score) child nutrition status is categorized into three groups severely undernourished (< -3.0), moderately undernourished (-3.0 to -2.01) and nourished (-2.0). Since nutrition status is ordinal, an OLR model – proportional odds model (POM) is used to find predictors of both malnutrition and severe malnutrition. Prevalence of malnutrition in the study area is 29.0 underweight, 37.6 stunting and 16.1 wasting, and also 11.5%, 17.5% and 71% were severely underweight, mildly underweight and nourished respectively. The OLR(POM) model showed that child feeding status, duration of breast feeding, size of child at birth, had fever in the last two weeks, timing of child put to the breast, had diarrhea in the last two weeks, and preceding birth interval were the significant predictors of child malnutrition. Therefore, the concerned body should give implement on nutritional intervention activities at all level of the community especially on children’s feeding status, time when a child is to be put in to the breast after birth, and Children who were small in size at the time of birth.
Keywords: Malnutrition, Ordinal logistic regression, Proportional odds model, under – five children
Cite this paper: Yilkal Messelu, Kassahun Trueha, Determining Risk Factors of Malnutrition among under – Five Children in Sheka Zone, South West Ethiopia Using Ordinal Logistic Regression Analysis, Public Health Research, Vol. 6 No. 6, 2016, pp. 161-167. doi: 10.5923/j.phr.20160606.03.
Article Outline
1. Introduction
- The term malnutrition generally refers to both under nutrition and over nutrition [1, 2]. Proper nutrition is one of the most fundamental aspects of health, but today, malnutrition (measured as poor anthropometric status) continues to be a significant health concern and remains as the single largest cause of child mortality around the world. Poor nutrition can have irreversible effects, permanently impacting a child’s cognitive development, immune system, and overall growth [3].Malnutrition is a serious problem because it causing the deaths of 3.5 million children under 5 years old per- year in the world, as well as it is at third level in the world of the disease burden in this age group [4]. Roughly 30% of children in the world are undernourished and in fact 60% of children for example who die of common diseases like malaria and diarrhea would not have died had not they not been malnourished in the first place [5].Malnutrition continues to be a significant public health problem throughout the low income countries, particularly in South Asia and Sub-Saharan Africa [6]. Ethiopia has the second highest rate of malnutrition in Sub-Saharan Africa [11]. Nationally about 44% stunted, 29% underweight and 10% children were wasted [8]. A community based cross-sectional survey conducted in West Gojam zone, Amhara region revealed that 49.2% children were found to be under-weight, 43.2% of the children under age five were suffering from chronic malnutrition and 14.8% acutely malnourished [9]. According to research conducted in Gimbi district Oromia region indicated that, 32.4% stunted, 23.5% underweight and 15.9% of the children were wasted. Prevalence of severe stunting, severe underweight and severe wasting respectively were 15.7%, 8.0% and 5.7% [10]. Epidemiological studies conducted in developing countries have identified several factors associated with under nutrition, including low parental education, poverty, low maternal intelligence, food insecurity, maternal depression, rural residential area and sub – optimal infant feeding practices [11].In Ethiopia using 2011 DHS data using Bayesian approach with Markov chain Monte Carlo (MCMC) techniques, sex of child, preceding birth interval, birth order of child, place of residence, mother’s education level, toilet facility, number of household members, household economic status, cough, diarrhea and fever were the most important determinants of children nutritional status [12]. A study focused on the southern region of the country using bivariate and multivariate technique, socio-economic such as household economic status and women’s education, and demographic variables such as age, preceding birth interval and number of under-five children were associated with child under nutrition [13].There are a lot of Contributing factors to under nutrition, which needs to be studied, including widespread poverty, limited employment opportunities, poor infrastructure, high population pressure, low education levels, inadequate access to clean water and sanitation, high rates of migration and poor access to health services [11, 14]. Child malnutrition remains a major public health problem in Ethiopia as well as in the study area. Malnutrition cannot be tackled without understanding its causes that is why the study was crucial to identify underlining factors of Malnutrition among under – five years age children in the study area. Therefore, the main aim of this study was to identify the associated factors of child malnutrition in Sheka Zone, south west Ethiopia.
2. Material and Methods
- A community based cross – sectional study design was used to assess magnitude and factors associated with malnutrition in under – five children. The source population was all mothers/caretakers in the household, who has under – five children, who lived in the study area for at least six months earlier to the time of data collection. The Study population is all children under the age of five years living in Sheka Zone South West Ethiopia.The sample size was calculated using a formula for estimation of a single proportion according to the following assumptions: 29% of under-five children are underweight (P) [8], with 95% confidence interval and 5% marginal of error (d). The calculated sample size was 317. As a multistage sampling technique was employed to identify study subjects, a design effect of 1.8 was used. Also 5% was added for non-responses. Thus, the final sample size was 628.The study applies multi – stage sampling scheme using stratified, cluster and simple random sampling. After designing stratification as urban and rural, Yeki Wereda from three rural Woredas and Masha city administration center from two urban city administrations were selected using simple random cluster sampling method. Finaly from 22 rural Kebeles of Yeki Wereda and 2 urban kebeles of masha city administrative center, Shay and Shuny is selected using lottery method for complete enumeration respectively. In case, where there were more than one under-five children in the same household, only one index child was selected by lottery method to collect information on child’s health characteristics. Mothers/ care givers of index under-five children who had other health problem, critically ill and those who did not live at least six-months in the study area prior to the survey were excluded.Dependent variable A Variety of methods are commonly used for assessing the nutritional status of under five children such as anthropometric, clinical, dietary and biochemical measurements but Anthropometric measurements (body dimensions and composition) are often used as proxies for assessing the eventual extent and severity of malnutrition. Weight – for – age anthropometric index is an excellent overall indicator of a population’s nutritional health status. Moreover, weight – for – age is a composite index of weight – for – height and height – for – age [15]. The study considered only weight – for – age anthropometric index instead of weight – for – height and height-for-age to measure the children nutrition status.Based on weight – for – age anthropometric index (Z – score) child nutrition status is categorized into three groups• severely undernourished (< -3.0 Z-score) = 0• moderately undernourished (-3.0 to -2.01 Z-score) and = 1 Nourished
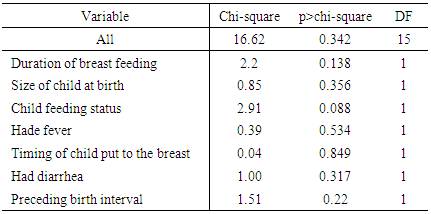
 Thus nutrition status is an ordinal response (dependent) variable grouped from a continuous variable.Independent variablesFive categories of factors were assessed as independent variables;i. Socio-economic and demographic variables; family size, income, place of residence, maternal/paternal education and occupation, Marital status of the respondent, Information access and religion.ii. Child characteristics; Age, Sex, birth order, preceding birth interval, size at birth, Having fever recently, Experience of cough and having diarrhea recently.iii. Child caring practices; feeding practice, maternal access to health facilities, and Vaccination status of a child.iv. Maternal Caring and characteristics; number of children ever born, maternal health care, Breast feeding practice, v. Environmental Health condition; Water supply, sanitation and housing conditionsOrdinal Logistic Regression ModelA number of logistic regression models have been developed for analyzing ordinal response variables. The POM is widely used in epidemiological and biomedical applications but requires strong assumptions that may lead to incorrect interpretations if the assumptions (Adequate Cell Count and Parallel Lines) are violated [16]. The proportional odds model (POM), also known as the cumulative logit model, is appropriate when an originally continuous response variable is later grouped. The cumulative probabilities are the probability that the response Y falls in category i or below, for each possible i, i=1,2,…,c where C is the number of categories. Let Y be the categorical variable with C ordered categories. Cumulative probability reflects the ordering with:
 Let,
Let,  Then the odds of the first
  cumulative probability are:
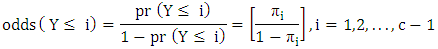 The POM models the log –odds (logits) of the first
  cumulative probabilities as:
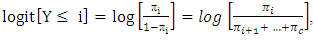
 Then the logit or log-odds of the first
  cumulative probabilities is modeled as a linear function of the explanatory variables
 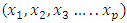 as:
as:
 where
where  is a column vector of P regression coefficients and
  is
is  intercept coefficient.Partial Proportional Odds Model (PPOM)When the proportional odds assumption applies to some but not all of the covariates, the partial proportional odds model may be used.I. Unrestricted partial proportional odds model (PPOM – UR)The unrestricted partial proportional odds model is used when proportional chances assumption is not valid and the coefficients are associated with each category of the response variable
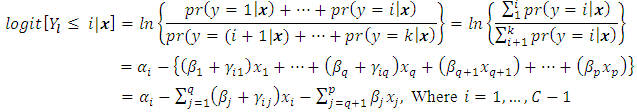 II. Restricted partial proportional odds model (PPOM-R)Is used when Proportional odds assumption not valid and linear relationship for odds ratio (OR) between a co-variable and the response variable.
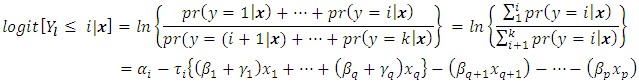 Where
Where 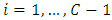 Data processing First the data checked for completeness and consistency. Then it was coded and entered in the computer using EPI6 software. The software has a program (Epi – Nut) to convert nutritional data into Z – scores of the indices; H/A, W/H and W/A taking age and sex into consideration using NCHS reference population standard of WHO then, the data exported to SPSS program for analysis.
3. Results and Discussion
3.1. Results
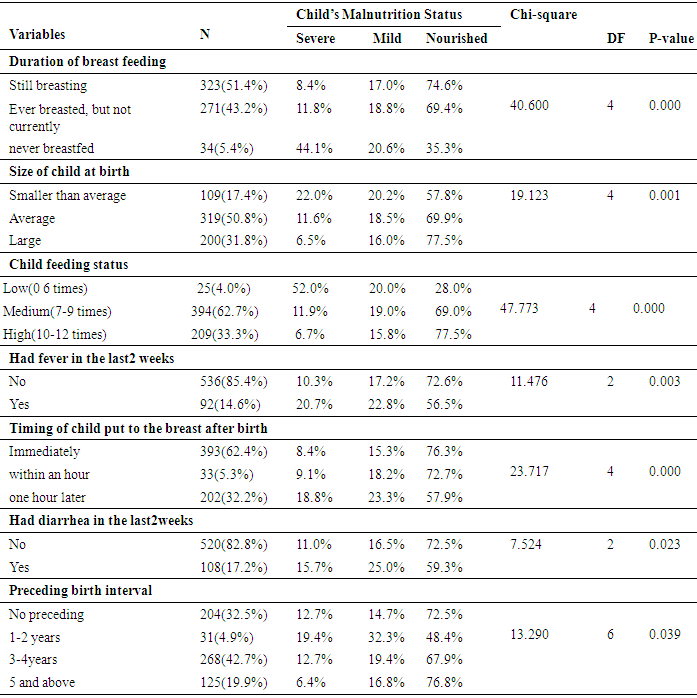
- A total of 628 children Under – five years of age were selected from the target population out of which 29.0%, 37.6% and 16.6% were underweight, stunting and wasting respectively and also 11.5%, 17.5% and 71% were severely underweight, mildly underweight and nourished respectively.The result of table 1 reveals that 4.0 percent of the children under age of five were worst feeding status, 5.4% were never breastfed children, 17.4% were smaller than average at birth, 14.6% had fever in the last two weeks, 32.2% who were put to the breast one hour later of birth, 17.2% had diarrhea in the last two weeks, and 4.9% having 1-2 years preceding birth interval.
|
|
3.2. Discussions of the Result
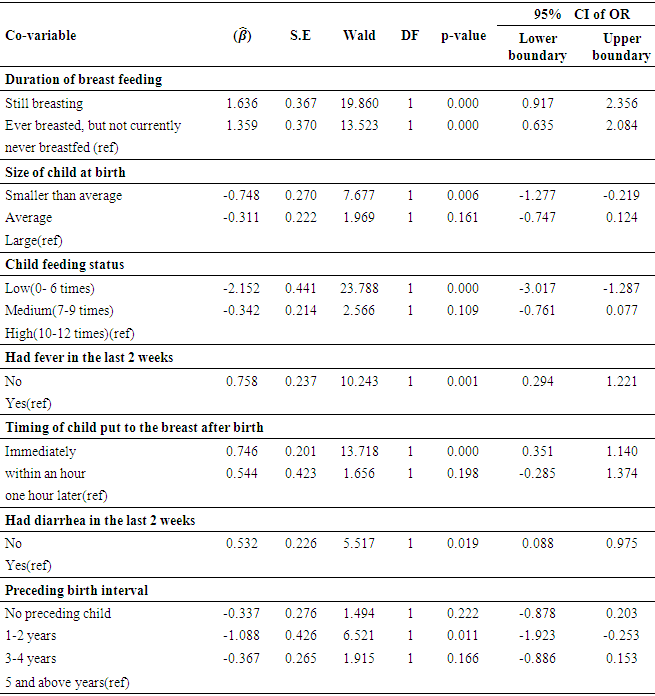
- The results displayed in Table 3 show that duration of breast feeding, size of child at birth, child feeding status, had fever in the last two weeks, Timing of child put to the breast after birth, had diarrhea in the last two weeks, and preceding birth interval were found to be significant predictors of child malnutrition status.
|
4. Conclusions and Recommendations
- In conclusion, there are high prevalence rates of under nutrition (stunting, wasting and underweight) among the under five children in Sheka Zone South west Ethiopia. From the Ordinal logistic regression analysis low feeding status, never breastfed, small size of child at birth, had fever in the last two weeks, child put to the breast one hour later, had diarrhea in the last two weeks, and preceding birth interval 1-2years were significantly associated with increased risk of under nutrition.The above findings are expected to update knowledge of health scientist about possible cause of malnutrition among under – five children and help policy planners to develop strategic plans. The concerned body should give attention for children’s feeding practices because in this study we found that child feeding status, duration of breast feeding and Timing of child put to the breast were significantly contributed for child malnutrition status, those variables are all related to feeding so it is better to give attention how mothers (care taker) are feeding their children. Children who were small in size at the time of birth need special care because those children are more likely to be under nourished, so the health extension workers or individuals in hospital should advise mothers to give a better care for those children. Health workers should work hard on family planning, because preceding birth interval is a significant predictor variable. And children who experience any kind of health problem especially fever and diarrhea should immediately go to health centers.
ACKNOWLEDGEMENTS
- We wish to thank Mizan-Tepi University for financial support, Research and community service Office for their unreserved support; We also want to give our gratitude toward the data collectors and Mr. Mesfin Tesfaye for his important information about the study area, and finally we want to say thank you for our staff members for their important comments, idea and suggestion that we used as an input for this research.