-
Paper Information
- Paper Submission
-
Journal Information
- About This Journal
- Editorial Board
- Current Issue
- Archive
- Author Guidelines
- Contact Us
Public Health Research
p-ISSN: 2167-7263 e-ISSN: 2167-7247
2016; 6(3): 83-90
doi:10.5923/j.phr.20160603.02

Economic Effects of Non-Communicable Diseases on Household Income in Kenya: A Comparative Analysis Perspective
 Abstract
 Reference
 Full-Text PDF
 Full-text HTML
Daniel Mwai, Moses Muriithi
University of Nairobi, School of Economics, Kenya
Correspondence to: Moses Muriithi, University of Nairobi, School of Economics, Kenya.
| Email: |  |
Copyright © 2016 Scientific & Academic Publishing. All Rights Reserved.
This work is licensed under the Creative Commons Attribution International License (CC BY).
http://creativecommons.org/licenses/by/4.0/

Introduction: Non-Communicable Diseases (NCDs) have been on the increase in Kenya over the past decade. This rising trend has led NCDs to account for over 30% of the annual total disease-related deaths in the country. Between 2005 and 2009, major NCDs (cancer, cardiovascular diseases, respiratory ailments and diabetes) accounted for over half of the top 20 causes of disease-related deaths in Kenya. The high expenditures for managing NCDs expose households to risks of financial catastrophe and poverty. Methodology:The paper has adopted an econometric method to investigate the effects of NCDs on household income in Kenya. Further, the paper establishes the comparative analysis of NCDs with illnesses due to communicable diseases (CDs) in order to argue for the potential effect of NCDs, relative to other illnesses, on households’ income. Sample design and possible heterogeneity arising from unobserved households’ characteristics correlated with household income levels has been addressed. To achieve this, Kenya Household Health Expenditure and Utilization Survey of 2007 data is utilized. Findings, Conclusions and Policy Recommendations: The key finding is that, while general ailments reduce household income by 13.63%, NCDs reduce household income by 28.64%. NCDs are associated with a 23.17% reduction in household income relative to a household affected by communicable disease. Another key finding is that, although all types of ailments have negative effects on household income and welfare, NCDs have more severe impacts. The key policy recommendation is for the government to put in place a health financing strategy for NCDs, and especially one that subsidizes the cost of care and treatment of NCDs.
Keywords: Non-Communicable Diseases (NCDs), Catastrophic health expenditures, Household impoverishment
Cite this paper: Daniel Mwai, Moses Muriithi, Economic Effects of Non-Communicable Diseases on Household Income in Kenya: A Comparative Analysis Perspective, Public Health Research, Vol. 6 No. 3, 2016, pp. 83-90. doi: 10.5923/j.phr.20160603.02.
Article Outline
1. Introduction
- Non-Communicable Diseases (NCDs) are increasingly posing a major healthcare challenge in middle and low income countries just like it had been in high developed countries. Communicable diseases were the main causes of death around the world when life expectancy was often limited by uncontrollable epidemics for centuries. Medical research successes in vaccines and antibiotics, tied with improvements in living standards have ushered in a new dawn of managing communicable diseases [1, 2]. Even though communicable diseases such as malaria, pneumonia, diarrhoea and peri-natal complications continue to threaten healthcare management systems in developing countries, predictions show that at least 7 out of 10 deaths in developing countries by 2020 will be related to NCDs [3]. As observed, developing countries are currently facing a twin challenge of controlling both communicable and non-communicable diseases with limited resources [4]. For example it is notable that in 2005 NCDs accounted for 60% of all deaths and 47% of global burden of disease [5].Although NCDs in Kenya are becoming more prevalent, the population as well as the government lacks adequate awareness and knowledge on the impact and control channels of NCDs [2]. The key NCDs can be grouped into malignant neoplasm (cancer), cardiovascular attacks, respiratory ailments and diabetes. They are together responsible for most of disease-related deaths in Kenya [4]. The Global Medicine [6] also found that most NCDs in Kenya are detected late due to lack of awareness, and this makes their treatment very costly. The implication is that, given that only about 6% of Kenyan population has a form of health insurance, a large population is at a big risk of catastrophic health expenditure (Mwai., and Muriithi, [38]). Despite this, it is evident that Kenya is yet to prioritize prevention and control of NCDs, as noted in its Vision 2030. This low prioritization, or lack of it, is partly due to lack of empirical understanding on the impact of NCDs on individuals and households [4, 7, 8, 9].Several studies done on the costs of treatment and care have shown that NCDs emaciates disposable incomes thus, leaving families with less to use on other critical needs such as food and education [10-14]. It is also notable that NCDs eat into a household’s current income and reduces the future productivity of the patients [15]. For developing countries, challenges in accessing drugs for NCDs are piling, with the cost of medicine accounting for at least half of the out-of-pocket (OOP) spending for the majority of the households [16]. In India, on the other hand, it was observed that at least 25% of people hospitalized over chronic diseases usually end up poorer, and in most cases end up with huge debts [17].The aim of this paper is thus to explore the effects of NCDs on household’s income in Kenya by means of an econometric approach that controls for endogeneity and heterogeneity estimation problems.
2. Methodology and Data
2.1. Analytical Framework
- The framework begins with a straightforward household utility maximizing model developed by Becker [18, 19]. The unitary household model of consumer behaviour assumes that a household behaves as if it maximizes a sole price-independent social benefit function subject to a family budget restriction [20]. Household choices are determined jointly, implying that household members have identical preferences, or that within a household there is a single decision maker who makes choices for the entire household. The choices maximize utility of all the household members and satisfy the Beckerian notion of caring [20]. Equation 1 shows that household members whose characteristics are given by
 are said to derive benefit from the consumption of goods
  . Total household income
  is the sum of incomes earned by each household member (labour income,
  and non-labour income,
  ), and the income earned by the household members jointly,
  , [20]. Hence, a household with members
  is faced with the following utility maximization problem:
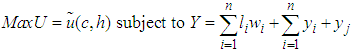 | (1) |
 such as age, household size, gender of the household head and epidemiological environment such as prevalence of NCDs
  or sickness
2.2. Estimation Technique
- The paper estimated the impact of sickness on household income regardless of the disease type -whether NCD or CD. This was followed by an estimate of an income equation from a sub-sample of households reporting being healthy and those reporting an NCD. Thirdly, we estimated the income equation from a sub-sample of households affected by NCDs and those affected by CDs. The essence of using three sub-samples was to determine whether the effects of NCDs differ significantly between households without any illness, households afflicted by NCDs, and households affected by communicable diseases (CDs). This study assumed that changes in household income are accounted for by its characteristics, the epidemiological environment, and institutional factors such as education. Following Gravelle and Rees [21], Kioko [22], Mwabu [23, 24], Wooldridge [25, 26], and Laxmanayan [27], and with appropriate modifications, this paper examined the effect of sickness
 and NCDs on household income by estimating equation 2 and 5.
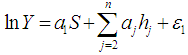 | (2) |
 | (3) |
 and
and  are the disturbance terms.
 | (4) |
 | (5) |
2.3. Data Source
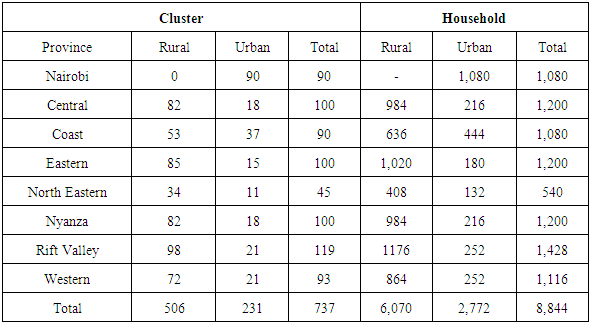
- The data is sourced from a cross-section survey that was conducted under the 2007 Kenya Household Expenditure and Utilization Survey (KHHEUS). The design of the survey is discussed in KHHEUS 2007. KHHEUS gathered information on a wide range of socio-economic indicators which were intended to monitor, analyse and measure the development made in improving living standards. The sample comprised of 8,844 households of which 6,072 were rural and 2,772 were urban. A response rate of 96 per cent was achieved meaning 8,453 household were successfully interviewed. From the 8,423 households, 39,798 individuals were interviewed. The survey covered all the eight provinces in Kenya with a total of 737 clusters selected and divided into 506 rural and 231 urban. Appendix Table A1 provides the sampling design.
|
2.4. Ethical Consideration
- The data used in this study did not require any field work for it is derived from a survey conducted by Kenya National Bureau of Statistics (KNBS), which is a national body bestowed with the responsibility of conducting national surveys on living standards in the country. Thus we did not require an ethical letter or any other form of permission for using this data, since it is available on request from the Ministry of Planning, or the Kenya National Bureau of Statistics.
3. Discussion of Results
3.1. Descriptive Statistics
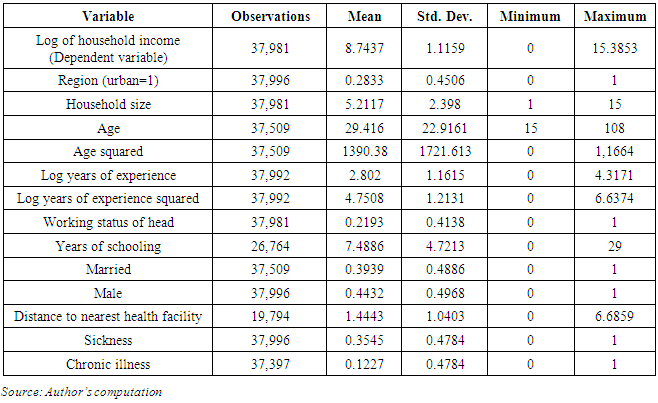
- Descriptive statistics are presented in Appendix Table 2. The respondents in the survey had a mean age of 29.42 years. Their average schooling was 7.49 years, and the average household size was 5.21 persons. About 39.39% of the respondents were married, and 21.09% of household heads were working. About 35% of the households reported illness, with about 12% of the sick suffering from NCDs.
|
3.2. Regression Results
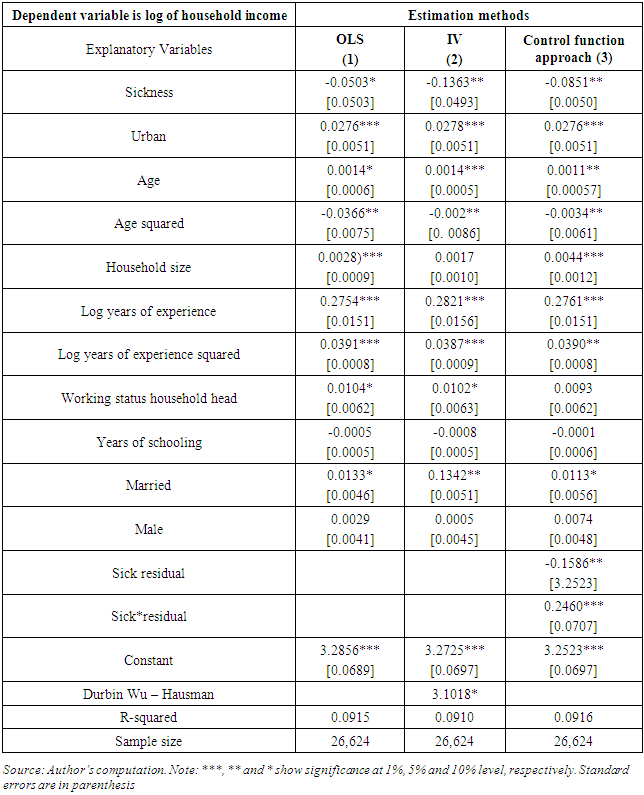
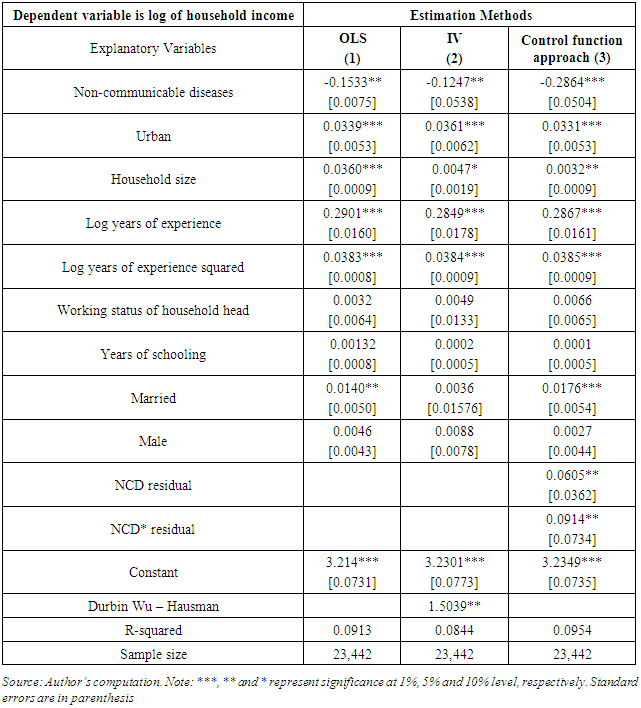
- In interpreting the results, we note that coefficients of variables in semi-logarithmic functions are interpreted as percentage effects by multiplying the coefficients by 100. But this is only correct for continuous variables. Results would be misleading for dummy variables. To resolve the problem, our results were interpreted following the approach suggested by Halverson and Palmquist [33], where the relative effect of a dummy variable is expressed as
 and the percentage effect is
  The estimated individual models explaining the impact of sickness and NCDs on household income are presented in Tables 1, 2 and 3. The table presents the results with and without controls for endogeneity and heterogeneity problem. For all models, controlling for endogeneity and heterogeneity problem has some marginal impact on the betas and levels of significance of some variables.
 3.2.1. Impact of Sickness on Household Income
- The results indicate that sickness was a significant determinant of household income, and that its effect is negative.1 The income of a household afflicted by sickness is 8.89% lower than for a household free from sickness. In addition, the coefficient on sickness residual is statistically significant, confirming that the sickness is endogenous. These results are consistent with other in the literature [23, 35, 36] who found that households derive disutility from sickness. Other factors found to be key determinants of household income include area of residence, marital status, household size, work experience, age and age squared.Living in Urban relative to rural area has a significant and positive effect on household income. Households residing in urban areas have 3.04% higher income compared to those living in rural areas. Marital status is significantly and positively associated with household income. Households with husband and wife have 1.15% higher income compared to a single person’s household. Married individuals often receive spousal support, and this has positive effects on household income.Work experience as measured by the number of years a person has worked in a certain job is positive and highly significant in the three models. This suggests that work experience increases household income by 27.61%.
3.2.2. Impact of NCDs on Household Income
- Based on control function approach estimations in Table 2, reduction of income due to NCDs is higher relative to those with no illness. NCDs are associated with a 33.16% reduction in household income.This is higher than the 8.89% reported in Table 1 column 4, implying that NCDs are associated with higher welfare losses.The results are consistent with those of Brummet et al [37], which conclude that sickness through NCDs reduce household income significantly. This is explained by lowered earnings occasioned by lower productivity, which is a precipitation of a prolonged care and treatment period associated with NCD.
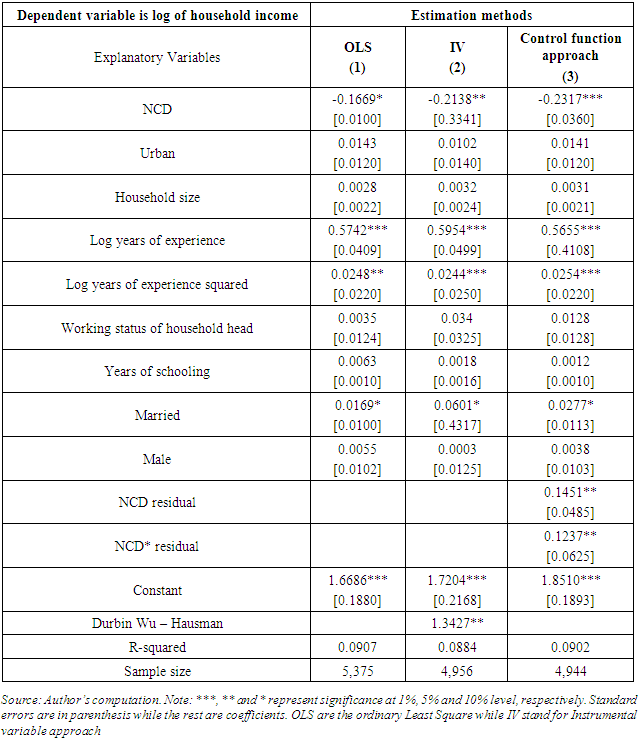
3.2.3. Impact of Communicable and NCDs on Household Income
- Table 3 provides the estimates of NCDs on household income relative to other illnesses. The results discussed are obtained from a sub-sample of households that reported illness. The results from the control function show that the coefficient of NCD is negative and significant. The incomes of households with an NCD case are 26.07% lower than households with a communicable disease. This indicates that the loss in household income due to NCDs is greater relative to losses from communicable diseases. This could be attributable to the high treatment cost of NCDs, as well as lost labour hours by household members offering care to the affected member(s) of the society. This supports the notion that some communicable diseases such as common flu require non-expensive care to treat as opposed to common NCDs such as diabetes or high blood pressure.
|
4. Conclusions and Policy Recommendations
- Currently NCDs is the leading causes of morbidity and mortality in Kenya. Their draining effect on financial and time resources has adversely affected household income and welfare. From the estimates, although all types of sickness have depressing effects on income and welfare of the household, NCDs have more severe impacts. It is notable from this study that health expenditure on NCDs has significant economic losses and poverty impact on households in Kenya. The study proposes that the government, development partners and other key stake holder in health sector put in place measures to halt the rising prevalence of NCDs. One such measure is putting in place a health financing plan through health insurance (See Mwai., and Muriithi, [38]), and resource pooling as a route towards social protection. Education which was found to be inversely related with NCDs is another policy dimension that can be considered. Improvement in the level of education in the public could decrease the households’ risk of developing an NCD. The Government of Kenya needs to set aside a budget for country-wide campaigns to increase awareness on NCDs risk factors and early detection of symptoms with a view to reducing mortalities and costs associated with NCDs.
Note
- 1. Halverson and Palmquist (1980) suggested a transformation of dummy variable where the relative effect of a dummy variable is expressed as
 and hence the percentage effect is