-
Paper Information
- Paper Submission
-
Journal Information
- About This Journal
- Editorial Board
- Current Issue
- Archive
- Author Guidelines
- Contact Us
Public Health Research
p-ISSN: 2167-7263 e-ISSN: 2167-7247
2016; 6(1): 24-30
doi:10.5923/j.phr.20160601.03

Assessment of Indoor Air Quality in Neonatal Intensive Care Units in Government Hospitals in Gaza Strip, Palestine
 Abstract
 Reference
 Full-Text PDF
 Full-text HTML
Yousef Aljeesh1, Wesam Al Madhoun2, 3, Iyad Abu Shamh4, Mariana Arcaya5
1Associate Professor in Public Health, Islamic University, Gaza Strip, Palestine
2Assistant Professor of Environmental Engineering, Islamic University, Gaza Strip, Palestine
3MIT-UTM Malaysia Sustainable Cities Program, Universiti Teknologi Malaysia, Johor Bharu, Malaysia
4Nursing Supervisor, Al Aqsa Martyrs Hospital, Gaza Strip, Palestine
5Department of Urban Planning, Massachusetts Institute of Technology (MIT), Cambridge, MA, US
Correspondence to: Iyad Abu Shamh, Nursing Supervisor, Al Aqsa Martyrs Hospital, Gaza Strip, Palestine.
| Email: |  |
Copyright © 2016 Scientific & Academic Publishing. All Rights Reserved.
This work is licensed under the Creative Commons Attribution International License (CC BY).
http://creativecommons.org/licenses/by/4.0/

This study was conducted to assess indoor air quality (IAQ) in three neonatal intensive care units (NICUs), which were chosen to geographically represent the Gaza strip. The study collected both: objective temperature and air quality measures ofcarbon dioxide (CO2), carbon monoxide (CO), temperature, relative humidity (RH%) and suspended particles (PM10, PM2.5); and clinical staff perceptions of indoor air quality and its impact. The study conducted daily air quality measurements between 4 March until 22 March 2013, and gathered 108 questionnaires. The study showed that the average concentrations of carbon dioxide were often close to the maximum standard of the United States Environmental Protection Agency, and sometimes exceed the limit, especially in the NICU of Shifa Hospital. Temperature fell within normal ranges, but approached recommended limits at Shifa Hospital. Carbon monoxide and suspended particle concentrations and relative humidity were within the standards recommended by the Environmental Protection Agency in all three NICUs. More than half of the clinical staff (60%) suffered from sick building syndrome, 83% suffer from tiredness and fatigue, and 76% suffer from headache. Nearly 85% believe that these symptoms are related to their workplace, and 71% report disappearance of the symptoms after they leave work. We conclude that indoor air quality merits more attention from the Ministry of Health, and that NICU staff be engaged around issues of environmental health.
Keywords: Indoor air quality, Neonatal intensive care unit, Carbon monoxide, Carbon dioxide, Particulate matter
Cite this paper: Yousef Aljeesh, Wesam Al Madhoun, Iyad Abu Shamh, Mariana Arcaya, Assessment of Indoor Air Quality in Neonatal Intensive Care Units in Government Hospitals in Gaza Strip, Palestine, Public Health Research, Vol. 6 No. 1, 2016, pp. 24-30. doi: 10.5923/j.phr.20160601.03.
Article Outline
1. Introduction
- Clean air is a basic requirement of life, and since most of our time is spent in indoor environments, such as offices, schools, homes, and hospitals, the quality of indoor air is important for human health and well-being. Indoor air quality (IAQ) in neonatal wards may affect both the health of employees and the treatment of neonates. Poor indoor air quality at work decreases employees’ comfort and work efficiency and may also cause some work-related symptoms and diseases [1]. Furthermore, indoor air problems have been associated with a decrease in work productivity [2]. Sick building syndrome (SBS) is a commonly used term for symptoms resulting from problems with IAQ. Complaints common to SBS include allergic rhinitis, headaches, flu-like symptoms, watering of eyes and difficulty in breathing [3]. The first multi-site study of SBS was published in 1984 [4]. In confined environments indoor air quality can be affected by chemical (carbon oxides, carbon monoxide (CO) and carbon dioxide (CO2), environ-mental tobacco smoke, formaldehyde, and volatile organic compounds) [5] and physical (ventilation rate, dampness, temperature, and non-ionizing and ionizing radiation) factors [6].SBS describes building occupants experiencing acute health and comfort effects that appear to be linked to time spent in the building, without a specific illness or cause that can be identified. The complaints may be localized in particular room or zone, or may be widespread throughout the building [7].According to U.S.EPA, SBS is strongly suspected when the following circumstances are present: Symptoms are temporally related to time spent in a particular building or part of building, symptoms resolve when the individual is not in the building, symptoms recur seasonally (e.g., with heating or cooling cycles), and co-workers, peers have noted similar complaints. In the office environment, SBS may have important economic implications affecting productivity. M Indoor air quality is especially important in schools, day care centers, hospitals and nursing homes for the elderly, because children, hospital patients and the elderly are sensitive subgroups [8]. CO2 is generally not found at hazardous levels in non-industrial indoor environments. Occupants may experience health problems in workplaces where levels of CO2 are high. including headaches, dizziness, restlessness, and tiredness . Most of these symptoms are usually due to the other contaminants in the air that also build up as a result of insufficient ventilation rather than from the CO2 itself. However, CO2 itself can cause headache, dizziness, nausea and other symptoms when exposed to levels above 5000 ppm for many hours [9].High or low relative humidity (RH%) can cause discomfort among occupants. According to Berglund, low air humidity affects comfort and health and in wintertime, when the relative air humidity indoor drops, respiratory problems increase [10]. High relative air humidity may contribute to water condensation and microbial growth, indirectly causing SBS [8]. Low relative air humidity or dry air has also been shown to cause dry and itchy skin, fatigue, feeling of illness and sickness. The risk of bacteria and virus attacks is normally higher in environments with a high RH% [11], but with particles (dust) in the air, even dry environments may represent a health hazard. The dry particle mass may cause an imbalance in the mucous membrane humidity, with resulting irritation [12].Keeping the body at the normal temperature is important for comfort and health. Generally speaking, a healthy person feels most comfortable in an environment where the body can easily maintain a thermal balance with the surrounding air [13]. Both over-cooled and over-heated indoor temperatures will bring adverse health effects to occupants. SBS symptoms are observed when occupants find the temperature too warm or too cold [14]. But in western countries, most studies are related to heating (too warm). In contrast, in Hong Kong workplaces are usually air-conditioned, SBS sometimes is simplified and renamed "air-conditioning syndrome" in Chinese (Indoor Air Quality Management Group (IAQMG, 2003). The indoor temperature affects several human responses, including thermal comfort, perceived air quality, SBS and work performance [15]. The indoor temperature has also been shown to affect people’s productivity [16].Most of us spend major portion of our time indoors in homes, schools, the workplace, shopping malls or hospitals. The average person will use typically 15kg of air a day through breathing compared with 1 kg of food and 2 kg of water [17]. An interesting study was carried out by researchers from Greece about the indoor air conditions in 20 hospital operating rooms in major hospitals in Greece and listed out the commonly encountered problems such as insufficient indoor air change, bad space ergonomics, poor maintenance etc. [18]. A study shows a direct relationship between certain concentrations of air pollutants with internal health problems, such as: allergies, asthma, bronchitis, pneumonia, lung cancer etc. [19].Few studies have examined the quality of indoor air in hospitals, especially in NICUs, Prazad et al., (2008) studied the air borne concentrations of volatile organic compounds in neonatal incubators, and concluded that the emission pattern of 2-heptanone and n-butyl acetate, found at elevated concentrations inside the incubators compared with ambient room air samples and background measurements, indicate that they originate inside the incubator. There is evidence that exposure to some VOCs may adversely impact the fetal and developing infants' health [20]. Currently, as there is no definitive information available on the effects of acute or chronic low-level exposure to these compounds in neonates, future studies evaluating the health effects of neonatal exposure to these VOCs are needed.The objectives of this research were to assess the IAQ (CO, CO2, and PM10, PM2.5) in NICUs, to identify the thermal comfort (temperature and RH%) in NICUs, to investigate the effects of IAQ on the employees' health, and to provide the decision makers with a healthful suggestions and recommendations about the IAQ.
2. Materials and Methods
2.1. Study Design
- Cross sectional analytical design was used in this study. Cross analytical design is conducted at the same time or over a short period of time. Measuring parameters and the distribution of the questionnaire was in parallel.
2.2. Study Population and Sample
- In the Gaza strip there are five NICUs distributed over the following hospitals: (Al Shifa Hospital, Al Nasser Pediatric Hospital, European Hospital, Naser Hospital and finally Al Aqsa Hospital). In this study three units were selected geographically to represent the Gaza strip which is Al Shifa Hospital, European Hospital and Al Aqsa Hospital. Study population in this research consists of all doctors and nurses in NICUs in three governmental hospitals at Gaza strip, (Al Shifa Hospital, European Hospital, and Al Aqsa Hospital).
2.3. Period of the Study
- Samples were collected on March 4th, 2013, till March 22ed, 2013, as samples were collected for five days per unit (Monday, Tuesday, Wednesday, Thursday, and Friday) distributed on three shifts as follows: day shift from 7:30 am to 13:30 pm, evening shift from 13:30 pm to 19:30 pm, and night shift from 19:30 pm to 7:30 am.
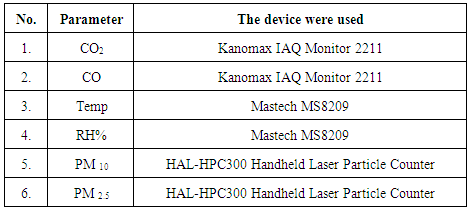
2.4. Experimental Devices and Tools
- Devices were put in the middle of the hall, one meter away from the nursing station and one meter high from the ground. Devices were used randomly in every half an hour and take measurement every five minutes, in the day shift 18 records were taken, in the evening shift 12 records were taken and in the night shift 20 records were taken. The means were calculated for all records in every shift for all units. Table (1) Shows the parameters that were measured and the devices, which were used.
|
2.5. Questionnaire
- About 120 self-administered questionnaires were distributed in the NICUs. One hundred and eight questionnaires were received, with response rate of 108/120 (90%). The questionnaire was sent to a specialist in environment health and to a specialist in English language. A questionnaire was provided with a covering letter explaining the purpose of the study, the way of responding, the aim of the research and the security of the information in order to encourage a high response. To ensure the validity of questionnaire, it was submitted to panel of experts to evaluate its faced contents validity. To ensure reliability of the questionnaire Crombach Alpha and correlation coefficient were done. Small scale reliability test (pilot study) was done to have an idea about length and ambiguity of the questionnaire.
3. Results and Discussion
3.1. The Result and Discussion of Parameters
3.1.1. The Mean Results of Temperature
- Figure (1) shows mean results of Temp in AL Aqsa hospital in the morning, evening and night shifts were 25.8°C, 25.9°C, and 26.9°C, respectively. And the mean results of Temp in European hospital in the morning, evening and night shifts were 24.6°C, 24.4°C, and 26.2°C, respectively. While the mean results of Temp in AL Shifa hospital in the morning, evening and night shifts were 26.5°C, 26.3°C, and 26.7°C, respectively. The recommended range for acceptable IAQ is 23.0°C to 26.0°C for Temp from ASHRAE, (2007). Figure (1) shows that the majority of the results in all the hospitals were on the upper limit of the recommended value, some readings were slightly higher than the recommended value such as AL Shifa hospital because it contains the largest NICU regarding the number of incubators and employees. This is because the NICUs contain many of the devices, which produce heat such as incubators to warm newborns. These reading are compatible with the study of Pickett and Bell, (2011) which investigated the air quality of infants’ homes in the New England area of the U.S. [21].These results were also consistent with the study of Ismail et al., (2010b) which studied IAQ in non-industrial work place [22].In contrast, the results were the opposite in the study of Skoog, (2006) who studied IAQ in a hospital ward in Sweden, where the readings were very close to the lower limit of the recommended value [23]. Perhaps because of this study were in the open sections of the hospital such as the orthopedic department.
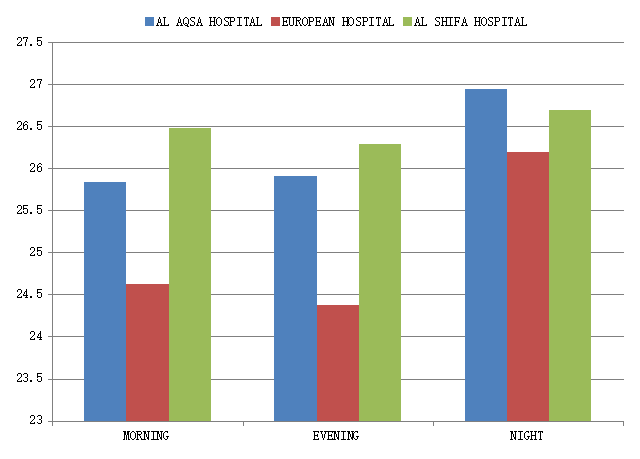 | Figure (1). Mean results of temperature in all hospitals |
3.1.2. The Mean Results of RH%
- Figure (2) shows mean results of RH% in AL Aqsa hospital in the morning, evening and night shifts were 45.9%, 44.3%, and 42.1%, respectively. And the mean results of RH % in European hospital in the morning, evening and night shifts were 44.8%, 41.2%, and 51.0%, respectively. While the mean results of RH% in AL Shifa hospital in the morning, evening and night shifts were 44.9%, 39.7%, and 41.7%, respectively. The recommended range for acceptable indoor air quality is 30% to 65% for RH% from (ASHRAE, 2007). Figure (2) shows that all the results in all the hospitals were in the normal range of the recommended value. This is because the humidity in the outdoor influence is somewhat on the indoor.These results were consistent with the study of Pegas, et al., (2011), which addressed the IAQ in schools in Lisbon, in the spring [24]. These results were also consistent with the study of Capitelli et al., (2009), who studied the physical measurement in historical Archive in Milan [25].But the results were different in the study of Pickett and Bell, (2011), which investigated the air quality of infants’ homes in the New England area of the U.S., where it was slightly higher than the recommended value in most of the readings [21].
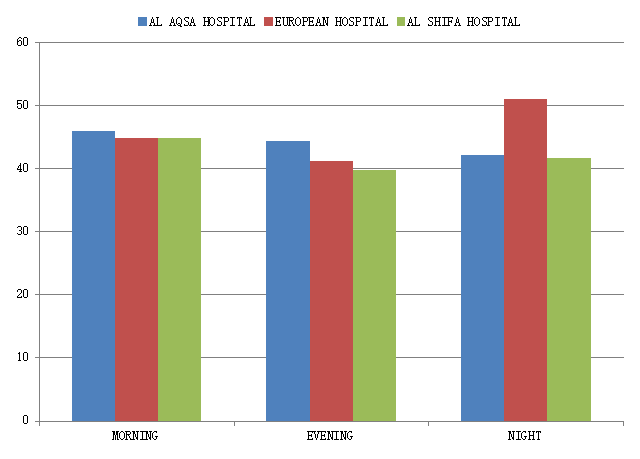 | Figure (2). Mean results of RH% in all hospitals |
3.1.3. The Mean Results of CO2
- The recommended values of exposure for CO2 should not exceed 1000 ppm for an 8 hour period as indicated by Malaysian Code of Practice (department of occupational safety and health (DOSH), 2005) and ASHRAE standards [26]. Figure (3) shows mean results of CO2 in AL Aqsa hospital in the morning, evening and night shifts were 878 ppm, 876 ppm, and 689 ppm, respectively. And the mean results of CO2 in European hospital in the morning, evening and night shifts were 742 ppm, 606 ppm, and 536 ppm, respectively. While the mean results of CO2 in AL Shifa hospital in the morning, evening and night shifts were 1143 ppm, 850 ppm, and 806 ppm, respectively. It’s noted that most of the readings were consistent with the recommended value other than Shifa Hospital readings were very close to the upper limit of the recommended value and sometimes slightly exceed the upper limit, especially in the morning because it is the most crowded shift.Seppanen et al., (1999) reviewed available literature for the association between both ventilation rates and CO2 concentrations and health. The authors were not able to determine a clear threshold value for CO2 below which further reductions in concentration were not associated with further decreases in SBS symptoms. However, 7 out of the 16 studies reviewed suggested that the risk of SBS symptoms continued to decrease with decreasing CO2 concentrations below 800 ppm [27].This study is largely compatible with the study that dealt with some of IAQ of schools in Malaysia. [28].These results were also consistent with the study of Khan and Budaiwi, (2002) which was conducted in some commercial buildings in Saudi Arabia [29].Clear association was seen between elevated indoor CO2 levels and increases in certain SBS symptoms. The reduction of CO2 could come through large increases in ventilation rates, improved effectiveness in providing fresh air to the occupants’ breathing zone [27], or through identification of the symptom-causing agents in the indoor air and control of their sources. The ventilation that is inadequate and insufficient fresh air intake can contribute to high level of CO2 in certain area in the building [30].
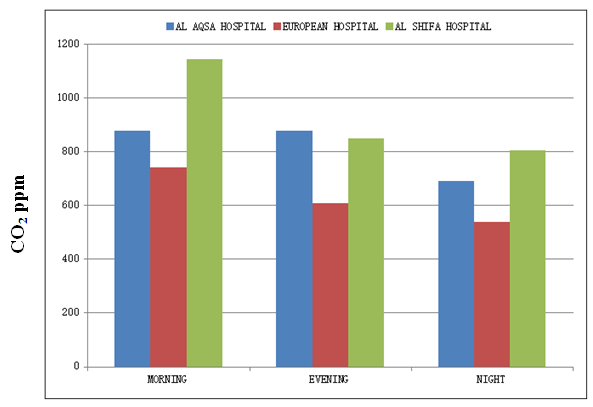 | Figure (3). Mean results of CO2 in all hospitals |
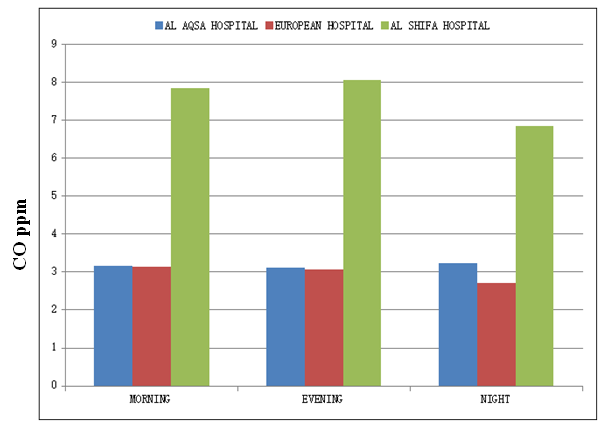
3.1.4. The Mean Results of CO
- The Malaysian Code of Practice (DOSH, 2005) recommended value of 10 ppm for an 8-hour period exposure [26]. Figure (4) shows that mean results of CO in AL Aqsa hospital in the morning, evening and night shifts were 3.2 ppm, 3.1 ppm, and 3.2 ppm, respectively. And the mean results of CO in European hospital in the morning, evening and night shifts were 3.1 ppm, 3.1 ppm, and 2.7 ppm, respectively. While the mean results of CO in AL Shifa hospital in the morning, evening and night shifts were 7.9 ppm, 8.1 ppm, and 6.8 ppm, respectively. These results are within normal range of recommended value, Perhaps this is due to no origin of CO in NICU.CO is produced as a by-product of incomplete combustion of organic materials. In the human body, CO is produced endogenously by the class of enzymes known collectively as heme oxygenase [31]. CO is detectable in small quantities in the exhaled air of healthy people [32].This study was compatible with the study that measured CO in pollution in homes with infants [21].These results were also consistent with the study of Ismail et al., (2010a), that dealt with some of the IAQ of schools in Malaysia [28].
 | Figure (4). Mean results of CO in all hospitals |
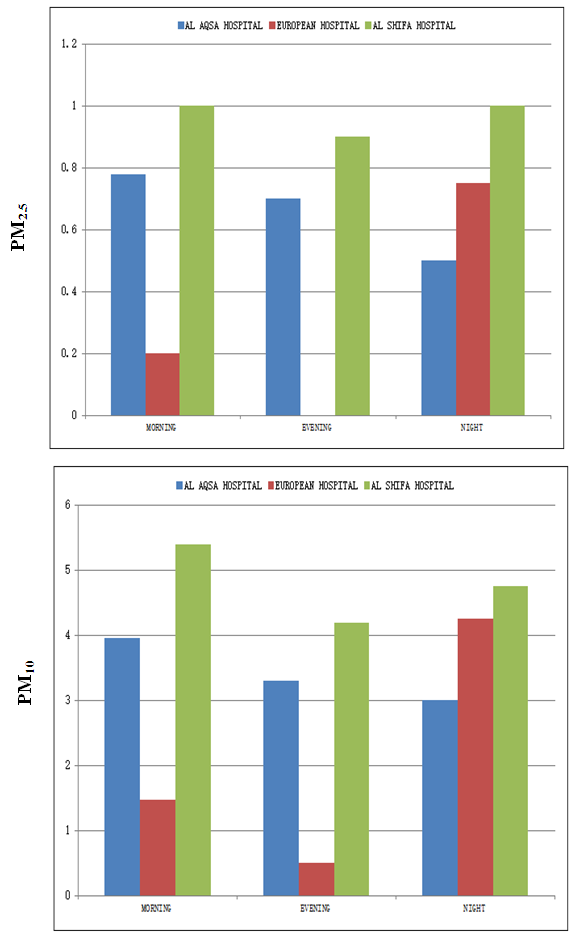
3.1.5. The Mean Results of PM
- The recommended threshold level for an 24-hour period exposure for PM10 and PM2.5 are 50 μg / m3, and 25 μg / m3, respectively. (National Ambient Air Quality Standards (NAAQS) and USEPA, 2012). Figure (5) shows mean results of PM10 and PM2.5 in AL Aqsa hospital in the morning, evening and night shifts were 4 μg / m3, 3.5 μg / m3, 3 μg / m3, and 1 μg / m3, 1 μg / m3, 0.5 μg / m3, respectively. And the mean results of PM10 and PM2.5 in European hospital in the morning, evening and night shifts were 1.5 μg/m3, 0.5 μg/m3, 4.5 μg/m3, and 0.2 μg/m3, 0.0 μg/m3, 1 μg/m3, respectively. While the mean results of PM10 and PM2.5 in AL Shifa hospital in the morning, evening and night shifts were 5.5 μg/m3, 4.2 μg/m3, 5 μg/m3, and 1 μg/m3, 1 μg/m3, 1 μg/m3 , respectively. All results of PM were below the standard value. We note that although the results of AL Shifa hospital below the recommended value, but it is a little more than other hospitals, possibly because AL Shifa hospital contains the largest NICU regarding the number of incubators and employees. The combined effects of high occupancy and insufficient ventilation seem to be the main reason for the high PM10 concentrations.PM is an indicator which directly contributes to the IAQ problem at workplace. Code of Practice on IAQ published by Department of Occupational Safety and Health Malaysia has set the maximum standard for the particulate at 0.15 mg/m³ for 8-hours. All results detected were less than the Code of Practice limit less than 0.15 mg/m³. This can be related to the practice within work place itself [28].
 | Figure (5). Mean results of PM in all hospitals |
3.2. Result and Discussion of Questionnaire
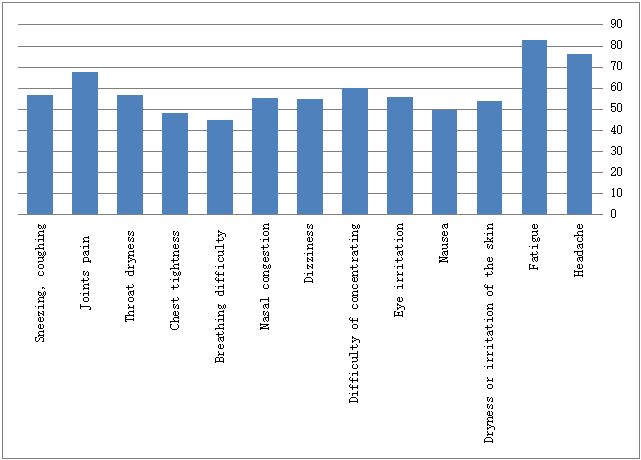
3.2.1. Current Symptoms
- In figure (6) the study showed that fatigue and headache were the most common symptoms among the staff, This agree with the study of Khan and Budaiwi, (2002) conducted in some commercial buildings in Saudi Arabia [29], and the study of Norback and Nordstrom, (2008) who studied the relationship between SBS and IAQ in university computer classrooms in Sweden, and concluded that the main symptoms were fatigue and headache [33]. The study was also agreed with AL Momani and Ali, (2008) study conducted in Jordan on some residential buildings in the cities of Irbid, Amman, and Zarqa, where headache was ranked the first [34].While the noise was the most common symptoms according to the study of Wong, et al., (2009) which was conducted in residential buildings in Hong Kong [35].
 | Figure (6). Proportional mean (%) for "Current symptoms" for All Hospitals |
3.2.2. Questions Related to Developed Symptoms
- Table (2) shows the following results:
|
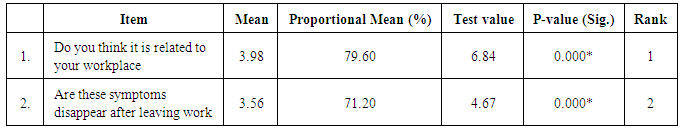
 . The sign of the test is positive, so the mean of this paragraph is significant. We conclude that the respondents agreed to this paragraph.The mean of paragraph #2 " Are these symptoms disappear after leaving work " equals 3. 56 (71.20%), Test-value = 4.67, and P-value = 0.000 which is smaller than the level of significance
  . The sign of the test is positive, so the mean of this paragraph is significant. We conclude that the respondents agreed to this paragraph.
 4. Conclusions and Recommendations
- This is the first study done to assess the indoor air quality at the NICUs in government hospitals in Gaza strip. The following conclusions and recommendations were drawn from the results of the research. The study results revealed that the mean of CO2 in AL Shifa hospital was higher than of other hospitals, especially in the morning shift where it was 1143 ppm which was more than the recommended value (1000 ppm). Meanwhile, the mean of Temp in AL Shifa hospital recorded the higher readings where it was very close to the recommended value, and sometimes a little higher than it. On the other hand, the average concentration rate of CO complied with recommended value, 10 ppm for an 8hr period exposure. While the mean result of RH% in all hospitals were very compatible with standards, (30%- 65%). This applies to all NICUs. Also, all results of particulate matter meet the standards in all NICUs. The study showed that about 60% of all respondents suffer from SBS as fatigue and headaches occupied the first and second rank: 83% and 76%, respectively. And in their answers to questions about the symptoms, 78% of them believe that these symptoms are related to the work place, and these symptoms for 71% of them disappear after leaving work. Future studies evaluating the health effects of IAQ in NICUs are needed. And similar studies may be performed to check contamination with other indoor air pollutants such as volatile organic compound.