-
Paper Information
- Previous Paper
- Paper Submission
-
Journal Information
- About This Journal
- Editorial Board
- Current Issue
- Archive
- Author Guidelines
- Contact Us
Public Health Research
p-ISSN: 2167-7263 e-ISSN: 2167-7247
2016; 6(1): 18-23
doi:10.5923/j.phr.20160601.02

Assessment of Carbon Dioxide Emissions from Traffic and Its Health Impact in Gaza, Palestine
 Abstract
 Reference
 Full-Text PDF
 Full-text HTML
W. A. Al Madhoun 1, 2, R. M. Mokat 2, Z. H. Abu Hein 2, M. Isahak 3
1MIT - UTM Malaysia Sustainable Cities Program, UTM, Johor Bharu, Malaysia
2Environment and Earth Science Department, The Islamic University of Gaza, Palestine
3Department of Social and Preventive Medicine, Faculty of Medicine University of Malaya, Malaysia
Correspondence to: W. A. Al Madhoun , MIT - UTM Malaysia Sustainable Cities Program, UTM, Johor Bharu, Malaysia.
| Email: |  |
Copyright © 2016 Scientific & Academic Publishing. All Rights Reserved.
This work is licensed under the Creative Commons Attribution International License (CC BY).
http://creativecommons.org/licenses/by/4.0/

Traffic emission is a major source of air pollution in most urban areas and it effects on public health. The aim of this study was to determine the levels of Carbon Dioxide (CO2) emissions from the motor vehicles and to investigate the correlations between CO2 trends and the associated health impacts. Levels of CO2, humidity and temperature were monitored at the selected intersections during morning peak (7:00-8:30 am), off peak traffic hours (10:30 am – 1:30 pm) and afternoon peak (3:00 – 4:30 pm) by using Kanomax meter and multi-meter. A questionnaire was distributed randomly to pedestrians and drivers at Gaza city to evaluate traffic emissions and their health impacts. The research results revealed that the CO2 levels at the study locations fluctuating between 291-608 ppm, moreover it was noticed that the CO2 concentrations in the majority of the monitored sites were higher than the agreeable international level of CO2 which is 350 ppm. The public health questionnaire results showed that 63% of study population complain from cough and nasal congestion during walking at the streets and 91.8% of sample thought that traffic emission was the main source of air pollution in Gaza city. The findings of this research emphasize importance of taking action to reduce traffic emissions levels in Gaza City, in order to decrease health impacts that the public is exposed to.
Keywords: CO2, Gaza, Health Impacts, Traffic Emission
Cite this paper: W. A. Al Madhoun , R. M. Mokat , Z. H. Abu Hein , M. Isahak , Assessment of Carbon Dioxide Emissions from Traffic and Its Health Impact in Gaza, Palestine, Public Health Research, Vol. 6 No. 1, 2016, pp. 18-23. doi: 10.5923/j.phr.20160601.02.
Article Outline
1. Introduction
- Recent investigations indicate that CO2 concentrations in the atmosphere have risen from pre-industrial levels of 280 ppm to present levels of ~380 p.m. Moreover, this increase in atmospheric CO2 was attributed to the world’s expanding use of fossil fuels and is believed to be the main cause of global warming which affects negatively many physical, biological, and human systems [1, 2]. Further research showed that the 270 Giga tons of anthropogenic carbon emissions over the past 200 years would have increased CO2 concentrations from 280 to 380 ppm [3, 4]. Worth mentioning that the international agreeable guideline of the ambient CO2 is 350 ppm [5].Reports indicated that the on-road vehicle emissions constitute the major source of atmospheric CO2 in urban areas. CO2 emissions from road traffic worldwide will increase by 92% between 1990 and 2020 [3, 6], where direct energy consumption and CO2 emissions are increasing faster for urban than for rural households [7]. It was concluded that high volume of traffic, transport consumption of fossil fuels and shortage of adequate public transport system was responsible for the high CO2 level in the environment [3, 8].Outdoor air pollution contributed to various adverse health effects. Whereas some effects may be related to short-term exposure, others had to be related to long-term exposure [9]. Urban atmospheric pollution has a well-known impact on acute and chronic respiratory disease and adverse health effects on cardiovascular system [10]. Currently road traffic was the most used mode of transport, where a high amount of money is spent to improve air quality deterioration results from pollution and environmental effects of transport sector emissions [11]. CO, CO2, NO and NO2, VOCs, O3 and aerosol particles are the most important urban air pollutants in terms of emissions and impact on the environment and human health as well [12, 13].Globally, people facing increasing risks of respiratory diseases due to smoke and dust in both occupational and industrial sectors [14].In Gaza strip there are 72232 of registered motor vehicle and there was a rapid growth number of motor vehicle in the last years, especially following the operation of tunnels linking the Gaza Strip and Egypt borderline [15]. From February to November (2013), the fuel consumption in Gaza strip used for the transport sector, both Gasoline and diesel reached 15,248,000 and 9,773,000 liters respectively [15].The aims of this study were to determine levels of Carbon Dioxide (CO2) emissions from motor vehicles, to investigate the correlations between CO2 trends and health effects, and to provide suggestions and recommendations for decision makers regarding reducing the CO2 emissions at Gaza city streets.
2. Methodology
- To achieve this purpose, the study monitored traffic CO2 emissions at Gaza main streets and investigated associated health impacts; descriptive analytical method were used.
2.1. Site Selection
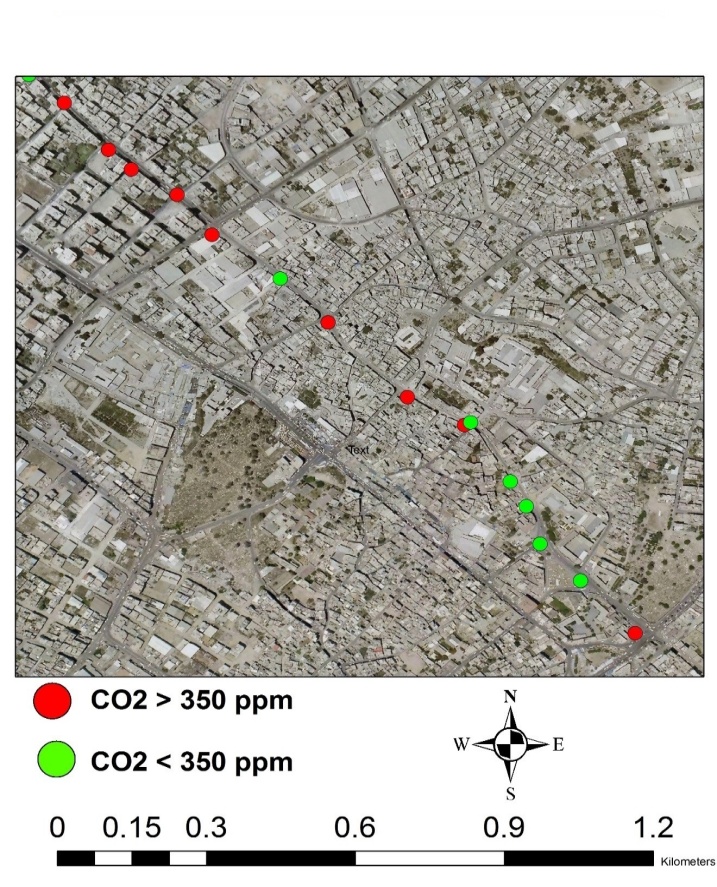
- This research focused on Gaza city as a case study because it is considered as the largest and busiest city in Gaza strip. Four main streets and some minor streets (in between the main streets) are selected (as shown in Figure 1) as the most crowded streets in Gaza city, which are as follows, Jamal Abdel Nasser Street-Al Thalatheni (Location 1), Omar EL-Mokhtar Street(Location 2), El-Wehda Street (Location 3), El-Gala’a Street (Location 4) and Several minor Streets (Location 5).
 | Figure 1. Study Area |
2.2. Monitoring
- Levels of CO2 were monitored at each intersection of the selected main streets during various times of the day (10:30 a.m. -1:30 p.m) and (3:30 p.m-6:00 p.m). Monitoring times chosen to capture the range of daily exposure of the streets users. Concentrations were averaged over the 15 minutes measurement period at each intersection. Temperature and Humidity conditions were recorded at the start and end of the monitoring session at each intersection, and readings were averaged. The monitoring was done during the period (1/12/2012 to 10/2/2013).
2.3. Instruments
- The Kanomax handheld IAQ monitor, model 2211 was used to measure CO2 continuously. The device uses a Non-Distributed Infrared sensor (NDIR) with a range of 0 to 5000 ppm, a resolution of 1 ppm, and a response time of 45 seconds (90% responsive, with calibration cover). Its operating temperature range is between -20°C and 40°C, and its humidity is between 5 and 95%. The sensor had an accuracy of ±3% of display value or ± 50 ppm; whichever is larger at calibration temperature [16]. Temperature (°C) and humidity were measured using the multi-meter and Global Position System (GPS) was used to identify the coordinates of the sampling sites.
2.4. Mapping
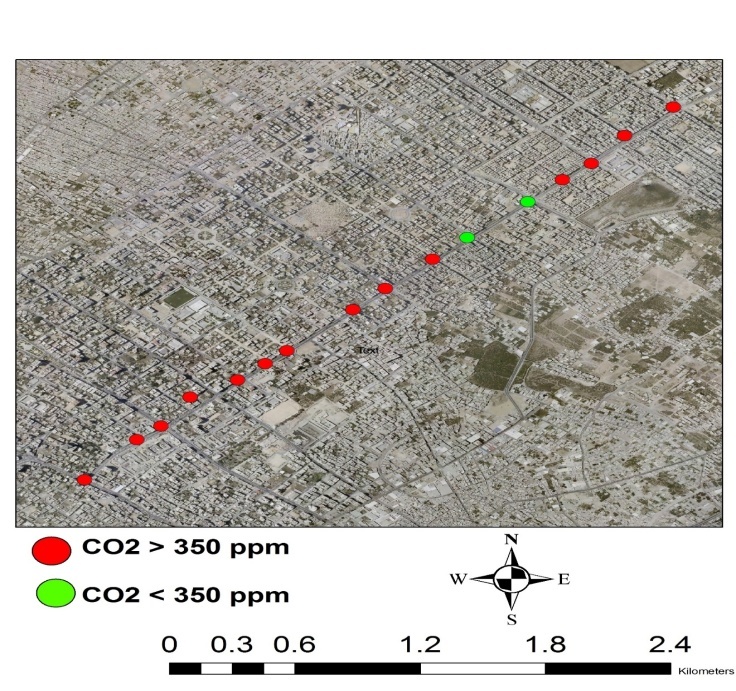
- Geographic information system (GIS) tool (ArcGIS and ArcView) were used to map the concentration of CO2 at each sampling station [17].
2.5. Health Data Collection
- Data were collected by using health effects questionnaire that was distributed randomly at Gaza city streets, explanation done to the participants before they filled in the questionnaire.
3. Results and Discussion
3.1. CO2 Levels
- The mean concentration of CO2 ranged from 341 to 518 ppm, and the lowest value recorded was 291 ppm at Jamal Abdel Nasser Street (JAS), while the highest level was 608 ppm at the inner streets. Table (1) summarized the CO2 concentration in all sampling stations during the monitoring period.
|

 | Figure 1. CO2 at Jamal Abdel Nasser Street (JANS) |
 | Figure 2. CO2 at Omar EL-Mokhtar Street (OEMS) |
 | Figure 3. CO2 at El-Wehda Street (EWS) |
 | Figure 4. CO2 at El-Gala’a Street (EGS) |
 | Figure 5. CO2 at the Inner Streets (IS) |
3.2. Public Health Assessment
- The study population included pedestrians and drivers selected randomly, the sample size was 200, and the questionnaires were distributed and collected in early May 2013.
3.2.1. Response Rate
- From the 138 questionnaire subjects, 118 subjects had responded, with a response rate of 68%.
3.2.2. Prevalence of Health Outcomes
- Pedestrian and drivers were asked on the symptoms they feel while walking or driving at Gaza city streets, as shown in figure 6; it can be noticed that 74% of the study population complained of nasal discharge, 71% felt eyes itchiness, 67% had a dry throat and 5% suffered breathing difficulties. This research results come in line with the results of a study conducted by [19] who found associations of asthma-related hospital morbidity with ambient CO, NO2, NOx, and PM2.5, particularly during the colder seasons. Moreover the results of a study by [20] show significant associations between air pollutants and respiratory hospital admissions, and stronger effects were observed for females and aged ≥65 yrs.
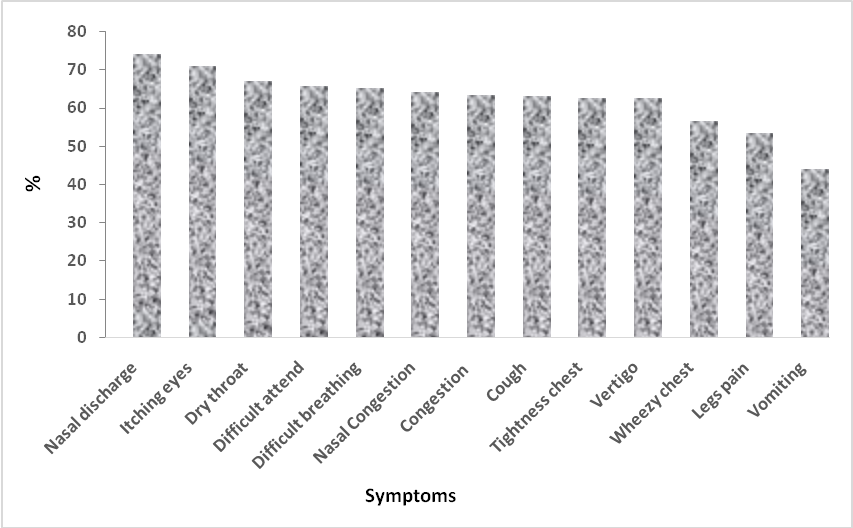 | Figure 6. Health Symptoms due to Traffic Emissions |
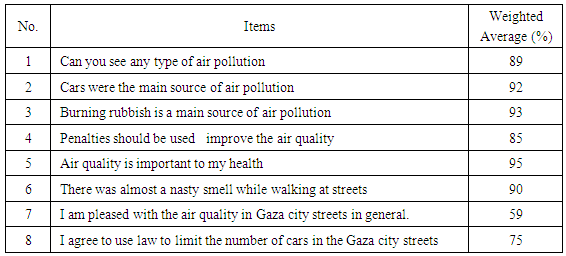
3.2.3. Outdoor Air Quality
- In this section, they survey examined the views of the road users on the outdoor air quality, as shown in table 2; 89% of the interviewed people said that they could see air pollution physically; 92% of the subjects thought that traffic emissions is the main source of air pollution; 95% believed that good air quality is important for health; and 75% of them agreed to enforce the laws to limit the number of cars running on the streets especially old vehicles.
|
4. Conclusions
- This study examined the trends of CO2 emitted from traffic vehicles (as an indicator of traffic emissions) and investigated the associated health impacts at Gaza city. The results showed the CO2 levels exceeded the international agreeable limit which is 350 ppm in the majority of the monitoring sites where the CO2 concentrations ranges from 291 to 608 ppm. The high level of CO2 attributed to the high volume of traffic at Gaza, adding to the narrow streets width and the street canyon effect due to the layout of the residential building at both streets sides. The overall air quality of the area was found to be poor and there were general and respiratory health effects reportedly experienced by the people in the area. The public health survey results showed that 63% complain from cough and nasal congestion while walking at the Gaza city streets and 92% of the sample thought that traffic emission was the main source of air pollution in the city.These negative health effects urges the decision makers to adopt traffic emission control strategies. Reducing the contribution of CO2 emission from traffic would be the most beneficial mitigation measure; this reduction can be achieved by eliminating the old vehicles from running on the streets and a periodic maintenance to be done for vehicles which are in good conditions. It is necessary to improve the public transport infrastructure to encourage the people to use such transport means, which will help in reducing transportation CO2. One more effective measure is to plant more trees at the roadside, where the trees absorb CO2 during the photosynthesis process [24].
ACKNOWLEDGEMENTS
- The authors would like to thank Universiti Teknologi Malaysia for the financial support given under the MIT-UTM Malaysia Sustainable Cities Program