-
Paper Information
- Previous Paper
- Paper Submission
-
Journal Information
- About This Journal
- Editorial Board
- Current Issue
- Archive
- Author Guidelines
- Contact Us
Public Health Research
p-ISSN: 2167-7263 e-ISSN: 2167-7247
2014; 4(5): 160-165
doi:10.5923/j.phr.20140405.02
Stillbirth Rates in the Tamale Metropolis of Ghana
 Abstract
 Reference
 Full-Text PDF
 Full-text HTML
Lea Anzagra
Department of Statistics, University for Development Studies, P. O. Box, 24 Navrongo, Ghana
Correspondence to: Lea Anzagra, Department of Statistics, University for Development Studies, P. O. Box, 24 Navrongo, Ghana.
| Email: |  |
Copyright © 2014 Scientific & Academic Publishing. All Rights Reserved.
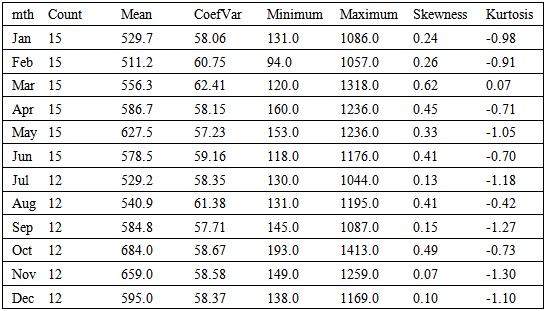
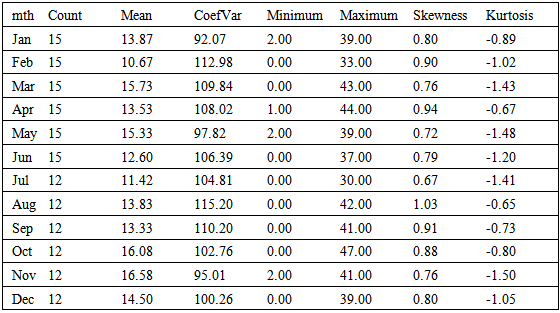
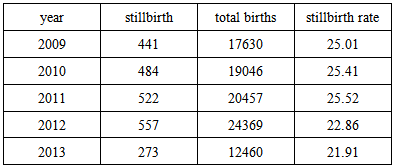
The study estimated the stillbirth rates in the Tamale metropolis of Ghana over a five year period (from January, 2009 to June, 2013). It then investigated as to whether or not these rates significantly varied according to types and hospitals respectively. The study revealed that the average monthly number of births and stillbirths in the metropolis over the period were 580 and 13.92 respectively whilst the average number of macerated stillbirth and fresh stillbirth were 8.735 and 5.185 respectively. On the average, the highest number of births and still births were recorded in October and November respectively. Also there were no significant differences in the number of macerated and fresh stillbirths recorded over the period. The stillbirth rate for the metropolis from 2009 to 2011 ranged between 25.01per 1000 births and 25.52per 1000 births with a decline in these rates for 2012 (22.86 per 1000 births) and 2013 (21.91 per 1000 births). There were however significant differences in the total number of stillbirths recorded at the various hospitals in the metropolis over the period with Tamale central and Tamale teaching hospitals recording the lowest and highest the stillbirth rates respectively.
Keywords: Stillbirth, Macerated, Fresh, Mann-Whitney, Kruskal-Wallis
Cite this paper: Lea Anzagra, Stillbirth Rates in the Tamale Metropolis of Ghana, Public Health Research, Vol. 4 No. 5, 2014, pp. 160-165. doi: 10.5923/j.phr.20140405.02.
Article Outline
1. Introduction
- The need for accelerating progress towards the Millennium Development Goals (MDGs) 4 and 5 according to a policy brief released by the World Health Organization (WHO) in 2011, had increasingly been of concern to the international community as recognized within the Global Strategy for Women’s and Children’s Health launched by the United Nations Secretary-General in September 2010 [1-4]. To meet these MDGs, improved information is required at the global and programme levels to prioritize use of resources to achieve the maximum effect. Although stillbirth not included in tracking the MDGs, it is related to maternal mortality and with the care received during pregnancy and delivery [5]. The estimated trend in stillbirth rate reduction is slower than that for maternal mortality and lags behind the increasing progress in reducing deaths in children younger than 5 years [6]. Improved data on pregnancy outcomes including stillbirths are crucial to guiding programmes and investment towards progress in achieving the MDGs.Stillbirth (also known as late fetal death) refers to death prior to the complete expulsion or extraction from their mother of a product of conception, after 28 weeks’ of pregnancy (gestation) [7]. The death is indicated by the fact that after such separation, the fetus does not breathe or show any other evidence of life, such as beating of the heart, pulsation of the umbilical cord, or definite movement of voluntary muscles. Stillbirth is a valuable health status indicator. A high stillbirth rate implicates maternal health and physique as a primary factor in mortality (and fertility). There are two types of stillbirths; intrapartum or fresh stillbirth and macerated stillbirth. A fresh stillbirth is a baby born dead without signs of skin disintegration or maceration and the death is assumed to have occurred less than 12 hours prior to delivery [6].A number of studies on stillbirth have been carried out all over the world. Cousens et al. (2011) on their study of National, regional, and worldwide estimates of stillbirth rates in 2009 and a World Health Organization (WHO) policy brief on National, regional, and worldwide estimates of stillbirth rates in 2009 with trends since 1995 showed that the estimated number of global stillbirths was 2.64 million in 2009 and 3.03 million in 1995. These studies further revealed that worldwide stillbirth rate has declined by 14.5%, from 22.1 stillbirths per 1000 births in 1995 to 18.9 stillbirths per 1000 births in 2009. In 2009, 76.2% of stillbirths occurred in south Asia and sub-Saharan Africa. The study concluded that, most stillbirths were avoidable, as evidenced by the low stillbirth rate for developed countries of 3 per 1000 births in contrast to the stillbirth rate of 28 per 1000 births in sub-Saharan Africa [1, 8, 9].Fitzpatrick and Cooper (2011) in their study of Patterns and trends in stillbirths and infant mortality in the United Kingdom discovered that stillbirth rate for the United Kingdom from 1991 to 1997 was 5.6 per 1,000 live births [10]. The stillbirth rate, the research further revealed varied across the different countries with Scotland recording the highest stillbirth rate of 6.2 per 1,000 births and Wales recording the lowest stillbirth rate of 5.4 per 1,000 births. According to the Office for National Statistics (ONS) in England and Wales, there were 3,558 stillbirths in 2012 - a stillbirth rate of 4.9 per 1,000 live births. This had dropped from 5.3 in 2011 [11].In Africa, Nigeria, Democratic Republic of Congo, Ethiopia and Tanzania are in the top League of Nations with high rates of stillbirths (with 42 stillbirths per 1000births for Nigeria and 26 stillbirths per 1000births for the rest) according to the first comprehensive set of stillbirth estimates, published recently in the medical journal The Lancet [12]. Ghana however had a stillbirth rate of 22 per 1000 births according to the report. This was further confirmed by Chalumeaua et al (2002), who obtained the stillbirth rate in West Africa to be 26 per 1000 births [13].In Ghana, the still birth rates seem to vary for the different region, districts and municipalities. For instance, the municipal profile of Techiman Municipality on the outcomes of delivering in the municipality from 2003-2005 indicated that; Still birth rate for 2005 was high (3.5%) as compared to that (2.4%) in 2004 [14]. Engmann et al in their study of Stillbirths and early neonatal mortality in rural Northern Ghana over a 7 year period revealed that the stillbirth rate rates in the Upper East region to be 23 stillbirths per1000 deliveries [15].This study sought to estimate the stillbirth rates in the Tamale metropolis of Ghana and to investigate whether or not these rates significantly varied according to types and hospitals.
2. Materials and Methods
- Secondary data on still birth for the Tamale metropolis was obtained from the Ghana health service district health information management (DHIMS) form January, 2009 to June, 2013. The Tamale Metropolis is one of the 26 districts in the Northern Region and is among the six Metropolitan Assemblies in Ghana. It is located in the central part of the Northern Region and its capital is Tamale. The metropolis has 47 health facilities comprising of; 11 chip zones and health centers, 10 clinics and maternity homes and 5 hospitals of which 2 are private. The government hospitals in the metro includes; Tamale Central Hospital, Tamale Teaching Hospital and Tamale West Hospital.
2.1. Stillbirth Rate
- Stillbirth rate is a valuable health status indicator and a high stillbirth rate implicates maternal health and physique as a primary factor in mortality (and fertility). It is defined as;
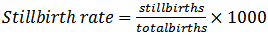 | (1) |
 [10].
[10].2.2. Mann Whitney-Wilcoxon Rank Sum Test
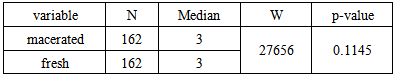
- To test whether the distribution of the number of stillbirths varied by type (macerated and the fresh stillbirths), the rank sum test was used to test the hypothesis that macerated and fresh stillbirths do not follow the same distribution or that there is a significant difference between the medians of the macerated and fresh still birth. Given
 are random variables from a population having arbitrary but continuous distribution function
  and
and  are independent and identically distributed random variables from a continuous distribution function
  For a large sample, the rank-sum statistic
  is asymptotically distributed as;
 | (2) |
 in comparism to the significance level is an indication of the insignificance of the test.
2.3. The Kruskal-Wallis Test
- Also, to find out if the number of still births varied according to the hospitals (Tamale Central Hospital, Tamale Teaching Hospital and Tamale West Hospital), the Kruskal-Wallis test was used to test the hypothesis that the different hospitals have the same distribution of the number of stillbirths. Let
 and
and  be
be  independent samples taken from
  populations having continuous distribution functions;
  We test the hypothesis;
  or
or all the hospitals have identical distributions for stillbirth rate over the period against
 all the hospitals have identical distributions for stillbirth rate over the period. The test statistic is based on the form in the ranks.
 Where
Where  is the rank of
  in the combined ranking of all
  observations and is given by;
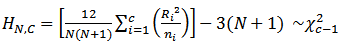 | (3) |
2.4. Regression with ARIMA Errors
- The regression with ARIMA errors is simply an ARIMA model with additional or input variables. The model is an integration of a regression model with an ARIMA model. The result of this model covers the advantages of both models. The regression method describes the explanatory relationship while the ARIMA method takes care of the autocorrelation in the residuals of the regression model. The model is given by;
 | (4) |
3. Results and Discussion
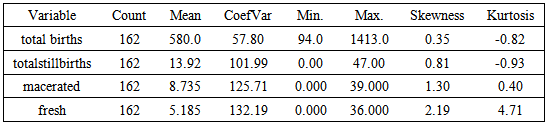
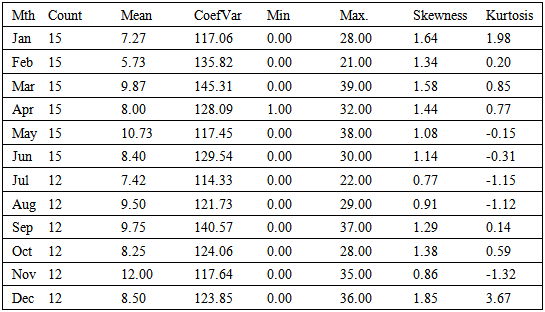
- The maximum and minimum number of total births in the metropolis within the period are 1413 and 94, whilst that of stillbirths are 47 and 0 respectively as shown in Table1. Also, total number of births and stillbirth in the metropolis was positively skewed and platokurtic in nature with their averages been 580 and 13.92 respectively. There was a great variation in the total number of stillbirth recorded over the period since it had the highest coefficient of variability.
|
|
|
|
|

|
|
|
|
|
4. Conclusions
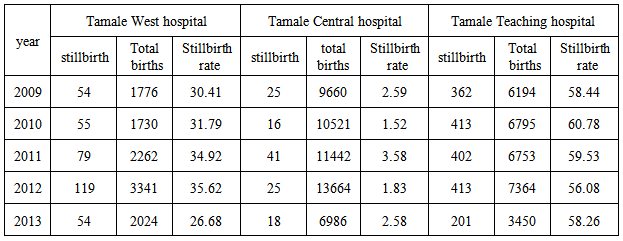
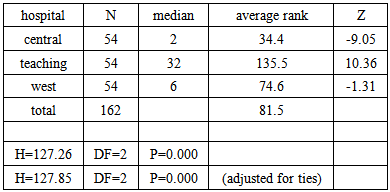
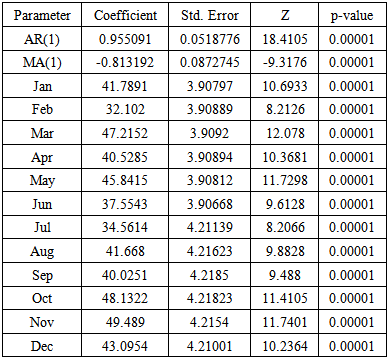
- The study sought to determine the stillbirth rate in the Tamale metropolis and to investigate whether or not these rates significantly varied according to types and hospitals using Secondary data on still birth for the Tamale metropolis obtained from the Ghana health service District Health Information Management (DHIMS) from January, 2009 to June, 2013. The average monthly total number of births and stillbirth in the metropolis over the period were 580 and 13.92 respectively whilst the average number macerated stillbirth and of fresh stillbirth were 8.735 and 5.185 respectively. On the average, the highest number of births and still births were recorded in October and November respectively. Investigation of the descriptive statistics of macerated and fresh stillbirths according to months recorded in the metropolis within the period revealed that the highest average numbers of macerated and fresh stillbirths were recorded in the months of November and October respectively. Also there were no significant differences in the number of macerated and fresh stillbirths recorded over the period.The stillbirth rate for the metropolis from 2009 to 2011 ranged between 25.01 per 1000 births and 25.52 per 1000 births. There was however a decline in these rates for 2012 (22.86 per 1000 births) and 2013 (21.91 per 1000 births) respectively. There were however significant differences in the total number of stillbirths recorded at the various hospitals in the metropolis over the period, Tamale west hospital recorded stillbirth rates ranging between 26.68 and 35.62 per 1000 births, Tamale central hospital recorded the lowest of the stillbirth rates ranging between 1.52 and 3.58 per 1000 births, whilst Tamale teaching hospital recorded the highest of the stillbirth rates with rates ranging between 56.08 and 60.78 per 1000 births. A regression model fitted with an ARMA (1, 1) residual revealed that a unit change in the periodic dummies increases the total number of stillbirths with time.Though stillbirth rates for the period in the metropolis were lower than that for sub-Saharan Africa, extensive education on stillbirth is still needed if the metropolis is to make progress in achieving the MDGs 4 and 5 or is to aspire a feat on stillbirth rate close to that of the developed countries.