-
Paper Information
- Next Paper
- Paper Submission
-
Journal Information
- About This Journal
- Editorial Board
- Current Issue
- Archive
- Author Guidelines
- Contact Us
Public Health Research
p-ISSN: 2167-7263 e-ISSN: 2167-7247
2014; 4(5): 145-159
doi:10.5923/j.phr.20140405.01
Assessing Geographical Inaccessibility to Health Care: Using GIS Network Based Methods
 Abstract
 Reference
 Full-Text PDF
 Full-text HTML
Sudha Yerramilli1, Duber Gomez Fonseca2
1Trent Lott Center for Geospatial Technology, CSET, Jackson State University, Jackson, MS, 39204, USA
2College of Science Engineering and Technology, Jackson State University, Jackson, MS, 39204, USA
Correspondence to: Sudha Yerramilli, Trent Lott Center for Geospatial Technology, CSET, Jackson State University, Jackson, MS, 39204, USA.
| Email: |  |
Copyright © 2014 Scientific & Academic Publishing. All Rights Reserved.
Disparities in the geographic accessibility to health care may be due to the location/distribution of the population and the characteristics of the transportation infrastructure relative to spatial arrangement of the health care delivery system within a region. Access to health care is a complicated concept and is largely dependent on the characteristics of the population in need of services. The most significant features affecting the health status and health outcomes involve distance between the population’s geographic regions and health care facilities and the travel time taken to reach the health care delivery system. Because of Mississippi's rural nature and uneven distribution of physicians, geographic disparities exist in access to primary care services leaving women, children, elderly and general populations in underserved health care regions. The purpose of the research is to identify hot spots of vulnerable population burdened due to geographical accessibility to right kind of health services. This research investigates these features by using network-based GIS methods in ten counties with urban-rural settings. The methodology assesses the geographic accessibility of three types of critical health care facilities: obstetrician/gynaecology (Women in child bearing age); paediatrics (children) and Trauma/Burn Centers (general population). To examine, using network analyst GIS functionalities, these facilities are geocoded, and optimal travel-time based service areas were generated and pertinent vulnerable population data layers were developed. The results identified hot spots of vulnerable populations residing outside the optimal service areas, with rural regions and pregnant women bearing most of the health burden due to geographic inaccessibility. This GIS methodology equip health administrators and policy makers in providing comprehensive view of the health systems from a territorial perspective while assisting them in making conscious policy decisions.
Keywords: Geographic Accessibility, Network Based Methods, Health Care, GIS
Cite this paper: Sudha Yerramilli, Duber Gomez Fonseca, Assessing Geographical Inaccessibility to Health Care: Using GIS Network Based Methods, Public Health Research, Vol. 4 No. 5, 2014, pp. 145-159. doi: 10.5923/j.phr.20140405.01.
Article Outline
1. Introduction
- Healthy people make health economy. Health care is the basic care provided to the populations at community level and targets better health outcomes and greater equity in health. Primary health care is the key in shaping healthy communities, improving and maintaining health of people. The health care quality is better described as a gulf for certain segments of the population, such as racial and ethnic minority groups, given the gap between actual care received and ideal or best care quality [1]. These health care disparities arise due to hitches in optimal health care functionalities such as availability, accessibility and affordability [2]. Disparities in geographic access to health care result from the configuration of facilities, population distribution, and the transportation infrastructure [3]. Geographic accessibility is considered as a critical determinant of human health around the globe (World Health Organization) than any of the vectors and significant factor contributing towards health disparities.Access to health care is a complicated concept and is largely dependent on the characteristics of the population in need of services. The most significant features affecting the health status and health outcomes involve distance between the population’s geographic regions and health care facilities and the travel time taken to reach the health care delivery system.
1.1. Geographic Accessibility: Location and Health
- Location and Health have been prominent features in determining accessibility rates among communities; and “location” was long considered more a determinant of health than pathogens [4]. One of the most significant factors that controls health status and largely contributes to health disparities is ‘the distance to health care facilities’. The issue of equality to health care access has become a research priority in many countries [5]. The United States Department of Agriculture (USDA) has expressed concern over growing health disparities between urban and rural communities in the dimension of infant mortality, age-standardized mortality and pregnancy related mortality rates [6]. The quality of health care in rural areas with predominantly low income and minority populations largely depend on geographical access and the distance to health care facility is highly sensitive in making health care choices. Geographical accessibility is defined as the ability of obtaining health care resources that meet the health demands of the population. It infers that a community has health care accessibility if the resources meet specific characteristics such as geographic location, affordability that fit with patient’s needs [7].Geographical accessibility centres on the concept of the presence of the right type of health care service with in the optimum travel time. The concept develops from the spatial arrangement of how people/communities, facilities and transportation network are connected or configured. Analyzing this spatial configuration serves as a measurement to expose the health disparities due to lack of the ‘right’ health care facilities that meets the needs of local people and difficulties with increased travel times, referred as ‘burden of travel’, to the facilities.
1.2. Critical Health Care Services: Optimal Distances
- Availability and accessibility to specialty health care facilities and trauma centers are the key component to US health care system because they have shown to decrease morbidity and mortality rates with their location being in optimal distances to patients needs. The issue of geographical inaccessibility to health care facilities often affects approximately 20% of nation’s population in Rural America, those who live in non-metropolitan counties. The health disparities are very large, especially in terms of geographical accessibility, with sparse distribution of general hospitals and few specialty health care systems [8]. Many studies by World health researchers have exposed health disparities related to limited/timely access to required health care facilities in these under served areas [9]. A large body of literature has documented the level of geographical accessibility to three critical health care services: Obstetrician / Gynecology, Pediatrics and Trauma Centers services as primary drivers of mortality and morbidity rates and consequent health disparities [10]. Pregnant women, Children and general populations may experience greater difficulties navigating the critical health care services within designated optimal times with poor geographical accessibility. Assessing the geographical accessibility to these three critical health care services within optimal times projects the status of health care system in the region in addition to revealing the needs of medical services required by the community.
1.3. Mississippi’s Health Care System Status
- The poor status of Mississippi’s health care system can be revealed from the fact that all of Mississippi’s 82 counties contain Designated Medically Underserved Areas as defined by the federal Health Resources and Services Administration (HRSA) [11]. Over a half of Mississippian’s (54.3%) live in designated primary health professional shortage area [12]. The foundation reports that the state’s burden of high mortality and morbidity rates are exacerbated due to limited geographical access to health care facilities and outpacing the national averages in the number of deaths. The high disparity scores, related to pregnancy, child birth and prenatal care among the women in Mississippi ranks the state 47th of 50 states in births to females 15-17 years of age, 49th in child death, and 50th in low birth weight, infant mortality [10]. While the infant mortality goal for US stands at 6.0, the rate for Mississippi stands at 9.6, attributing primary cause to issues in access to health care [13]. The University of Mississippi Medical Center (UMMC), located in the state capital is the only Level 1 Trauma facility, the only burn center and the only Level III neonatal intensive care nursery in the state. Because of Mississippi's rural nature and uneven distribution of physicians, geographic disparities exist in access to primary care services leaving women, children, elderly and general populations in underserved health care regions. To understand and present a clear setting of health disparities due to geographical accessibility, this study, using GIS based network analyst functionalities, identifies hot spots of vulnerable populations (in need of a specialty care) residing outside the service areas of three critical health care facilities (Obstetrician/Gynecology; Trauma Centers; Pediatrics) and equip health administrators and policy makers in providing comprehensive view of the health systems from a territorial perspective while assisting them in making conscious policy decisions.
1.4. GIS Network Based Methods for Measuring Geographic Accessibility
- According to the literature, these studies on mortality rates indicate an apparent evidence of geographic effects on health and geospatial researchers have identified these patterns as an important national policy problem in public health [14] [15]. The regional variations of mortality rates confirm the significance of spatial methods in measuring the accessibility patterns [16] and further supports the necessity to analyze geographical accessibility from a spatial perspective so as to reduce health disparities.The availability of detailed spatial data coupled with the ability of Geographic Information System (GIS) to simulate real world scenarios conveys crucial information aiding the analysis with visualization reports [17] [18]. Geospatial methods offer wide range of analytical possibilities to understand the overall picture of health disparities due to geographical accessibility. The computational power of network based GIS methods integrating transportation networks, along with their attribute information such as distances, speed limits and restrictions, provides a framework to assess geographical accessibility by estimating the physical distance or travel time between a right type of health care facility and the patient in need of the service. Even though, distance and time are both important factors of accessibility, World Health Organization (WHO) recommends using travel time, rather than distance, to assess geographical accessibility.
2. Creating Network Based Service Areas for Critical Health Care Facilities
- Defined travel time based service areas are suitable measurements for healthcare accessibility and utilization [19] [20]. This research utilizes GIS Network Analyst tools to model geographical access to specific health care service scenarios in central Mississippi 10 county region, which is characterized with urban and rural regions. Network Analyst tools provide potential for greater use of estimations of travel time that can easily calculate service areas (buffers) and include or exclude populations that exist within the defined boundaries. Creating service areas requires accurate road network data with associated information on speed limits and restrictions. The availability of populations (with demographical profiles) at a finest geographical unit (census block level) will enhance examining the geographical accessibility of services.The framework for measuring geographical accessibility centers on two components 1. Defining optimal travel time service area for each of the three critical health care facilities by building network dataset of transportation routes in GIS 2. Identifying pertinent vulnerable populations at a census block level, outside the optimal service area for the needed critical health care.
2.1. Datasets: Road Network, Specialty Health Care and Population Data
- The road network dataset collected from Census Bureau, 2010 provides high quality, detailed road network data for all the state of Mississippi in vector GIS format and provides information on speed limits and restriction for each and every edge and node which is critical to model real time service areas based on travel time estimates. The three critical specialty healthcare facilities: Obstetrician/Gynecology, Pediatrics and Trauma Centers are collected from Mississippi Primary Health Care Association and are geocoded, based on their physical addresses, to a point layer as a part of dataset. Block level demographic census data obtained from U.S. Census bureau was used in this research to model access to health care facilities. The demographic profiles were categorized as women in childbearing age, children under age of 12 and general population.
2.2. Assumptions
- When representing real world scenarios, a number of assumptions are required for modeling. Centered on numerous population-based studies [21], to model travel time, this research makes assumptions on potential unpredictable factors that influence travel and the lack of geo-referenced data. Therefore, the GIS-based scenarios created for the three critical facilities presents an average situation. This research adopts assumptions that the travel conditions are similar through out the study region and therefore the variable factors influencing the travel conditions such as weather, traffic patterns etc. are kept constant. The research is limited to data availability and data processing capabilities.
2.3. Defining Optimal Travel time Based Service Areas for Health Care with Specialty
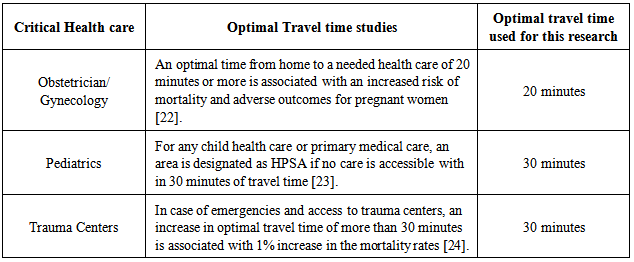
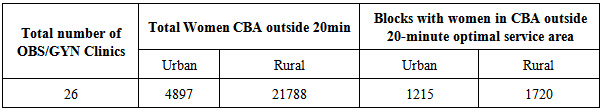
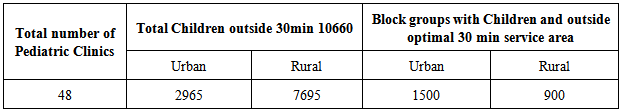
- Defining travel-time based service areas cannot be generalized (as 30 minutes or 1 hour) as every health need has an optimal time to access specialty health care for lower mortality rates. Numerous health and mortality related studies have provided the following optimal travel times appropriate for each of the three critical health care facilities that define the health care system status of any region (Table 1).
|
2.4. Modelling Accessibility Using Optimal Travel time Service Area
- To create travel time based services areas for each of the critical facilities in the study region, ArcGIS Network Analyst was employed. Prior to creating services areas, the major task was to convert the road network dataset into a geospatial network dataset. Each line segment was assigned a travel time cost attributes using the line segment’s length (distance), speed limit and travel impedance factors. The converted network dataset assigns travel time along a line segment based on the distance and speed limit with additional cost in minutes calculated for turn delays. The generated network dataset was loaded into Arc GIS (10.0) along with health care locations and census block level demographic data layers.The travel-time based service areas defined for each of the critical facilities were created as polygons using ‘Service area’ function: a 20-minute service area for obstetrician/Gynecology, 30-minute service areas for pediatrics and 30-minute service area for all the trauma centers were generated. To assess the level of health care access to population, each service area is clipped to the demographic spatial distribution at a census block level. The underserved census blocks are identified by inversing the selected clipped areas of the 20-minute, 30-minute service areas through out the study region. To create population data layer for each health care, a block’s population was assigned to the underserved area only when the centroid fell within the bounds of underserved area polygon. This framework involves considering: 1) Obstetrician/Gynecology: women in child bearing age (CBA) (18-55 years), 2) Pediatrics: children under 12 years, 3) trauma/burn centers: General populations for creating these population data layers.
3. Results and Discussion
- Initial examination of the results indicates that there are few significant gaps in accessibility to some of the health care service. The travel time approach adopted by this study identifies population to have varied level of access to needed health services along the transportation routes. A clear distinction in geographic access to three critical health care emerged between urban and rural populations within the study region. To illustrate the hotspots, the highly populated census blocks outside the optimal travel times are categorized under various levels.The results are presented under the following sections to discuss the geographical accessibility of population to the critical care facilities.
3.1. Geographical Access to Obstetrician/Gynecology
- Figure 1 shows the spatial distribution of obstetrician/ Gynecology health care facilities and the proximity area that can be accessed with in 20-minute to the facility by road.
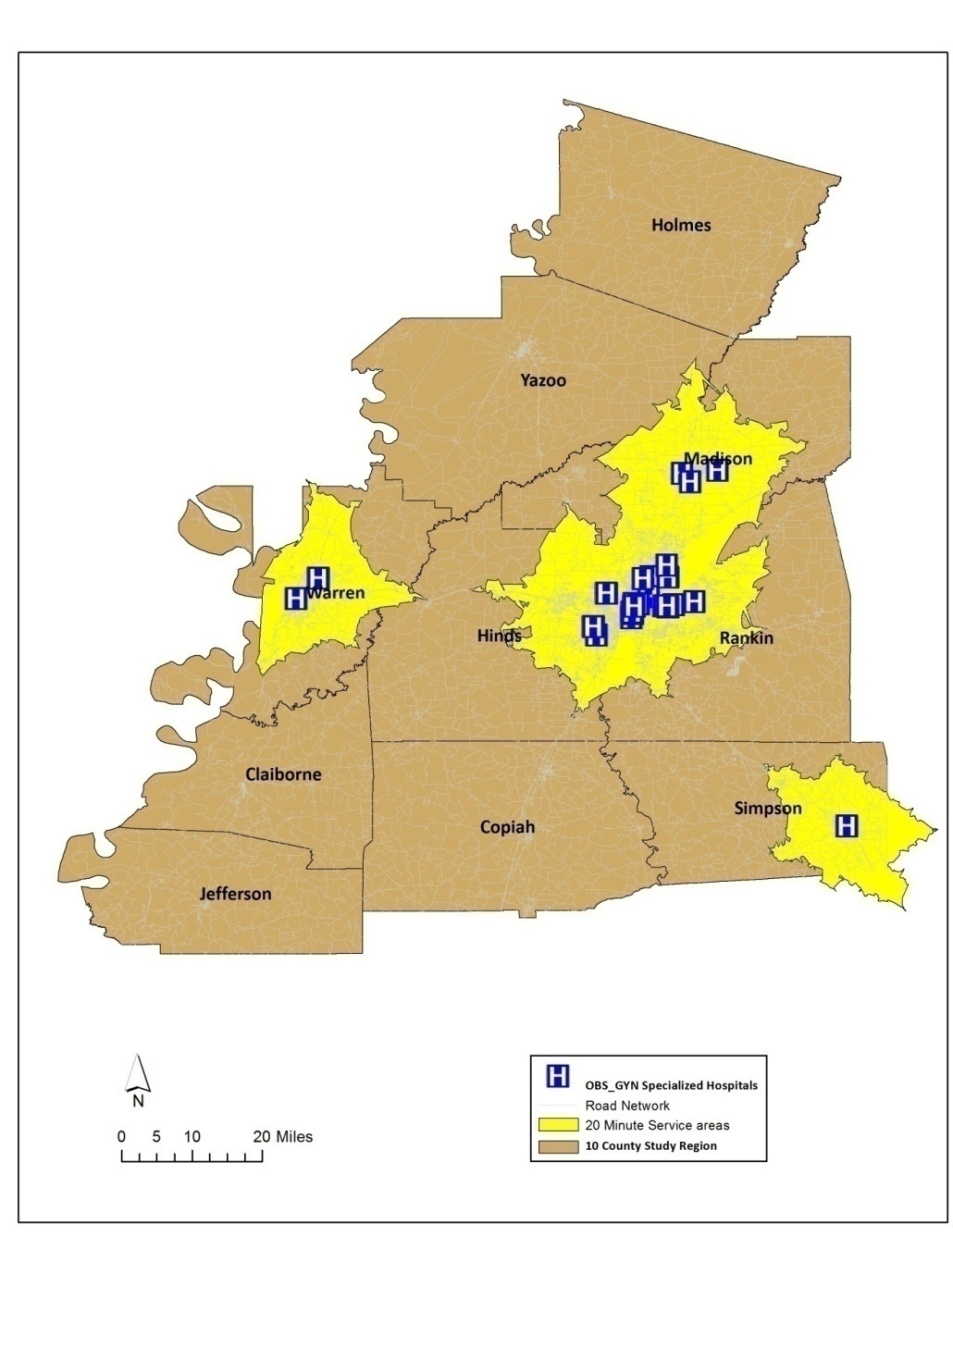 | Figure 1. Spatial distribution of obstetrician/gynecology health facilities |
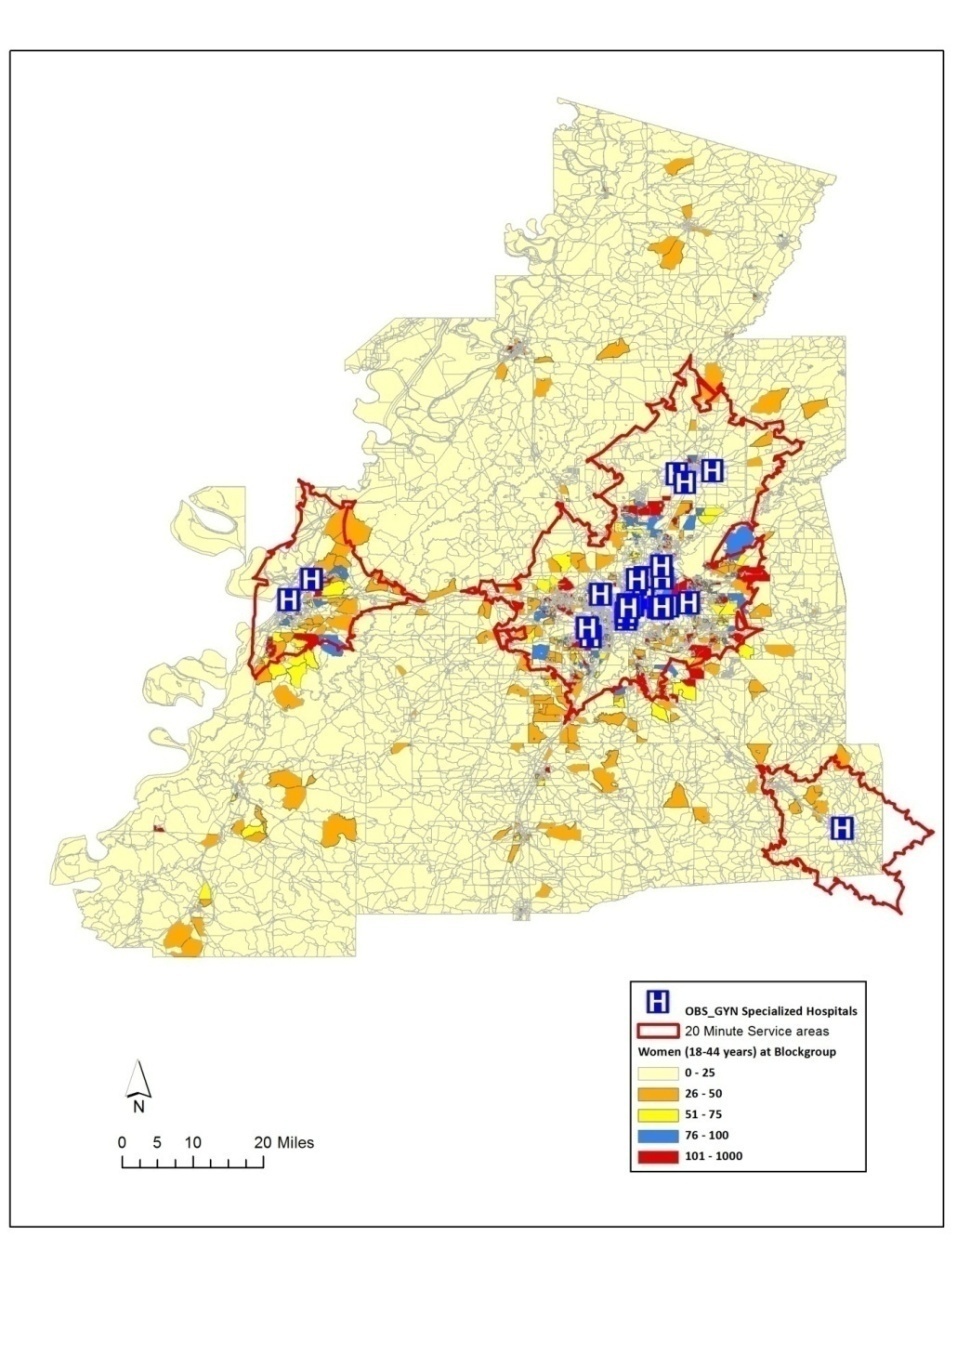 | Figure 2. Optimal 20-minute health service areas and spatial distribution of women in childbearing age |
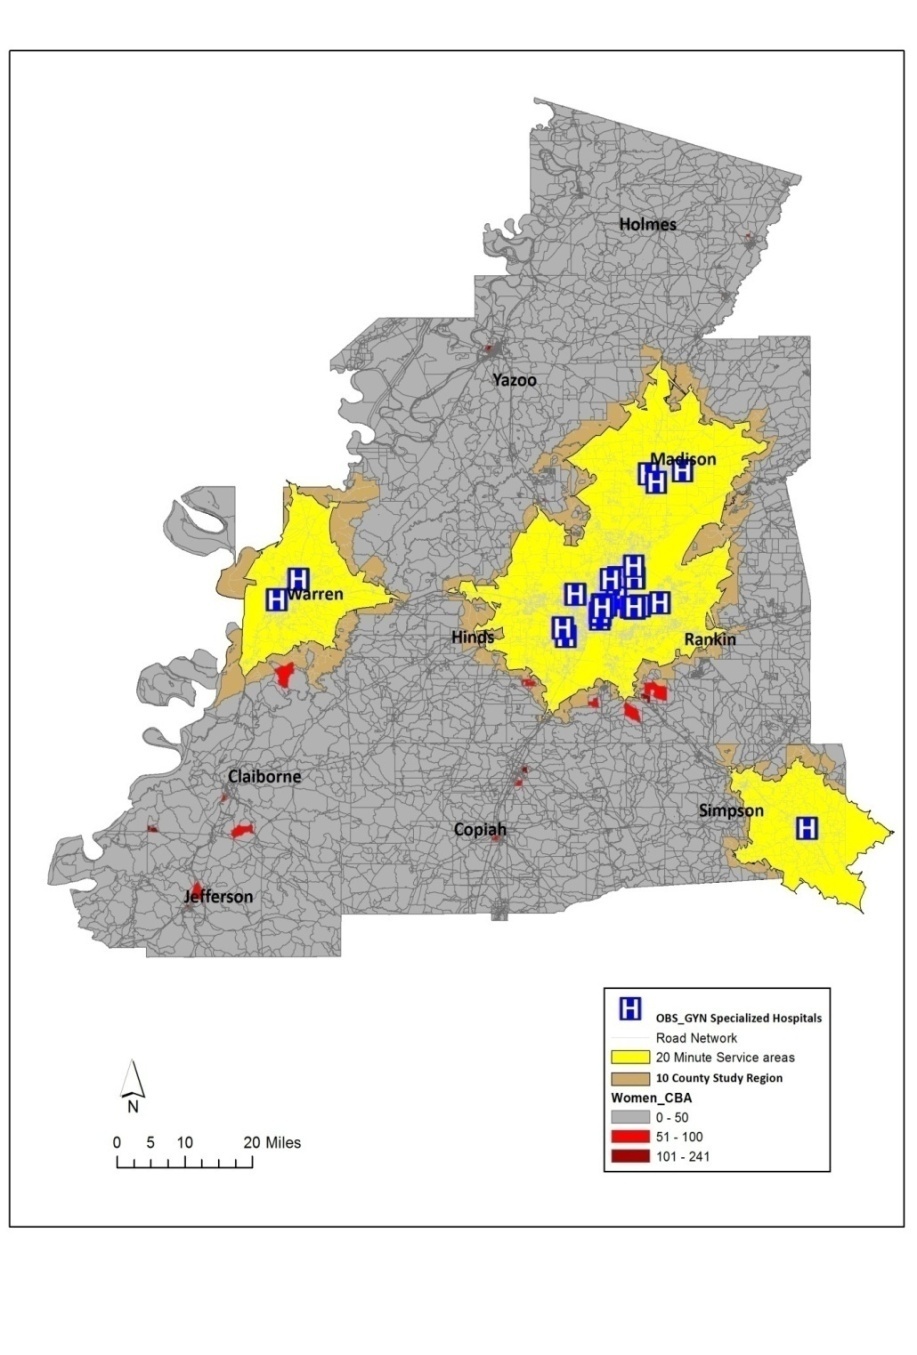 | Figure 3. Hotspots of concentrations of women in childbearing age outside the optimal service regions |
|
3.2. Geographic Access to Pediatrics
- Figure 4 shows the spatial distribution of pediatric health centers and a service area of optimal 30-minutes travel time from each facility (Figure 4).
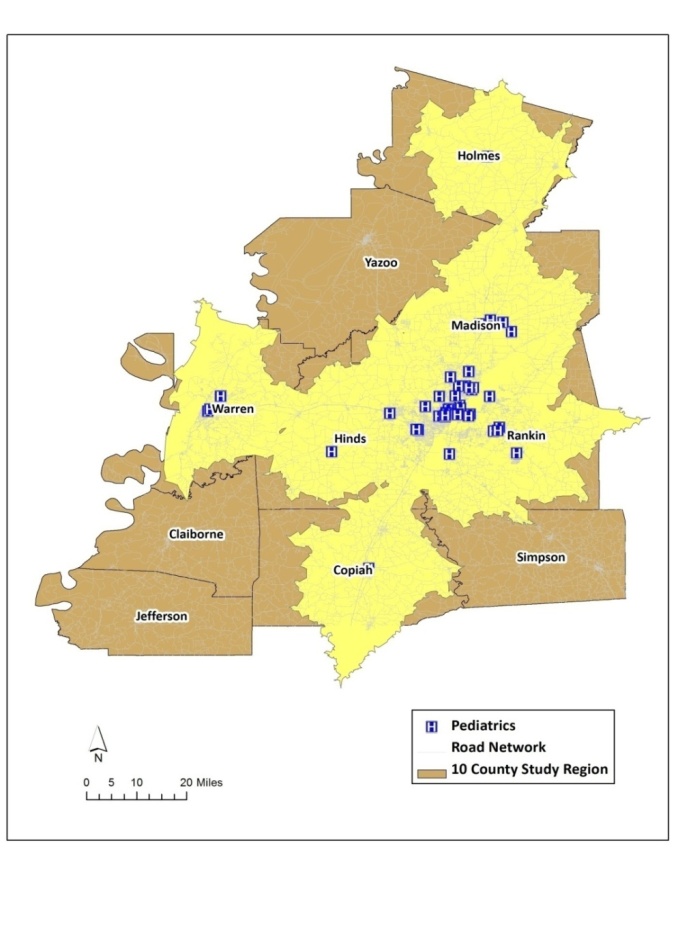 | Figure 4. Spatial distribution of Pediatric health facilities |
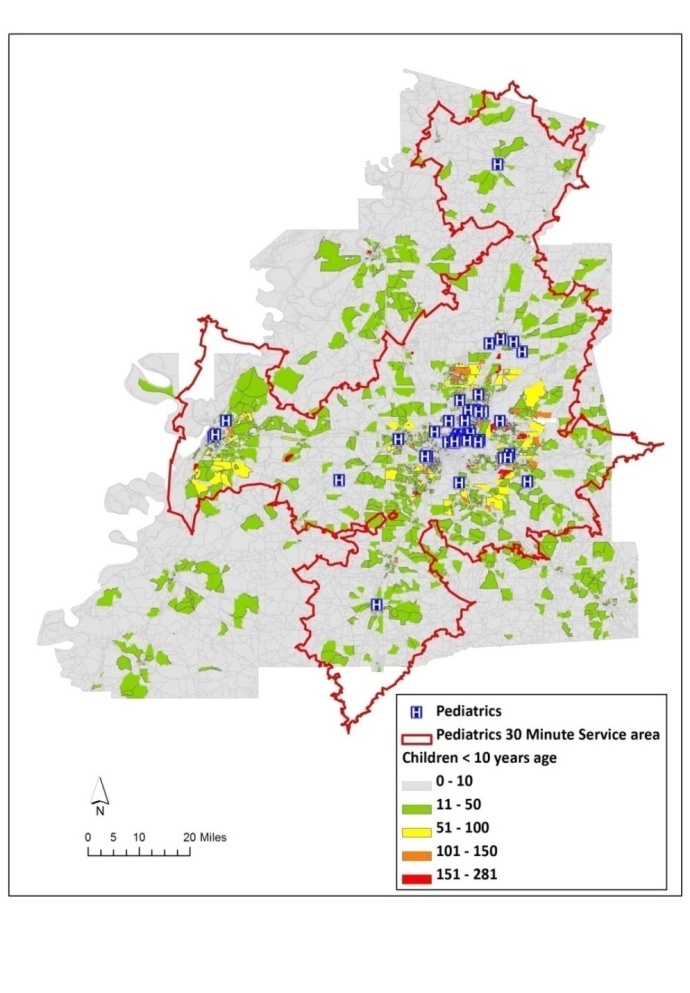 | Figure 5. Optimal 30-minute service areas and spatial distribution of children |
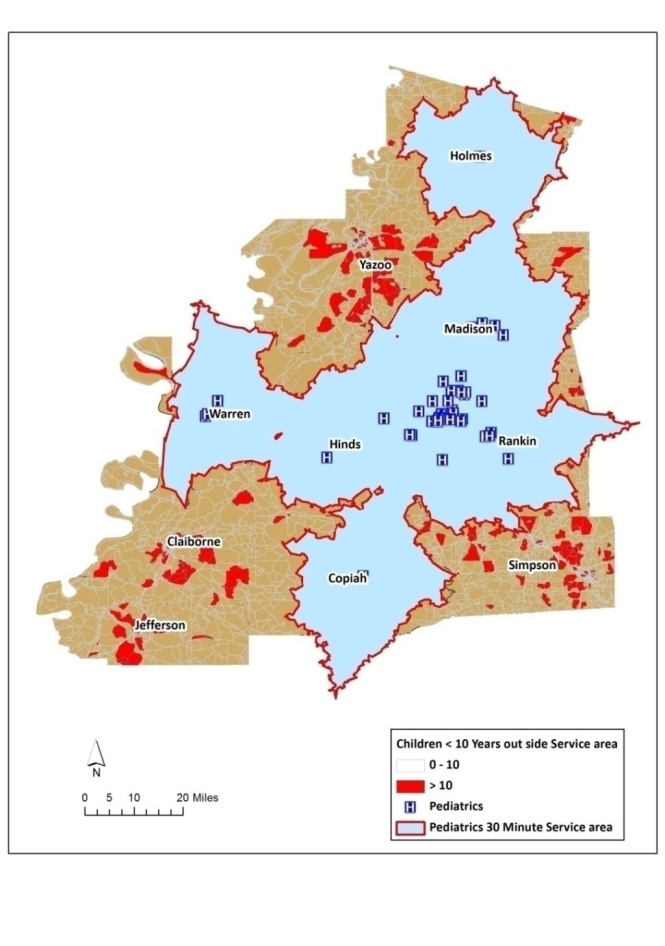 | Figure 6. Hotspots of concentrations of childresn outside the optimal service regions |
|
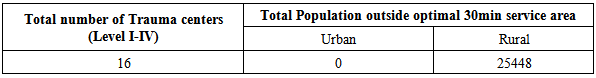
3.3. Geographic Access to Trauma and Burn Centers
- Four levels of trauma centers (I, II, III, and IV) and burn centers are geocoded and mapped in the study region (Figure 7). A 30-minute service area generated using transportation network routes is presented in Figure 8.
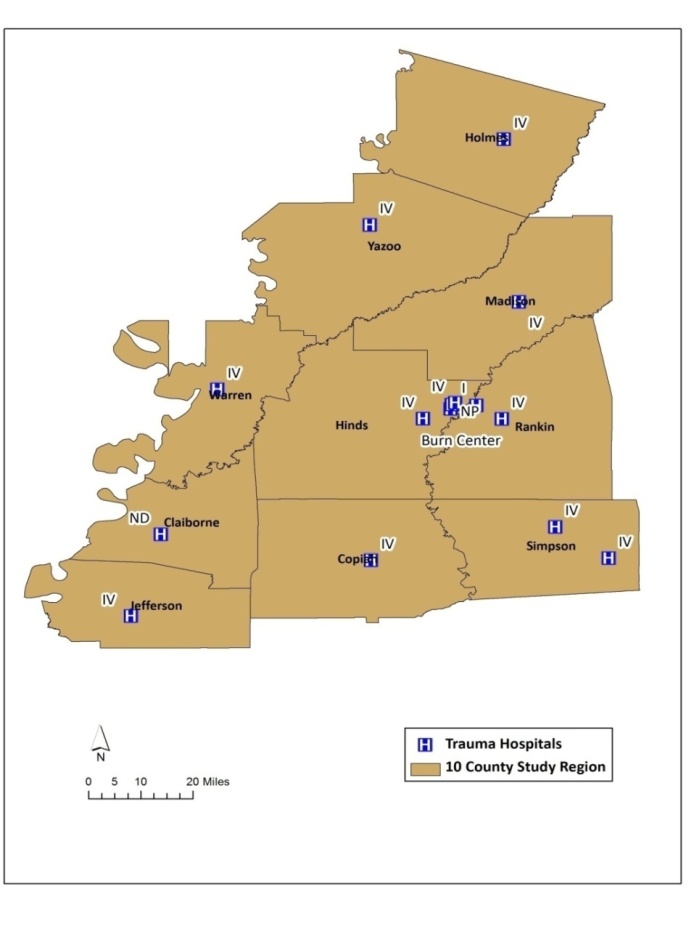 | Figure 7. Spatial Distribution of Truama and burn centers |
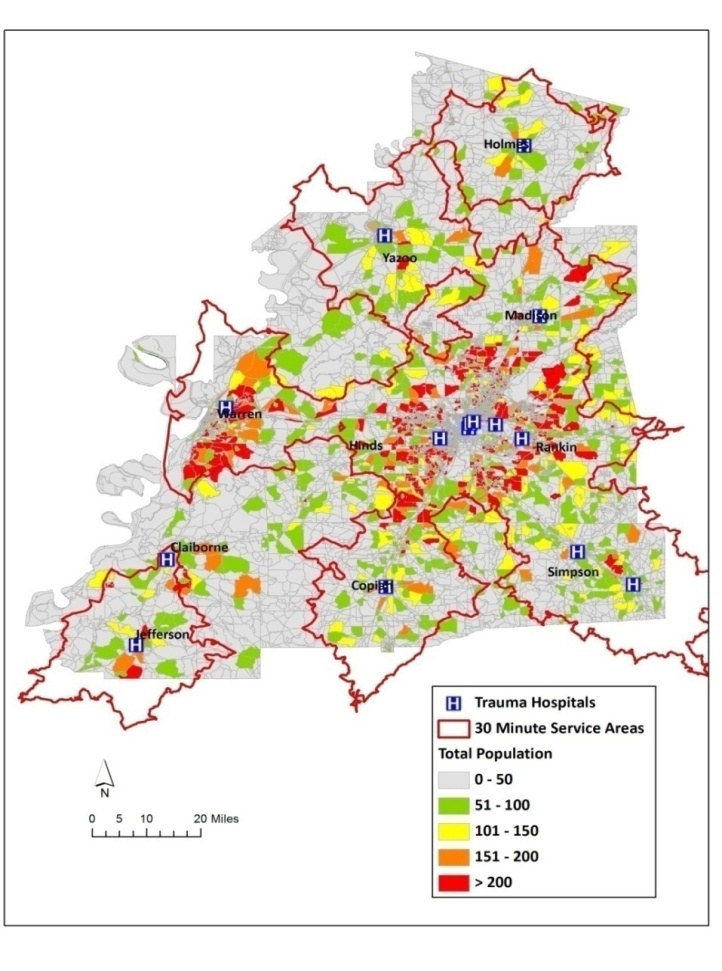 | Figure 8. Optimal 30-minute service areas and spatial distribution of general population |
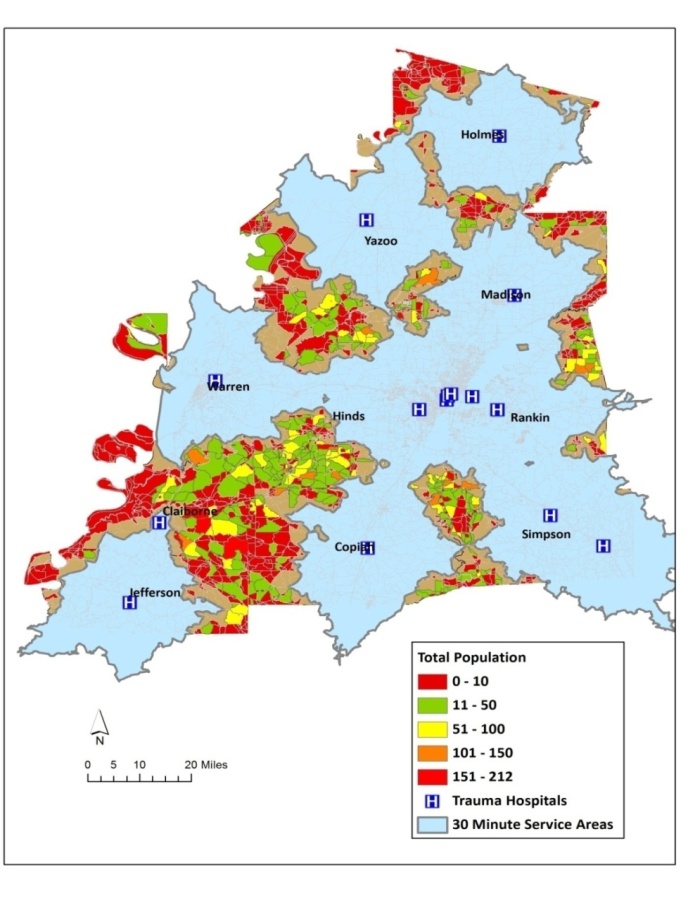 | Figure 9. Hotspots of concentrations of general population outside the optimal service regions |
|
4. Conclusions
- The most significant features affecting the health status and health outcomes involve distance between the population’s geographic regions and health care facilities and the travel time taken to reach the health care delivery system. This research investigates these features by using network-based GIS methods. Spatial distribution of health care facilities in terms of size/number, type and location are geographically analyzed to observe the feasibility of individual’s access to desired services, which in turn impacts overall wellbeing of the communities. This study presents the use of GIS in analyzing health care needs and optimal geographical access in evaluating and planning future health care locations; and provides spatial decision support information for an efficient health care system. This study has demonstrated the power of GIS in modeling the travel times for health care facilities and spatially evaluating the hotspots where people take the burden of mortality rated due to geographic inaccessibility. The geospatial simulation of variations in optimal time when specific health services are required provides crucial information, especially planning for non-urban areas.