-
Paper Information
- Next Paper
- Paper Submission
-
Journal Information
- About This Journal
- Editorial Board
- Current Issue
- Archive
- Author Guidelines
- Contact Us
Public Health Research
p-ISSN: 2167-7263 e-ISSN: 2167-7247
2014; 4(4): 129-135
doi:10.5923/j.phr.20140404.04
Medical and Social Efficiency of Outpatient Service at the Regional Level
Ludmila Gerasimova, Andrey Ivanov
Postgraduate Doctors’ Training Institute, 428032, the Russian Federation
Correspondence to: Ludmila Gerasimova, Postgraduate Doctors’ Training Institute, 428032, the Russian Federation.
| Email: |  |
Copyright © 2014 Scientific & Academic Publishing. All Rights Reserved.
According to the Russian and foreign experts public health protection entirely depends on medical and organizational factors, as morbidity and mortality rates of the population are connected with organization and quality of medical care. The indicators of medical facilities’ efficiency are criteria of social and economic importance of healthcare in the society. The efficiency of the healthcare system and medical facilities is estimated by a set of statistical indicators, each of which describes some components of medical activity. The effectiveness of outpatient’s and inpatient’s care in the administrative-territorial districts of the Chuvash Republic was evaluated according to our methods.
Keywords: Morbidity, Mortality, Evaluation of Healthcare System’s Efficiency
Cite this paper: Ludmila Gerasimova, Andrey Ivanov, Medical and Social Efficiency of Outpatient Service at the Regional Level, Public Health Research, Vol. 4 No. 4, 2014, pp. 129-135. doi: 10.5923/j.phr.20140404.04.
1. Introduction
- Public health is an essential component of the economic, social and cultural development of the country [1-4].Depopulation of the Russian Federation resulted in annual population declining by 0,7-0,8 million people is considered to be an acute state problem [5-6]. Nation’s health deterioration and super mortality doubt the possibility of the economic growth needed to return Russia to the developed countries’ list [7-8]. One of the main problems is poor management of healthcare system due to lack of strategic planning and responsibility of the leaders at all the levels for achieving results and also insufficient use of cost-effective management tools and low scientific validity of decisions. This causes inefficient expenditure of state resources and reduction of respect to the state authorities [9]. In WHO materials it is represented the only possible way "to guarantee health for everyone" in healthcare system it means to return to the resolutions of Almaty international conference (1978) concerning development of primary healthcare as the most available and significant component of public health protection. Within development of primary healthcare the outpatient service is considered to be a basic element of public healthcare [10-14]. However the legal framework of outpatient’s service is not adapted to the peculiarities and requirements of the modern society that led to serious contradictions in the work of this part of healthcare system, including the following inconsistency: of outdated labor standards and the population demands for the outpatient’s services; the increased volume of work and decreased number of medical personnel; the required quality of the medical service and level of financial support [15-20]. These contradictions at the level of primary healthcare have diminished social protection, as well as reduced availability and quality of medical service, led to positive dynamics in public healthcare and deep structural crisis in healthcare system [21].
2. Main Body
- It is necessary to find reasonable resolution of the contradictions, taking into account all the factors affecting the development of social institutions. Under these conditions, there's a need of the regional analysis of the processes associated with morbidity and mortality of the population considering the public, social, economic, ecological and hygienic features of administrative and municipal subjects of the Russian Federation with the extensive involvement of modern information technology [22-23].The objective is to develop a method of estimating the effectiveness of outpatient’s service at the level of the subject of the Russian Federation (in case of the Chuvash Republic).Materials and Methods: Medical and statistical analysis of the dynamics and structure of morbidity and mortality rates in the Chuvash Republic within 2001-2011 based on statistics submitted by the State Committee on Statistics of the Chuvash Republic.On the basis of cartographical analysis the administrative districts of the Chuvash Republic have been grouped according to the morbidity and mortality rates [24]: 1) The following has been calculated: arithmetic mean of relative indicators for the regions and towns in the Ch R per every year under analysis (the average national data - M1-10) by the formula М=∑V/n,where М – the arithmetic mean ;
 V – relative indicators of regions and towns of the Ch R;
 n – number of observations;2) it is determined by the standard deviation of a statistic series variations of the average national data per year by the formulaδ=√∑d2/n-1,where d - deviation (difference between the mean and each variation);
 n - number of observations;3) it is determined the intervals to group the districts according to disability rate:
 M-0,5δ ≤ M1 ≤ М+0,5δ - index within the average national data (middle) in the Chuvash Republic;
 М+0,5δ < М1 ≤ М+1,5δ - rate above the average national data (high) in the Chuvash Republic;
 M-1,5δ ≤ M1 < M-0,5δ - rate lower than the average national data (low) in the Chuvash Republic;
 M1 > М+1,5δ - ultra-high rate;M1 < М-1,5δ - extremely low rate4) it is determined the average of the districts per decade М11- М123 by formula of the arithmetic mean;5) districts and towns were grouped by distribution М11-М123 according to the corresponding intervals.The efficiency of rendered outpatient’s and inpatient’s care for different administrative-territorial districts have been estimated according to the method developed by us. [25-26].The map analysis of the overall mortality rate reveals the following: significant territorial differences of the indicators and distribution peculiarities of the average indicators of overall mortality in the Chuvash Republic within analyzed period (Fig. 1).
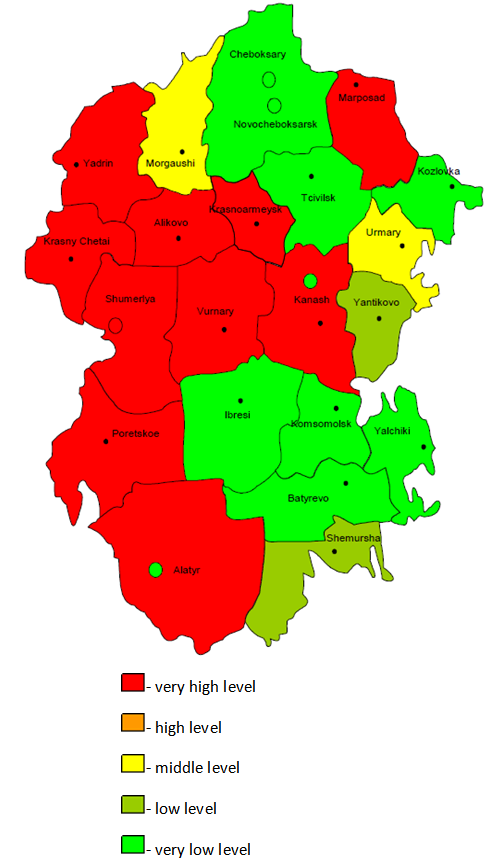 | Figure 1. The overall public mortality rate in administrative-territorial districts of the Chuvah Republic in 2001-2011 (per 1 thousand of people) |
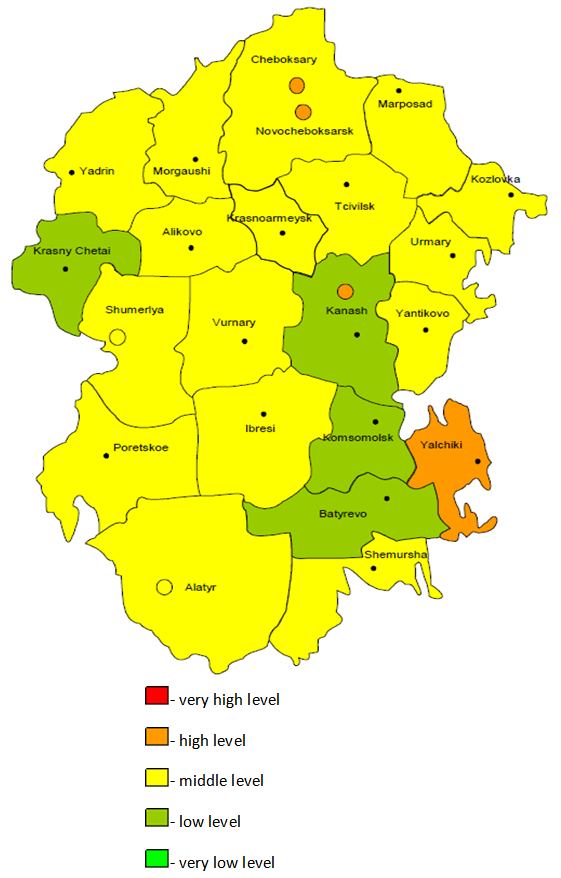 | Figure 2. The overall morbidity in administrative-territorial districts of the Chuvash Republic in 2001-2011 (per 1 thousand of people) |
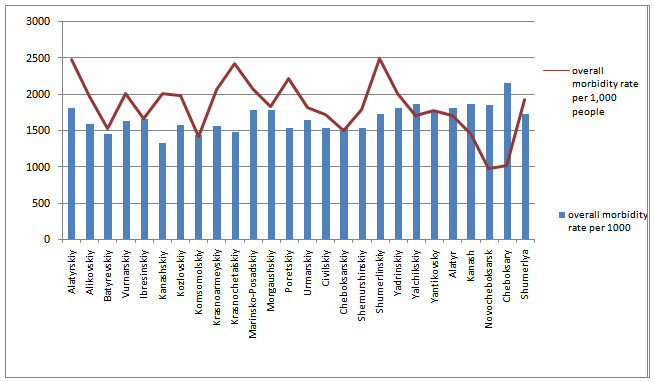 | Figure 3. The average indicators of the overall morbidity and mortality rates in the Chuvash Republic for 2001-2011 |
 The coefficient of KS/M calculated by us on the territory of the Chuvash Republic, allowed to identify the districts, where disproportion of low overall morbidity rate and high mortality rate is higher than the average republican mean. (Poretskiy, Shumerlinskiy, Kanashskiy and Krasnochetajskiy districts) (Figure 4).
 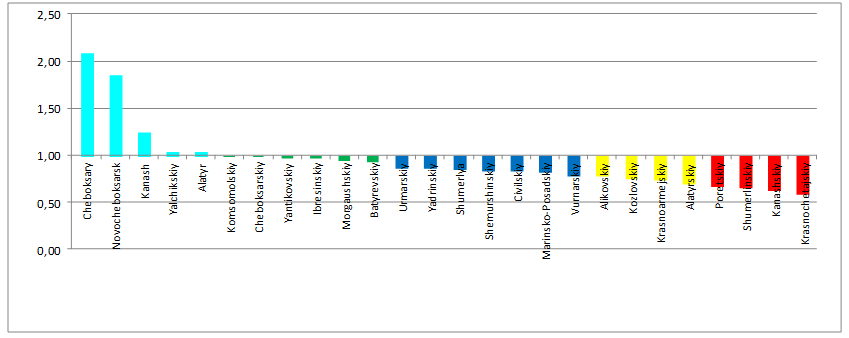 | Figure 4. The coefficient Кз/с of the overall morbidity and mortality rates in administrative territorial districts of the Chuvash Republic (2001-2010) |
 Using the Кage coefficient, we established the analytical indicator of the effectiveness of health care institutions at the regional level (Fig. 3).Кanalysis = К(З/С) × КageFor distribution of the areas of the analytical indicator of Кanalysis in administrative districts of the Chuvash Republic, we used the grouping where the range of interval is determined by formula:
 Figure 5 demonstrates the distribution of Канализ, for administrative districts where it was less than unity, taking into account age as a major risk factor for circulatory diseases. When comparing the results presented in Fig. 4 in Figure 5, it is obvious that adjustment for age let us detect districts with inappropriate efficiency of outpatient’s healthcare services of public health protection more accurately.
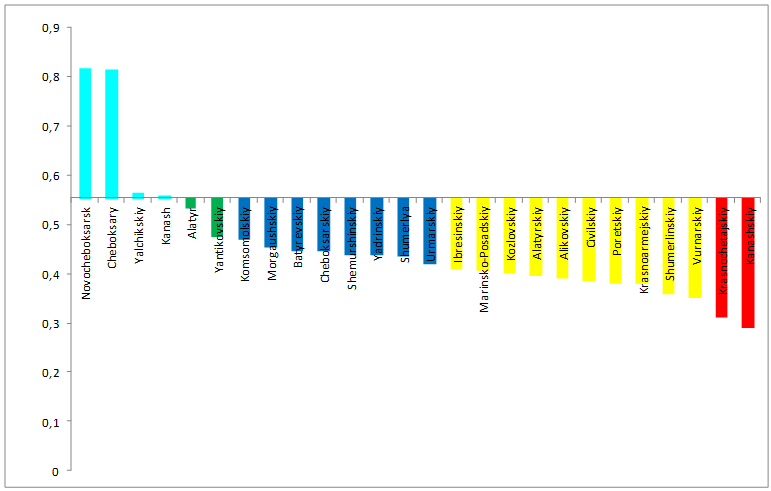 | Figure 5. Analytical data of Кз/с ratio of the overall morbidity and mortality rates in administrative-territorial districts of the Chuvash Republic |
3. Conclusions
- Now therefore, the analytical indicator considering age allows to estimate more accurately effectiveness of both outpatient and inpatient healthcare services and work quality of public healthcare system in every region and make relevant managerial decisions.
 Abstract
 Reference
 Full-Text PDF
 Full-text HTML