-
Paper Information
- Paper Submission
-
Journal Information
- About This Journal
- Editorial Board
- Current Issue
- Archive
- Author Guidelines
- Contact Us
Public Health Research
p-ISSN: 2167-7263 e-ISSN: 2167-7247
2012; 2(2): 21-27
doi:10.5923/j.phr.20120202.04
Temperature Modifies the Effects of Particulate Matter on Non-Accidental Mortality: A Comparative Study of Beijing, China and Brisbane, Australia
 Abstract
 Reference
 Full-Text PDF
 Full-text HTML
Guoxing Li1, Jing Sun1, 2, Rohan Jayasinghe3, Xiaochuan Pan1, 2, Maigeng Zhou4, Xuying Wang1, Yue Cai4, Ross Sadler2, Glen Shaw2
1School of Public Health, Peking University, Beijing, 100191, China
2School of Public Health and Griffith Health Institute, Griffith University, Parkland campus, Gold Coast, Q4222, Australia
3School of Medicine. Griffith University and Cardiac Services/ Cardiology, Gold Coast Health District Gold Coast Hospital, Q4222, Australia
4The Center for Public Health Surveillance and Information Service, Chinese Center for Disease Control and Prevention, 155 Changbai Road, Changping, Beijing, 102206, China
Correspondence to: Xiaochuan Pan, School of Public Health, Peking University, Beijing, 100191, China.
| Email: |  |
Copyright © 2012 Scientific & Academic Publishing. All Rights Reserved.
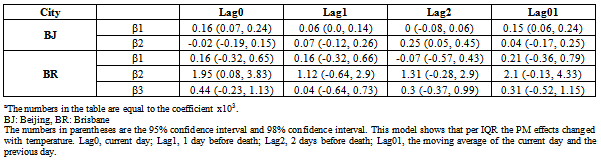
The interactive effect between temperature and ambient particulate matter on mortality has attracted attention world-wide, but the results of studies investigating this interaction have been inconsistent. This comparative study aims to further clarify this important public health issue.The present study used two separate time-series analyses to explore whether the mean temperature modified the impact of ambient particulate matter of less than 10 m in diameter (PM10) on daily non-accidental mortality in Beijing, China (2005–2009) and Brisbane, Australia (2004–2007). A bivariate response model and a stratification parametric model were used. The results show statistically significant interactive effects between PM10 and temperature on non-accidental mortality at various time lags. PM10 had a greater adverse effect on non-accidental mortality from cardiovascular disease on high temperature days. The interactive term coefficients per interquartile range increase in PM10 concentration and in high temperature levels were 1.95% (0.08%, 3.83%) in Brisbane, Australia on the current day and 0.25% (0.05%, 0.45%) in Beijing, China 2 days before the current day. The implications of this result indicate that it is important to reduce the emission of air particles on high temperature days in both cities, especially in Brisbane, Australia.
Keywords: Particulate Matter, Temperature, Non-Accidental Mortality
Cite this paper: Guoxing Li, Jing Sun, Rohan Jayasinghe, Xiaochuan Pan, Maigeng Zhou, Xuying Wang, Yue Cai, Ross Sadler, Glen Shaw, Temperature Modifies the Effects of Particulate Matter on Non-Accidental Mortality: A Comparative Study of Beijing, China and Brisbane, Australia, Public Health Research, Vol. 2 No. 2, 2012, pp. 21-27. doi: 10.5923/j.phr.20120202.04.
Article Outline
1. Introduction
- Many epidemiologic studies have shown that ambient particulate matter has adverse effects on non-accidental mortality. For example, airborne particulate matter ≤2.5
 m (PM2.5) or ≤10
  m (PM10) in aerodynamic diameter have adverse effect on acute cardiopulmonary functioning [1-3]. In an analysis of data from 90 US cities, Dominici et al. reported that the estimated effect on non-accidental mortality is 0.41% per 10
  g/m3 increment in PM10 concentration (1). An association between PM10 and non-accidental mortality has also been noted in Europe; for example, Aga et al. reported a 0.8% increase in mortality in the elderly per 10
  g/m3 increment in PM10 from a study of 29 European cities (2). Wong et al. explored the relationship between PM10 and non-accidental mortality in four Asian cities and found that the percent increase with a 10
  g/m3 increments in PM10 was 0.55% (3). The mechanism of the PM10’s cardio pulmonary effect is the linkage of PM inhalation with cardiopulmonary responses including inflammation, endothelial and autonomic responses. However, a comparative study in comparing cities with low and high population density and with different temperature patterns in relation to different level of air pollution inhalation to non-accidental events have not been fully evaluated.The mediating effect of temperature on the effect of PM10 and non-accidental mortality has also long been a matter of public health interest. A strong association between high ambient temperatures and mortality has been found in certain studies. Le Tertre et al. found that the all-cause mortality in nine French cities increased by 3,096 extra deaths in the 2003 heatwave (4). This is consistent with reports from other countries. Temperature effects are more pronounced in the elderly, women and those with chronic diseases (5-9).Although the independent impacts of temperature and air pollution on daily mortality have been widely explored, the interactive effect between air pollution and high temperature on mortality has been less well investigated. Previous studies on these interactions are controversial. For example, Li et al. found a synergistic effect between pollution and high temperature on cardiopulmonary mortality in Tianjin, China (10). However, Stafoggia et al. found that the interaction between PM10 and temperature resulted in positive, but in most cases, statistically non-significant coefficients in a multi-city analysis in Italy (8). In these studies, time-series and case- crossover methods were used, respectively. To clarify this issue, the interaction between temperature and ambient particulate matter must be explored using the same methodology in different countries and regions.In the current study, we have employed a comparative approach using the time-series method in two cities with different climate characteristics, air pollution levels and population density: Beijing in China, and Brisbane in Australia.
2. Methods
2.1. Study Areas
- Beijing, the capital of China, is located at a latitude of 40.1' north, and a longitude of 116.2' east. It is situated on the North China Plain, surrounded by mountains of 1,000–1,500 m in altitude to the west, north, and northeast, with the Bohai Sea on its southeastern side. Beijing features a typical warm, temperate, semi-humid continental monsoon climate, with hot, humid summers and cold, dry winters. Our study area included the urban area of Beijing, which covers approximately 1,368 km2 and consists of eight districts with a high population density of approximately 7 million people.
2.2. Mortality and Environmental Data
- Daily counts of all known Brisbane and Beijing non- accidental deaths (International Classification of Diseases, 10th Revision, and ICD-10: A00-R99) were obtained from Department of Health of Queensland Government in Australia and Chinese Centre for Disease Control and Prevention in China. Non-accidental mortality includes any case of death of a person either where there is no identifiable incident or trauma involved, or which is the result of an apparent suicide. The temperature and including minimum tempterature, maximum temperature were collected from Environmental Protection Agency Australia in Brisbane and China Meteorological Data Sharing Service System. Daily data of air pollutant in Brisbane and Beijing was from Environmental Protection Agency Australia and Beijing Municipal Environmental Monitoring Center. The time-series of daily death data available for analysis in each city covered different time periods: for Beijing, data for the five years from 1 January 2005 to 31 December 2009 was available for analysis, while for Brisbane, data was available for the four years from 1 January 2004 to 31 November 2007. Daily mean temperature and relative humidity data were also obtained for each location.
2.3. Statistical Analysis
- Spearman correlation analyses were conducted to evaluate the bivariate association between the weather factors and air pollutants during the study period. Separate analyses were conducted for each city. The generalized additive Poisson regression Model (GAM) approach was used to model the natural logarithm of the expected daily death counts as a function of the predictor variables (11). It is generally assumed that the daily number of deaths in a population is a low probability event and has a Poisson distribution. The potential nonlinear effects of certain confounding factors, such as seasonal variation and weather conditions, on the dependent variable can be modelled with nonparametric smoothing functions in the GAM model. We used days of calendar time with a penalised smoothing function to adjust for confounders from seasonality and short-term fluctuations using the day of the week as a factor. Other potentials confounders, such as relative humidity and public holidays, were also adjusted for.First, in order to estimate the potential interactive patterns of both PM10 and mean temperature on mortality, we fitted a bivariate response surface model by thin-plate spline. The degrees of freedom for the thin-plate spline were chosen using the generalised cross-validation method (12, 13).Model 1Log[E(Yt|X)]=TS(mean temperature, PM10)+S(season, 7*N)+factor(DOW)+factor(holiday)+S(relative humidity, 3)=TS(mean temperature, PM10)+COVs;Where t refers to the day of the observation, E(Yt|X) denotes the estimated daily case counts on day t, and S() denotes the penalised smoothing spline. TS denotes the thin-plate spline, while PM10, mean temperature and relative humidity represent the current day's PM10 concentration, temperature and relative humidity (14, 15). Seven degrees of freedom per year for time were selected so that little information from time scales longer than two months was included (16). This choice largely reduced confounding from seasonal factors and from longer-term trends. N denotes the number of years, while DOW represents the day of the week. Holiday was treated as a dummy variable (0 or 1 denotes not a holiday or a holiday, respectively).Before exploring the effect of modification of the air temperature on the PM10–mortality relationship, we used an independent model to explore the patterns of the relationship between the temperature and mortality. The independent model is described below:Model 2Log[E(Yt|X)]=S(mean temperature, 3)+PM10+COVsWe adjusted for the same covariates as in Model 1. There were J- and U-shaped associations between temperature and mortality for Beijing and Brisbane, respectively. Temperature stratification cut-offs were determined by AIC values, using 1℃ increments in mean temperature from 15–30℃, which was selected based on visual inspection of the plots. The temperature corresponding to the model with the lowest AIC value was chosen as the threshold temperature.We employed the generalised additive model as follows:Model 3Log[E(Yt|X)]=TC+TH+PM10+COVsWhere TH refers to a matrix obtained by applying the ‘double threshold’ DLNM to temperatures below the cold threshold and above the hot threshold.Finally, a temperature-stratified parametric model was employed, in which temperature was divided into different strata based on Model 2 (10). Through temperature stratification, this approach allowed us to examine the heterogeneity of PM10 effects in order to estimate the extent of the interaction.Model 4
 Where temp denotes the levels of temperature at the current day.
  1 signifies the main effects of PM10,
  2 reflects the interactive effect of PM10 and high temperature, while
  3 is the interactive effect of PM10 and low temperature (which was used in Brisbane only).The estimated modifying effects were expressed as the increased percentage of the daily death counts with per interquartile range (IQR) increment in the daily mass concentration of pollutants. All analyses were performed using R software, Version 2.11.1, using the mgcv and dlnm package, 1.6.2.
3. Results
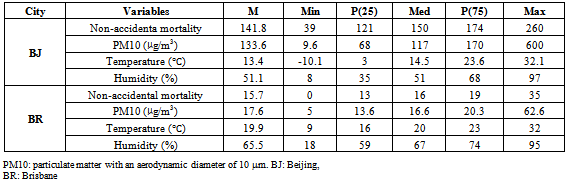
- Table 1 provides summary statistics for the two cities during all seasons. The average number of deaths from non-accidental mortality was 141.8 and 15.7 for Beijing and Brisbane, respectively. The corresponding ambient PM10 concentrations were 133.6
 g/m3 and 17.6
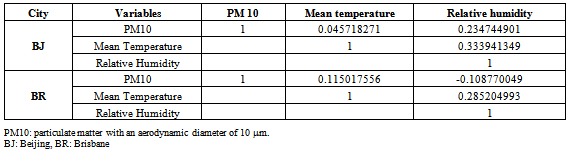
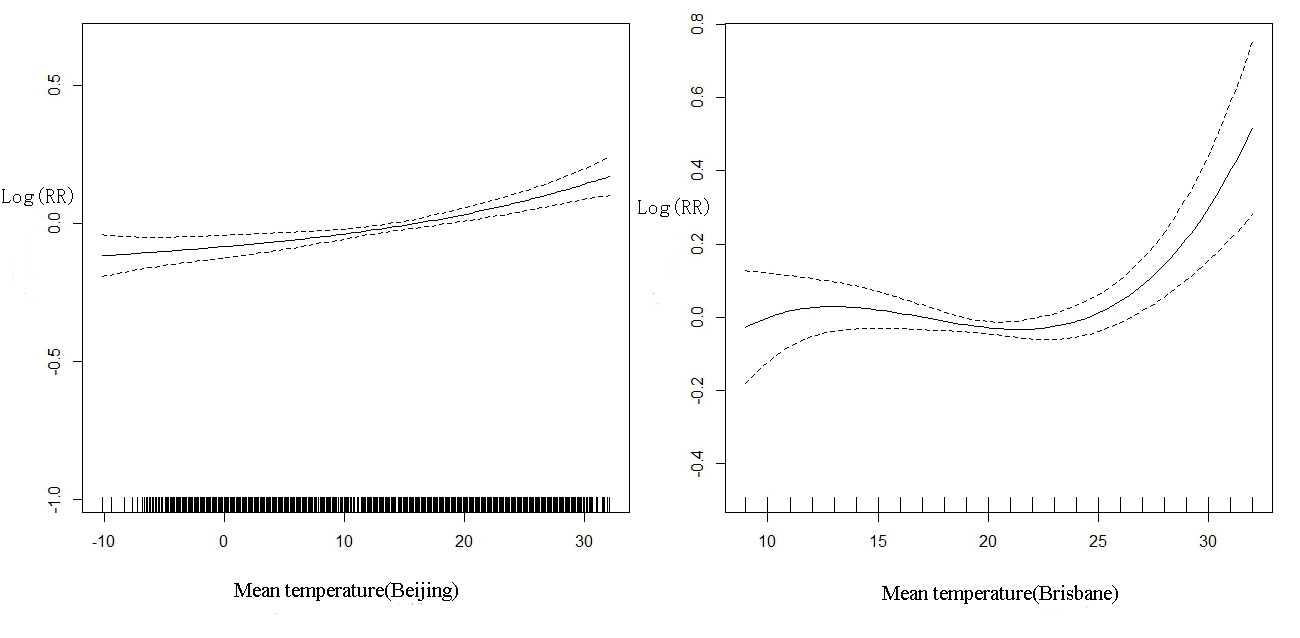
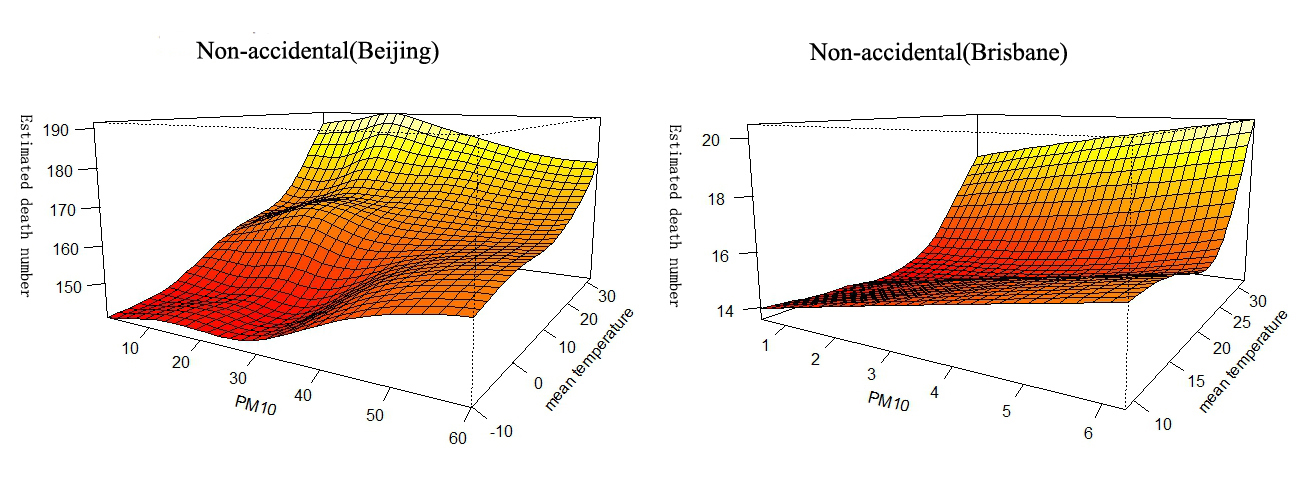
 g/m3, respectively. The mean temperatures were 13.4℃ and 19.9℃ for Beijing and Brisbane, respectively. The ambient PM10 concentration range in Beijing was obviously wider than that in Brisbane, hence we used the IQRs to compare the PM10 effects in the two cities.Table 2 shows the Spearman correlations between the weather variables and air pollutant concentrations over the study period. PM10 and mean temperature were positively correlated in both cities. PM10 was negatively correlated with the relative humidity in Brisbane; conversely, PM10 showed a positive correlation coefficient with relative humidity in Beijing. Relative humidity and mean temperature were positively correlated in both cities.Figure 1 shows the potential interactive effects of PM10 and mean temperature on mortality. Statistically significant relationships were observed. Figure 2 graphically shows the non-linear relationship between mean temperature and mortality in the two cities. It is evident that the pattern of the association between mean temperature and mortality exhibits a J-shape for Beijing, and a U-shaped form for Brisbane. Based on these results, we stratified the temperatures into two or three levels for Beijing and Brisbane respectively. According to AIC, 23℃ and (20℃, 26℃) were chosen as the cut-off points.
|
|
 | Figure 1. Bivariate response surface of mean temperature and PM10 on non-accidental mortality |
 | Figure 2. Dose-response curve between temperature and non-accidental mortality |
|
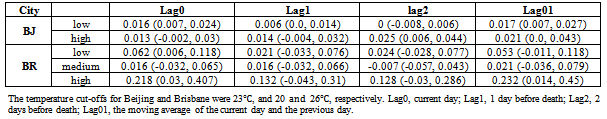
 g/m3 increment in PM10, non-accidental mortality increased 0.016% (95% CI: 0.007–0.024) at high temperature levels, and 0.013% (95% CI: -0.002–0.030) at low temperature levels in Beijing on the current day. Per IQR increment of PM10, non-accidental mortality increased 0.062% (95% CI: 0.006–0.118) at high temperature levels, 0.016% (95% CI: -0.032–0.065) at medium temperature levels and 0.218% (95% CI: 0.030–0.407) at low temperature levels in Brisbane on the current day.
4. Discussion
- The current study was designed to analyse the interactive effects of particulate matter and temperature on population mortality in Beijing, China, and Brisbane, Australia. We tested the hypothesis that temperature modifies the effect of ambient PM10 on health by adding linear interaction terms between PM10 and stratified temperature to our mathematical model. The results showed that high temperature can enhance the effect of PM10 on non-accidental mortality, and that there is an interactive effect between temperature and PM10 concentration.We found different patterns in relation to the effect of particular matter and temperature on population mortality in Beijing and Brisbane. In Brisbane, the results indicate a significant increasing mortality rate with increasing temperature and PM10 concentration. The increasing mortality in Beijing shows a different pattern when temperature and PM10 concentration increased. It is noted that the PM10 concentration in Beijing is ten times higher than in Brisbane and the temperature range in Beijing (–10 to 35℃) is much wider than that of Brisbane (10–35℃). However, people in Brisbane were more sensitive to the increasing temperature and PM10 concentration than people in Beijing, as indicated by the increasing mortality rate in Brisbane.It is biologically plausible that high temperatures modify the effects of PM10 on health outcomes. First, high temperatures may increase cardiovascular mortality. Nayha reported that high temperature dilates skin vessels and facilitate sweating, leading to a decrease in blood pressure, loss of fluid and salt, and the risk of thrombosis (17). Basu et al. and Bouchama et al. found that high temperature increases heat loss through increased skin surface blood circulation, which may be related to the increase in mortality (18, 19). Second, ambient particles can also pose a threat to health. Schins et al. found that ambient particles increase tumour necrosis factor alpha (TNFalpha) and glutathione depletion in a study involving bronchoalveolar lavage of rat lungs (20). Wu et al. and Fang et al. found an association between the concentration of ambient particulate matter and heart rate variability (21, 22).In most epidemiological studies on PM10 and mortality, the effect of the same changes in concentrations of PM10 on mortality was examined, and showed similar results. An excess risk of 0.55% per 10
 g/m3 PM10 on all natural causes of death was reported in the PAPA study (3). Daniels et al. found that each 10
 g/m3 increase in PM10 concentration was associated with an excess risk of 0.54% (23). Katsouyanni et al. reported a 0.6% excess risk in the APHEA study (24). However, considering the ranges of PM10, which are 0.0–78.7
  g/m3 (90th percentile) in the United States, 0.0–170
  g/m3 in Europe, and 0.0–566.8
  g/m3 in Asia, the excess risk per IQR increase of PM10 on mortality are different in each of these regions, with the corresponding risk being higher in the developed countries than in the developing countries. Our results also were in agreement with the literature, in that the effect per IQR increment of PM10 was higher in Brisbane than in Beijing. In addition, climate characteristics also may play an important role. In a study involving 13 Spanish cities, Iniguez et al. found that populations in cities with higher variability in temperature showed greater resistance to heat effects (25). In our study, the range of temperatures was 42.2℃ and 23℃ in Beijing and Brisbane, respectively. The minimum temperature in Brisbane is well above zero, while that in Beijing is -10.1℃. Hence, compared to the population in Beijing, the population in Brisbane may be more susceptible to high temperatures.Several studies have explored whether temperature modifies the adverse effects of PM10 on cardiopulmonary mortality, but these have not shown consistent results. Some studies have found interaction effects (14, 26), while others have not (27-29). The discrepancies between these findings may be influenced by many factors, such as geographic conditions and population characteristics. The analytical methods used in these studies may also contribute to this lack of consistency. For example, Qian et al. added indicators of extreme temperature and interaction terms between these indicators and PM10 to the basic model in order to analyse their modifying effects (14). Ren et al. employed a bivariate response surface model and a stratification parametric model to analyse interactive effects (26, 30). The combination of a bivariate response surface model and a stratification parametric model is sensitive enough to capture these interactive effects. On the one hand, a bivariate response surface model is sufficiently flexible to determine whether any potential interaction exists, while on the other hand, a stratification parametric model can provide parametric estimates.Further, the selection of cut-off values for temperature stratification is still a challenge. Roberts used the 10th and 90th percentile temperatures as cut-offs (31), while Stafoggia used the 50th and 75th percentile temperatures as cut-offs (13). Ren et al. used the mean temperature as the cut-off point (26). Yu et al. chose a cut-off point with the lowest AIC value in their model (32), and Li et al. used the turning point of the dose-response curve between temperature and mortality (10).The selection method in this study has several advantages. First, a dose-response curve allows the visual determination of potential turning points (33). Second, AIC is sensitive enough to obtain the appropriate stratification points, allowing the determination of parametric estimates, which are simple to interpret (34, 35). In this study, since the dose- response curve in Beijing was J-shaped, one turning point was selected, while there was a relatively flat section in the dose-response curve in Brisbane, so two turning points were chosen.Our study has several limitations. First, the data on meteorological factors and PM10 used in this research was the average concentrations in these cities, not the individual level exposures, and hence a degree of bias from measurement errors may be present. Second, the lifestyle and population characteristics are very different in these two countries. Australia is a developed country where life is easy, while China is one of the largest developing countries and people in Beijing are under high levels of stress. There might also be important air pollutant confounders, such as ozone, as suggested by Schwartz et al. who found that ozone was associated with mortality (36).To conclude, in this time-series study, we found that interactions between PM10 and temperature were obvious in both cities. The population in Brisbane was more sensitive to PM10 on high temperature days than that in Beijing. There are few studies comparing the differences between two cities in different countries and continents. Further studies are needed to confirm our findings and explore the confounding effects of lifestyle and other air pollutants on the occurrence of non-accidental cardiovascular diseases in Australia and China.
Acknowledgements
- We thank the China Centres for Disease Control and Prevention. This project is supported by the National Natural Science Foundation of China, Grant No: 30972433.
Conflict of Interest
- The authors declare that they have no conflict of interest.
References
| [1] | Dominici F, McDermott A, Daniels M, Zeger SL, Samet JM. Revised analyses of the National Morbidity, Mortality, and Air Pollution Study: mortality among residents of 90 cities. J Toxicol Environ Health A. 2005 Jul 9-23;68(13-14):1071-92. |
| [2] | Aga E, Samoli E, Touloumi G, Anderson HR, Cadum E, Forsberg B, et al. Short-term effects of ambient particles on mortality in the elderly: results from 28 cities in the APHEA2 project. Eur Respir J Suppl. 2003 May;40:28s-33s. |
| [3] | Wong CM, Vichit-Vadakan N, Kan H, Qian Z. Public Health and Air Pollution in Asia (PAPA): a multicity study of short-term effects of air pollution on mortality. Environ Health Perspect. 2008 Sep;116(9):1195-202. |
| [4] | Le Tertre A, Lefranc A, Eilstein D, Declercq C, Medina S, Blanchard M, et al. Impact of the 2003 heatwave on all-cause mortality in 9 French cities. Epidemiology. 2006 Jan;17(1):75-9. |
| [5] | Barnett AG. Temperature and cardiovascular deaths in the US elderly: changes over time. Epidemiology. 2007 May;18(3):369-72. |
| [6] | Conti S, Meli P, Minelli G, Solimini R, Toccaceli V, Vichi M, et al. Epidemiologic study of mortality during the Summer 2003 heat wave in Italy. Environ Res. 2005 Jul;98(3):390-9. |
| [7] | Tong S, Ren C, Becker N. Excess deaths during the 2004 heatwave in Brisbane, Australia. Int J Biometeorol. 2010 Jul;54(4):393-400. |
| [8] | Stafoggia M, Forastiere F, Agostini D, Biggeri A, Bisanti L, Cadum E, et al. Vulnerability to heat-related mortality: a multicity, population-based, case-crossover analysis. Epidemiology. 2006 May;17(3):315-23. |
| [9] | Schwartz J. Who is sensitive to extremes of temperature?: A case-only analysis. Epidemiology. 2005 Jan;16(1):67-72. |
| [10] | Li G, Zhou M, Cai Y, Zhang Y, Pan X. Does temperature enhance acute mortality effects of ambient particle pollution in Tianjin City, China. Sci Total Environ. 2011 Mar 2. |
| [11] | Hastie TJ, Tibshirani RJ. Generalized additive models. Chapman and Hall,London. 1990. |
| [12] | Wood SN. Thin plate regression splines. Journal of the Royal Statistical Society:Series B. 2003;65(1):95-114. |
| [13] | Stafoggia M, Schwartz J, Forastiere F, Perucci CA. Does temperature modify the association between air pollution and mortality? A multicity case-crossover analysis in Italy. Am J Epidemiol. 2008 Jun 15;167(12):1476-85. |
| [14] | Qian Z, He Q, Lin HM, Kong L, Bentley CM, Liu W, et al. High temperatures enhanced acute mortality effects of ambient particle pollution in the "oven" city of Wuhan, China. Environ Health Perspect. 2008 Sep;116(9):1172-8. |
| [15] | Kan H, London SJ, Chen G, Zhang Y, Song G, Zhao N, et al. Season, sex, age, and education as modifiers of the effects of outdoor air pollution on daily mortality in Shanghai, China: The Public Health and Air Pollution in Asia (PAPA) Study. Environ Health Perspect. 2008 Sep;116(9):1183-8. |
| [16] | Dominici F, Samet JM, Zeger SL. Combing Evidence on Air Pollution and Daily Mortality from the 20 Largest US Cities: A Hierarchical Modelling Strategy. Journal of the Royal Statistical Society:Series A. 2000;163(3):263-302. |
| [17] | Nayha S. Environmental temperature and mortality. Int J Circumpolar Health. 2005 Dec;64(5):451-8. |
| [18] | Basu R, Samet JM. Relation between elevated ambient temperature and mortality: a review of the epidemiologic evidence. Epidemiol Rev. 2002;24(2):190-202. |
| [19] | Bouchama A, Knochel JP. Heat stroke. N Engl J Med. 2002 Jun 20;346(25):1978-88. |
| [20] | Schins RP, Lightbody JH, Borm PJ, Shi T, Donaldson K, Stone V. Inflammatory effects of coarse and fine particulate matter in relation to chemical and biological constituents. Toxicol Appl Pharmacol. 2004 Feb 15;195(1):1-11. |
| [21] | Fang SC, Cavallari JM, Eisen EA, Chen JC, Mittleman MA, Christiani DC. Vascular Function, Inflammation, and Variations in Cardiac Autonomic Responses to Particulate Matter Among Welders. American Journal of Epidemiology. 2009 Apr 1;169(7):848-56. |
| [22] | Wu S, Deng F, Niu J, Huang Q, Liu Y, Guo X. Association of heart rate variability in taxi drivers with marked changes in particulate air pollution in Beijing in 2008. Environ Health Perspect. Jan;118(1):87-91. |
| [23] | Daniels MJ, Dominici F, Samet JM, Zeger SL. Estimating particulate matter-mortality dose-response curves and threshold levels: an analysis of daily time-series for the 20 largest US cities. Am J Epidemiol. 2000 Sep 1;152(5):397-406. |
| [24] | Katsouyanni K, Touloumi G, Samoli E, Gryparis A, Le Tertre A, Monopolis Y, et al. Confounding and effect modification in the short-term effects of ambient particles on total mortality: results from 29 European cities within the APHEA2 project. Epidemiology. 2001 Sep;12(5):521-31. |
| [25] | Iniguez C, Ballester F, Ferrandiz J, Perez-Hoyos S, Saez M, Lopez A. Relation between temperature and mortality in thirteen Spanish cities. Int J Environ Res Public Health. 2011 Aug;7(8):3196-210. |
| [26] | Ren C, Tong S. Temperature modifies the health effects of particulate matter in Brisbane, Australia. Int J Biometeorol. 2006 Nov;51(2):87-96. |
| [27] | Samet J, Zeger S, Kelsall J, Xu J, Kalkstein L. Does weather confound or modify the association of particulate air pollution with mortality? An analysis of the Philadelphia data, 1973-1980. Environ Res. 1998 Apr;77(1):9-19. |
| [28] | Rainham DG, Smoyer-Tomic KE. The role of air pollution in the relationship between a heat stress index and human mortality in Toronto. Environ Res. 2003 Sep;93(1):9-19. |
| [29] | Pattenden S, Nikiforov B, Armstrong BG. Mortality and temperature in Sofia and London. J Epidemiol Community Health. 2003 Aug;57(8):628-33. |
| [30] | Ren C, Williams GM, Mengersen K, Morawska L, Tong S. Temperature enhanced effects of ozone on cardiovascular mortality in 95 large US communities, 1987-2000: Assessment using the NMMAPS data. Arch Environ Occup Health. 2009 Fall;64(3):177-84. |
| [31] | Roberts S. Interactions between particulate air pollution and temperature in air pollution mortality time series studies. Environ Res. 2004 Nov;96(3):328-37. |
| [32] | Yu W, Hu W, Mengersen K, Guo Y, Pan X, Connell D, et al. Time course of temperature effects on cardiovascular mortality in Brisbane, Australia. Heart. 2011 Apr 12. |
| [33] | Liu LQ, Breitner S, Pan XC, Franck U, Leitte AM, Wiedensohler A, et al. Associations between air temperature and cardio-respiratory mortality in the urban area of Beijing, China: a time-series analysis. Environmental Health. 2011 May 25;10. |
| [34] | Yu W, Vaneckova P, Mengersen K, Pan X, Tong S. Is the association between temperature and mortality modified by age, gender and socio-economic status? Sci Total Environ. 2010 Aug 1;408(17):3513-8. |
| [35] | Chung JY, Honda Y, Hong YC, Pan XC, Guo YL, Kim H. Ambient temperature and mortality: an international study in four capital cities of East Asia. Sci Total Environ. 2009 Dec 20;408(2):390-6. |
| [36] | Schwartz J. How sensitive is the association between ozone and daily deaths to control for temperature? American Journal of Respiratory and Critical Care Medicine. 2005 Mar 15;171(6):627-31. |