-
Paper Information
- Next Paper
- Paper Submission
-
Journal Information
- About This Journal
- Editorial Board
- Current Issue
- Archive
- Author Guidelines
- Contact Us
Public Health Research
p-ISSN: 2167-7263 e-ISSN: 2167-7247
2012; 2(1): 1-7
doi: 10.5923/j.phr.20120201.01
Analysing of Medical Schemes Complaints by Means of Parametric Proportional Hazard Frailty Models
 Abstract
 Reference
 Full-Text PDF
 Full-Text HTML
Michael Mncedisi Willie
Research and Monitoring, Council for Medical Schemes, Private Bag X34, Hatfield, 0028, South Africa
Correspondence to: Michael Mncedisi Willie , Research and Monitoring, Council for Medical Schemes, Private Bag X34, Hatfield, 0028, South Africa.
| Email: |  |
Copyright © 2012 Scientific & Academic Publishing. All Rights Reserved.
The objective of the current study was to assess factors that affect the response time to complaints by members of medical schemes. In order to assess these factors, survival analysis techniques were employed, in particular the frailty models. Parametric proportional hazards frailty models controlled for factors such medical scheme type, nature of complaint and analyst effect. The model revealed that scheme type (p<0.0001), nature of complaint (p<0.0001) and the analyst effect (p=0.0004) were significant factors in response time to complaints. The study also revealed that parametric proportional hazards frailty models provide a viable ways to study relationships of factors that affect resolution or response time. Furthermore, this research work emphasizes the importance of studying the root cause or nature of complaints as it relates to resolution time and understanding business processes that cause complaints. Lastly, results obtained in this work highlight the need for better understanding of the relations between the complaints handling staff characteristics and response time to complaints, as the latter is critical in deploying appropriate resources to effectively improve on response time.
Keywords: Survival analysis, Kaplan-Meier, Tarone-Ware test, Proportional Hazard Model
Cite this paper: Michael Mncedisi Willie , "Analysing of Medical Schemes Complaints by Means of Parametric Proportional Hazard Frailty Models", Public Health Research, Vol. 2 No. 1, 2012, pp. 1-7. doi: 10.5923/j.phr.20120201.01.
Article Outline
1. Introduction
- Corporate organisations and many government agencies consider complaints a significant organisational resource or component of the organisation as this impact on their reputation (Stauss and Schoeler, 2004). Studies have shown that handling consumer complaints well can be a critical part of turnaround strategy (George et al., 2007). For example well- handled complaints can sustain and strengthen consumer loyalty and the company`s image as a leader and also promote public confidence in the government (Blodget et al., 1995; Homburg and Fürst, 2005; Kitapci and Dortyol, 2009). In contrast, if complaints are not promptly resolved, either the complainants or the organisation that handles them can have adverse consequences. Negative effects on corporate organisations or public institutions include cumulative erosion of confidence in the organisation government agencies (Bennett, 1997), as complaints that are not resolved promptly or adequately can adversely affect consumers. When the medical scheme or health insurance company fails to pay the provider for services rendered, the worst case scenario is that the provider would hand over the account to attorneys. In some instances, the member may even be ‘blacklisted’. Although code of conduct for providers does not permit ‘blacklisting’ consumers for non-payment of a medical bill by the medical scheme, they may still be listed on a dedicated list that is distributed among general practitioners only, this is accordance with the South African Medical Association code of ethics. To be listed on the dedicated list for non-payment of medical bill does not affect consumers' general credit worthiness. However, civil action may be taken against patients who do not pay their accounts (SAMA). This may result in attorneys demanding payment from members and in certain cases affect the member’s assets or property attached by the sheriff for the non- payment (Willie, 2011). One of the key principles that underlie any complaint handling system is responsiveness, and this is the ability of the corporate organization or government agency to respond promptly to issues raised by complainants (George et al., 2007). As each complaint is different in terms of its complexity and nature, the quality of the resolution process is paramount (ACSQHC, 2005). Complaint handling system must be responsive to the needs of all complainants, which requires proper training of staff, adequate resources for the complaint unit or function, and constant review and improvement of the system (Commonwealth Ombudsman, 2009). Human resources staff handling complaints is the single most important resource in the complaints handling process (Goergeet al., 2007; NSW Ombudsman, 2006; Johnston and Mehra, 2002). The office of the short-term insurance reported turn-around time to the resolution of complaints as the biggest single challenge they faced (OSTI, 2010), as the average turnaround time to complaints was 225 days, well above to the set benchmark of 180 days.The objective of the current paper was to asses factors that affect complaint resolution processes in medical schemes by means of frailty models. Willie (2011) employed traditional analysis survival techniques to assess complaints in medical schemes, focusing on the Cox survival analysis. The current study extends that work by employing parametric survival frailty models to account for unobserved heterogeneity in the complaints (Vaupel et al., 1979; McGilchrist and Aisbett, 1991). In its simplest form, a frailty is an unobserved random proportionality factor that modifies the hazard function of an individual or of related individuals (Wienke, 2003). According to Wienke, the frailty approach is a statistical modelling concept that aims to account for heterogeneity caused by unmeasured or unobserved covariates. In this work, heterogeneity in the types of complaints from medical scheme members is assumed, as is its role in the complaint response time.
2. Methods
- The current retrospective study included all complaints that were evaluated by the CMS complaints handling department. The analytic time horizon was from 03 January 2009 to 31 March 2011. When the complaints department/unit received complaints, they were allocated to one of the eight analysts, who would determine their validity. All valid complaints were subsequently classified into three categories—Unpaid Account, Benefits, and Other (Willie, 2011) to lessen redundancy, as we found that some categories were analogous. The three main categories applied to severity of complaints are also reflected in Table 1. The outcome variable was defined as time taken to resolve a complaint, measured in days. Covariates included factors such scheme type (Open vs. Restricted scheme), characteristic of the analyst resolving complaints (Analyst1-Analyst8), and the type of complaint (also defined as severity of complaint).The data was censored on 26 February 2011, as some of the complaints were not resolved. Median survival time to resolve complaint was reported, identified as the number of days that took the analyst to resolve half of the complaints. Kaplan-Meier plots were used to assess median response time to complaints on selected covariates (Kaplan and Meier, 1985; Machin et al., 2006). We employed the Tarone-Ware test to assess Kaplan-Meier plots of different groups (Tarone and Ware, 1977), as Prentice (1978) illustrated that the Tarone-Ware test is always superior to the Log-rank or Wilcoxon test (Tarone-Ware can also be used for comparing more than two groups (Zaman and Pfeiffer, 2011). Parametric Accelerated Failure Time Models were fitted into the data and classical fit statistics were used to select the best model that fit the data. We conducted all the analysis using SAS software, version 9.2 (SAS Institute Inc. Cary, NC). Statistical significance tests were conducted at α = 0.05, parameter estimates and the 95% confidence intervals (CIs) were also reported.
3. Results
3.1. Descriptive Statistics and Median Response Time to Complaints
- The sample size considered for this study comprised of 7572 complaints from open and restricted schemes’ principal members. However, with 6019 complaints, open schemes predominated, compared to restricted schemes with only 1553 complaints (Chi-square = 740, p < 0.0001) respectively. The sub-sample analysis of the 2009 complaints revealed a un-weighted average number of 266.5 complaints per month from open schemes, which was significantly higher than the average number associated with restricted schemes (65.8).
|
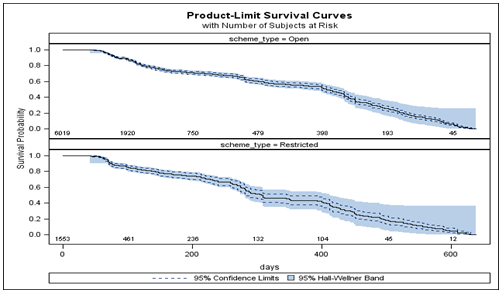 | Figure 1. Survival probabilities for open and restricted schemes complaints |
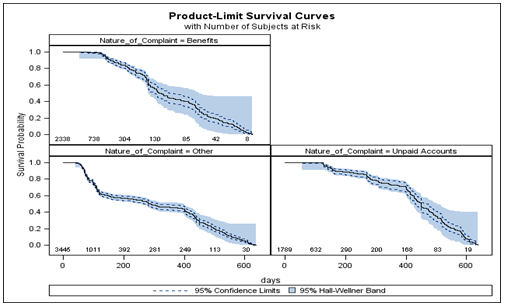 | Figure 2. Survival probabilities for the nature of complaints |
|
3.2. Modelling Factors that Affect Complaint Resolution
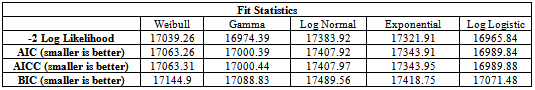
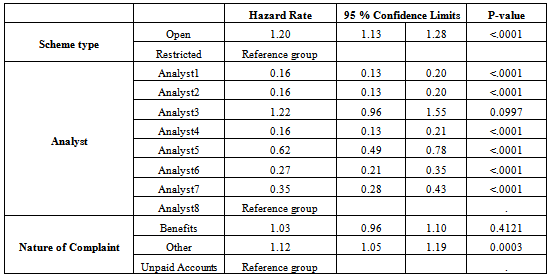
- Table 2 depicts fit statistics for five distributions that were integrated into to the data. Results obtained indicate that Log Logistic Proportional Hazard Model was better fit for the model (Klein and Moeschberger, 1997). Results obtained from fitting this model in the data are presented in Table 3. Wald Chi-squared tests produced for the Log-Logistic model indicate that nature of complaint, scheme type and the analyst characteristics were significant factors to resolution of complaints with p < 0.0001 for scheme type and analyst and p = 0.0004 for the nature of complaints. Figure 3 depicts the graph of the Kaplan-Meier estimates for the cumulative hazard versus the Log-Logistic regression model estimate. The figure further illustrates that the selected parametric model is a better fit for predicting response time to complaints (Hosmer and Lemeshow, 1999).The Log-Logistic Proportional Hazard Model presented in Table 3 revealed scheme type (HR = 1.20: 95% CI 1.13- 1.28), analyst effects, and nature of complaint as a significant attributes to complaint response time. There were no significant differences between the effect of Benefits related types of complaints and the reference group (HR = 1.03: 95% CI 0.96-1.10). However, there were significant differences between the complaints classified as ‘Other’ and the reference group (HR=1.12: 95% CI 1.05-1.19), which comprised of complaints associated with unpaid account type. Results also illustrated that characteristics of Analyst1 (HR = 0.16: 95% CI 0.13-0.201, Analyst2 (HR = 0.16: 95% CI 0.13-0.20), Analyst4 (HR = 0.16: 95% CI 0.13-0.21), Analyst5 (HR = 0.62:95% CI 0.49-0.78), Analyst6 (HR = 0.27: 95% CI 0.21-0.35) and Analyst7 (HR = 0.35: 95% CI 0.28-0.43) relative to the reference group (Analyst8) were significantly associated to response time to complaints. In contrast, characteristics of Analyst3 were not significantly associated to response time to complaints (HR = 1.22: 95% CI 0.96- 1.55). Further exploration on the predictor variables, in particular analyst characteristics, is beyond the scope of this research article.
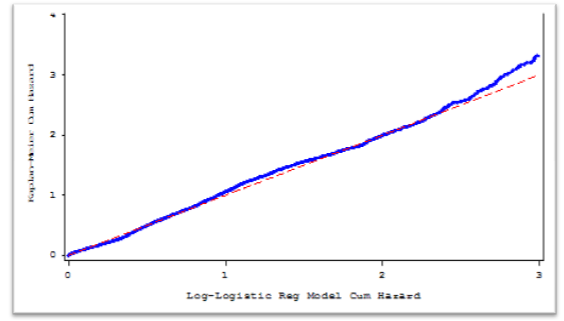 | Figure 3. Kaplan Meier estimates of the cumulative hazard versus the log-logistic regression model estimate |
|
4. Discussion
- There are significant differences between open and restricted schemes in terms of demographics, number of beneficiaries, and benefit options design. On average, open schemes offer five benefit options, whereas restricted schemes offer two benefit options. Thus, with more than ten benefit options to choose from, it is difficult for the members to compare these products and see which offers best value for money. However, as most restricted schemes offered no more than two benefit options, they are easier to understand (Willie, 2011). The current study revealed an average of four complaints raised by open scheme members for every single complaint filed by members of restricted schemes. CMS annual report further illustrates this phenomenon, whereby, when controlling for beneficiaries, the top ten most complained about schemes are open schemes (CMS News, 2010). Severity of complaints was a deterministic factor to the response time in medical schemes. Complaints classified as ‘Other’ took longer to resolve than the other two categories. Dominant category of complaints received was the ‘Other’ category, with median response time of 70 days, which was slightly higher than response time to complaints associated with Benefits and Unpaid account types with median response time of 51 and 58 days, respectively. These results are also consistent to those obtained through the Log-Logistic proportional hazard model (HR = 1.2; 95% CI: 1.05-1.19), indicating that complaints classified as ‘Other’ as likely to take the longest to resolve. Response time to complaints, as illustrated in the current study, seems to be within the target response time of 120 days, as stipulated in the Medical Schemes Act for a decision and ruling to be made on the complaint (Medical Schemes Act, 1998). This study also illustrated challenges faced by the complaints handling department with regards to complaints raised by members of schemes. Complaints have adverse repercussions to members if they are not promptly resolved. When the medical scheme fails to pay the provider for services rendered, the likelihood is that some providers would hand over the account to attorneys. In some instances, when the membership of the scheme is cancelled due to fraud or some misunderstanding, or where members’ Benefits are capped or limited, members may be required to pay medical fees from their own pocket (CMS News, 2011). There were characteristic differences in the manner in which some of complaints were allocated to the analysts, which somehow contributed to the complaint response time. Some analysts responded to complaints more quickly than others did. These data showed that Analyst1, Analyst2 and Analyst4 resolved more that 50% of the complaints in 39, 40, and 41 days respectively, compared to Analyst5, Analyst6 and Analyst7 with median response time of 135, 75 and 104 days respectively. Median response time to complaints for Analyst3 and Analyst8 could not be computed as these analysts took longer to resolve complaints, out of the eight analysts resolving complaints, five had a median response time below the target response time of 120 days, as stipulated in the Medical Schemes (Medical Schemes Act 131, 1998). These results are a significant improvement on our previous study (Willie, 2011) where data was only restricted to complaints evaluated only at one point. The current study illustrated that adequate resources, in terms of human capital, are critical to effectively and efficiently responding to complaints. The results obtained here are encouraging in that, for monitoring and performance evaluation purposes, they can help easily identify key improvement areas with regards human resources within the complaints handling department. These results are consistent with the best practice literature stipulating that complaints must be investigated by an employee who has the right attributes and sufficient competency (Goerge et al., 2007; NSW Ombudsman, 2006; Johnston and Mehra, 2002; Zairi, 2000).
5. Conclusions
- Managing complaints effectively is vital to enhancing service delivery in the medical schemes industry and other related fields. A more proactive and inclusive approach is critical in this regard and this is determined by factors that impact directly on complaints resolution process. The objective of this paper was to assess factors that affect complaints in the medical schemes industry in South Africa. It was found that complexity of the complaint was an important factor associated with the response time. Moreover, some complaints took longer to resolve than others, which was largely attributed to the nature of such complaints. The study also identified the importance of identifying key issues in terms of human resources in order to provide more training and support where necessary. Furthermore, this study illustrates the importance of identifying the root cause or nature of complaints, as it relates to resolution time as well as understanding business processes that cause complaints. Lastly, the results obtained in this work highlight the importance of understanding the relations between the complaints handling staff characteristics and the response time in that response to complaints should not be limited to just managing the complaint, but should also be about managing the staff performance. The latter is critical in deploying appropriate resources to effectively improve on response time.
6. Limitations of the Study
- The current study significantly improved the understanding of factors that affect complaint resolution. Although similar number of covariates was considered as in our previous study (Willie, 2011), a considerably larger sample size improved the results. Even though frailty models employed in this study take into account unobserved characteristics of the model, further exploration of other covariates that affect complaint resolution is advised. The study did not investigate other key demographic aspects of the complainants, such as ethnicity, gender, and age. The current study also omitted a comprehensive analysis on the unresolved complaints in order to assess factors associated with these outcomes. Thus, a detailed analysis of the nature of complaints is required, in particular with respect to the complaints classified as ‘Other’. Finally, the present study did not include detailed analysis of the complaints procedure or the post-complaint behaviour resolution process.
ACKNOWLEDGEMENTS
- The author would like to thank Khayalethu Mvulo of the Council for Medical Schemes, Carl Lombard, of Medical Research Council, Jacob Majakwara of Wits University and MaupiLetsoalo of the Tshwane University of Technology for discussions and valuable input in concluding this research work.