-
Paper Information
- Paper Submission
-
Journal Information
- About This Journal
- Editorial Board
- Current Issue
- Archive
- Author Guidelines
- Contact Us
Physical Chemistry
p-ISSN: 2167-7042 e-ISSN: 2167-7069
2020; 10(1): 1-4
doi:10.5923/j.pc.20201001.01

Study of Particle Size in Natural and Technological Water Suspensions Using Photon Cross Correlation Spectroscopy with Nanophox
 Abstract
 Reference
 Full-Text PDF
 Full-text HTML
G. Oyungerel 1, G. Batdemberel 2, G. Munkhsaikhan 2
1School of Mathematics and Natural Sciences, Mongolian State University of Education, Ulaanbaatar, Mongolia
2Department of Physics, School of Applied Sciences, Mongolian University of Science and Technology, Ulaanbaatar, Mongolia
Correspondence to: G. Munkhsaikhan , Department of Physics, School of Applied Sciences, Mongolian University of Science and Technology, Ulaanbaatar, Mongolia.
| Email: |  |
Copyright © 2020 The Author(s). Published by Scientific & Academic Publishing.
This work is licensed under the Creative Commons Attribution International License (CC BY).
http://creativecommons.org/licenses/by/4.0/

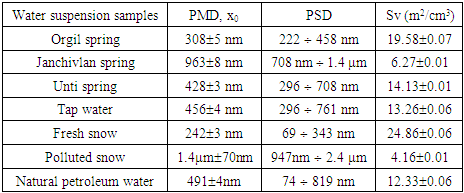
Photon cross-correlation spectroscopy (PCCS) has become a novel light-scattering technique allowing for precise measurement of particle sizing and size distribution of suspensions colloids. The size and distribution of particles of suspensions including natural and technological water samples are studied by Photon Cross-Correlation Spectroscopy. The mean diameter, the size distribution range, the specific surface area of the particles in natural spring named Janchivlan are found to be 963±8 nm, 708 nm-1.4 µm and 6.27±0.01 m2/cm3, respectively. On the other hand, these values corresponding to the particles in snow samples from the industrial zone of Ulaanbaatar city are determined to be 1.4 µm±70 nm, 947 nm-2.4 µm and 4.16±0.1 m2/cm3. It can be assumed that high values in the mean diameter of natural spring and snow samples are related to composition of minerals and PM2.5 and PM10 particles.
Keywords: Dynamic light scattering, Gaussian symmetry, Cumulative distribution
Cite this paper: G. Oyungerel , G. Batdemberel , G. Munkhsaikhan , Study of Particle Size in Natural and Technological Water Suspensions Using Photon Cross Correlation Spectroscopy with Nanophox, Physical Chemistry, Vol. 10 No. 1, 2020, pp. 1-4. doi: 10.5923/j.pc.20201001.01.
Article Outline
1. Introduction
- Natural nanoparticles in water occur everywhere. These particle sizes are ranged 1-100nm and very mobile. Drinking water contains millions of particles, as well as large particles containing 1-100nm nanoparticles. The particles contained in drinking water are inorganic and inorganic materials. Organic particles are plant and animal waste generated by soil, mountain rocks, and human activities [1,2].The direct effects of these particles on human health are still unknown. However, it has been found that these particles have a definite effect on water quality, as they carry various toxins and bacteria into their own organisms [3].In addition, nanoparticles play an important role in the environmental system and have a dual role in reducing the concentration of toxic metals and supporting the metal in biochemical reactions.There are a few studies that have performed in this field. In this study we have determined the size and distribution of nanoparticles in selected natural and technological water suspension samples.
2. Experimental Methodology and Techniques
2.1. Photon Cross Correlation Spectroscopy
- In this study we have encountered a requirement to measure particles in suspension samples. The Photon Cross Correlation Spectroscopy (PCCS) is a novel technique allowing for the simultaneous measurement of particle size in suspension and emulsion. It is a powerful extension of photon correlation spectroscopy (PCS) also known as dynamic light scattering (DLS). PCS was first used to measure small particles in dilute systems and poorly scattering materials [4]. In this technique, a laser beam is incident on the solution in which small particles in suspension undergo Brownian motion. The speed of a particle is measured can be converted into a hydrodynamic diameter using the Stokes-Einstein equation [5]. However the PCS is restricted to highly diluted suspension due to limitation of non-interacting spherical particles and single scattered light, while PCCS is allowed to measure particle size in high concentration suspension. The principle of PCCS is based on the “Brownian motion” of molecules, as described before. It realizes two identical PCS - measurements in the same measurement volume. The two signals correlate only with regard to the single scattered light from the particles in the measurement volume. In this technique a laser beam is split into two partial beams and focused with help of a lens into the sample vial. The crossing region forms the measurement volume. Two photo-detectors receive the scattered light under the scattering angle θ (See Figure 1). The time resolved cross correlated intensities measured by the photo-detectors [6].
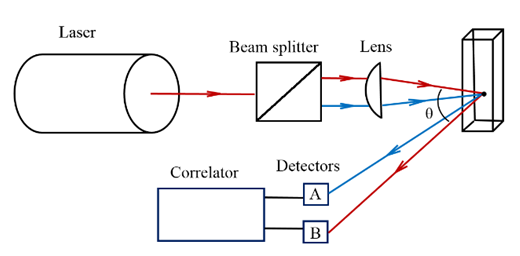 | Figure 1. Setup of photon cross correlation spectroscopy |
2.2. Sample Preparation
- The following 7 natural and technological water samples were selected as the subject of the study. These samples include: 3 mineral water samples from Mongolian springs named Orgil, Zhanchivlan and Unti; water sample from the tap; water samples from clean snow from Terelj National Park area and snow from downtown of Ulaanbaatar city. Last one is a natural petroleum water sample. To carry out the experiments, a certain volume was extracted from the water sample to methylated alcohol to create a suspension environment. Particles of suspension were filtered by a 39 μm filter to remove large particles. Then 20 ml of suspension was added to 80 ml of distilled water. For the preparation of a homogeneous suspension an Ultrasonic Cell Disruptor KS-900F was used. Samples were sonicated for 15 minutes.
2.3. Particle Size Distribution Analysis
- Particle size and size distribution analysis of suspensions have been done on NNLS mode of the PCCS (Sympatec GmbH, Germany). Samples are placed into a transparent cuvette (Eppendorf UvetteR, Sympatec Item No.NZ0020) with dimensions 12.5x12.5x3.6mm, volume of 50-2000μl. Then the cuvette is placed in a thermostat bath with filled clean water filtered by a 0.22μm filter. This experimental system adopted 632.8nm laser light. The laser passes through the beam splitter and is split into two partial beams to the measured particle suspension through the beam splitter. Two light beams scattered from the suspension as the irradiation of the laser. The scattered intensity was obtained by two photodetectors in different locations but with the same scattering angle as shown in Figure 1. The scattering intensity obtained by correlator is processed by correlator and computer for cross-correlation operation to obtain the particle size information. The measuring temperature is 25°C, and the scattering angle is 90°. The data was calculated by WINDOX 5 software that supports all Photon Cross-correlation data [7].
3. Results and Discussion
- Particle size and cumulative distribution of different water suspensions are depicted in Figure 2.
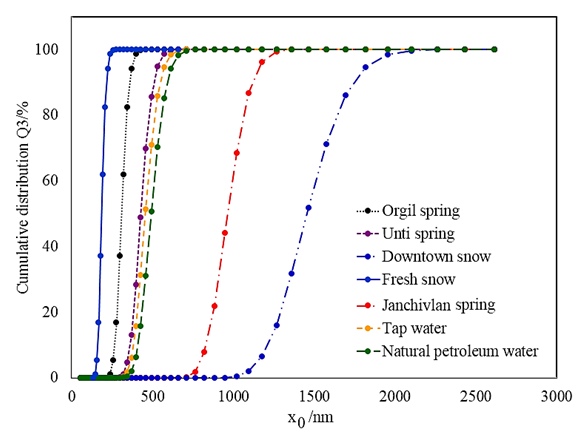 | Figure 2. Particle size and cumulative distribution of water suspension samples |
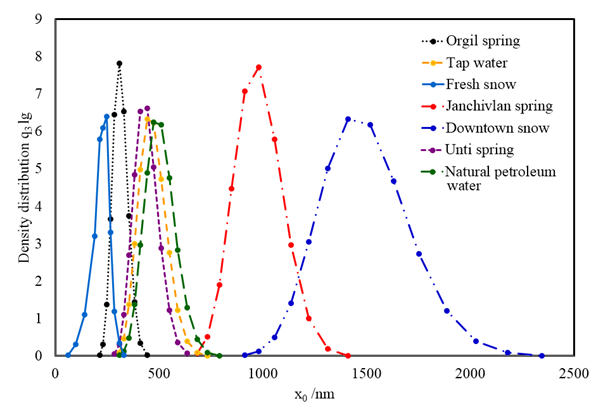 | Figure 3. Particle size and density distributions of water suspension samples |
|
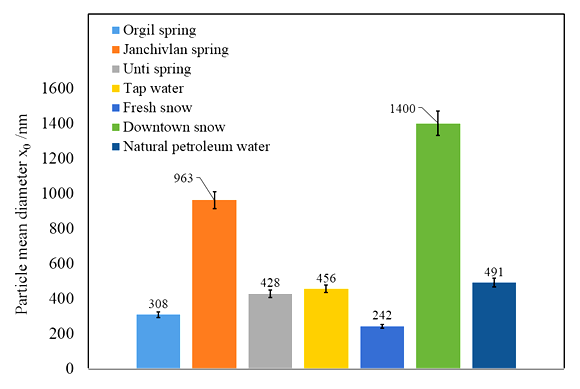 | Figure 4. Particle mean diameter plot of different water suspensions |
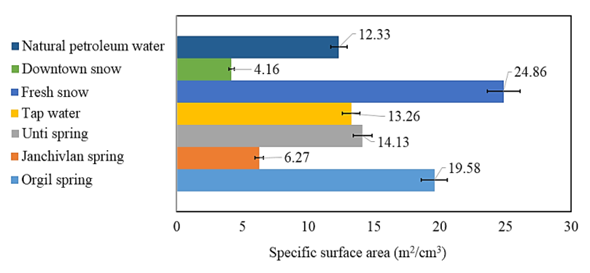 | Figure 5. Particle specific surface area of water suspensions |
4. Conclusions
- Photon Cross-correlation Spectroscopy employed in this work appears to be reliable for particle size and size distribution analysis of suspension samples. Significant differences have been observed in fresh and polluted snow suspensions. The result of fresh snow suspension shows a presence of ultrafine and fine particles. It has been found that the polluted snow suspension contains fine and coarse particles. This is probably accompanied by the existence of urban air pollutants. Also, the higher value in particle mean diameter was observed in water suspension from the Janchivlan spring sample that is significantly larger compared with other spring suspension samples. It can be related to composition of minerals in this sample.
ACKNOWLEDGEMENTS
- The authors are grateful to the Science and Technology Foundation of Mongolia for providing the financial support covering the research work.