-
Paper Information
- Paper Submission
-
Journal Information
- About This Journal
- Editorial Board
- Current Issue
- Archive
- Author Guidelines
- Contact Us
Physical Chemistry
p-ISSN: 2167-7042 e-ISSN: 2167-7069
2017; 7(4): 87-97
doi:10.5923/j.pc.20170704.02

Adsorption Kinetics and Isotherms of Methylene Blue by Geopolymers Derived from Common Clay and Rice Husk Ash
 Abstract
 Reference
 Full-Text PDF
 Full-text HTML
F. M. Maingi, H. M. Mbuvi, M. M. Ng’ang’a, H. Mwangi
Department of Chemistry, Kenyatta University, Nairobi, Kenya
Correspondence to: H. M. Mbuvi, Department of Chemistry, Kenyatta University, Nairobi, Kenya.
| Email: |  |
Copyright © 2017 Scientific & Academic Publishing. All Rights Reserved.
This work is licensed under the Creative Commons Attribution International License (CC BY).
http://creativecommons.org/licenses/by/4.0/

With the onset of industrialization mankind has witnessed various environmental issues in the society. Industrialization has not only brought development and prosperity but eventually disturbed the ecosystem. It is currently estimated that 1.1 billion people in the world lack access to enhanced clean water supplies. Consequently, pursuance of sustainable materials and technologies for wastewater remediation is critical. Use of adsorbents for wastewater treatment is preferable due to their simplicity and cheap materials involved. Geopolymers are synthesized hydrothermally using alumina and silica which possesses amorphous surface for use as adsorbents. There is adequate information and reports in literature that indicate clay contain alumina and silica. Similarly, findings have shown that rice husk ash contains substantial amounts of silica. This work reports synthesis of geopolymers GP-1, GP-2 and GP-3 prepared by using different SiO2/Al2O3 ratios and consequently equilibrium and kinetics behaviour of adsorption of methylene blue. The geopolymers were characterized using FT-IR, EDS, XRD and SEM. Geopolymer adsorbents were subjected to methylene blue batch sorption experiments that indicated the adsorption of MB increased with increased Si/Al ratio in geopolymers. The adsorption isotherms were described by Langmuir, Freundlich, Temkin and Sips isotherms. Data for adsorption of MB onto geopolymers fitted best in Sips adsorption model. Kinetic studies showed that Pseudo -second order model were more suitable than the Pseudo- first order model in explaining the kinetics of adsorption.
Keywords: Geopolymers, Characterized, Adsorption,Isotherms, Kinetics
Cite this paper: F. M. Maingi, H. M. Mbuvi, M. M. Ng’ang’a, H. Mwangi, Adsorption Kinetics and Isotherms of Methylene Blue by Geopolymers Derived from Common Clay and Rice Husk Ash, Physical Chemistry, Vol. 7 No. 4, 2017, pp. 87-97. doi: 10.5923/j.pc.20170704.02.
Article Outline
1. Introduction
- Dye removal from wastewater is a topic of great interest in water pollution which is a serious environmental catastrophe. Methylene blue is the most soluble dye in water in general, used for typography of cotton and tannin, tincturing leather, antiseptic and medical purposes [1]. Acute exposure to the dye may cause increased heartbeat, vomiting, shock, jaundice, cyanosis, quadriplegia, and tissue necrosis in humans [2]. Diverse methods such as reverse osmosis, ion exchange, membrane filtration, chemical precipitation, and adsorption have been generally used to remove dyes from wastewater [3]. Moreover among the removal methods, adsorption is one that sees increasing interest due to its potential efficiency, low energy expenditure, high preference at molecular level, easy manipulation, and ability to separate various chemical compounds [4]. Agricultural waste products such as rice husk and common clay form important low cost sources of raw materials for geopolymer synthesis. During the last decade, considerable research efforts have been directed towards the development of inorganic geopolymers due to their wide range of potential applications [5]. It is a geosynthesis reaction that chemically integrates minerals that depend on the ability of the aluminium ion (6-fold or 4-fold coordination) to induce crystallographic and chemical changes in a silica backbone. Therefore, in the approach to replace the conventional adsorbents, geopolymers are a new strategy for decontamination of pollutants from wastewater [6, 7]. The main aim of this study was to investigate the feasibility of adding value to geopolymers by using them as adsorbents for the removal of methylene blue (MB) from aqueous solution and studying their equilibrium and transient behaviour of the adsorption process.
2. Materials and Methods
2.1. Chemicals and Reagents
- Sodium hydroxide was used as an alkaline activator during geopolymer synthesis. Methylene blue was used in the adsorption experiments and all reagents were of analytical grade supplied by Sigma Aldrich.
2.2. Clay and Rice Husk Materials
- The clays used in this research were obtained from Kakamega, Kuresoi and Molo in Kenya. They were transported to Kenyatta university laboratory, washed with distilled water to remove humus and then air dried for two weeks. Calcination was done at 700°C in a furnace Eisklo type LN 120 and later ground to fine powder using grinder model Reutsch SR 200. Calcined clay was used as a source of Al2O3. Rice husk obtained from a rice processor in Mwea region in Kenya was washed with distilled water for 20 min at room temperature, using a liquid/solid (L/S) ratio of 15 L: 1kg. The solids were allowed to settle and dried at 60°C in an oven. Leaching was then carried out with 3% HCl solutions, using reflux boiling apparatus for 2 hours. The solids, after separation by settling and filtration, were washed with water, to remove the acid retained, and then dried at 60°C. The calcination was done at 600°C for 2 hours using a muffle furnace (Eisklo type LN 120) to obtain ash which was used as a source of silica [8].
2.3. Preparation of Geopolymer
- Rice husk ash was mixed with 100 mL of 8M NaOH solution in the liquid/solid (L/S) ratio of 5 L: 1Kg and stirred with the aid of a magnetic stirrer for 15 minutes to form alkaline activator. According to [9], geopolymerization reactions occur at a high rate when the alkaline activator contains soluble silicates compared to the use of only alkaline hydroxides. 50g of clay powder was added to the mixture and thoroughly stirred using a ball mill for a period of 5 hours. The resultant pastes were cast into pestles and vibrated for 5 minutes to release the air bubbles. The pastes were then cured at 80°C for 12 hours to start the condensation reaction. Upon removal from the molds, the resultant pastes were placed in an oven at 200°C for 12 hours in order to complete the polycondensation. The procedure adopted from [7] above.with slight modifications.
2.4. Characterization of Geopolymers
- Characterization of the synthesized geopolymers was done before the adsorption experiments using FT-IR model (IRTracer 100 Shimadzu) for determination of their molecular vibrations, X-ray diffractometer (XRD) model (D2 Phaser Bruker) for crystal structure determination, X-ray fluorescence (XRF) model S1 Titan in order to determine the chemical composition of principal components and SEM model Zeiss Evo LS 15 for microstructure analysis [7].
2.5. Adsorption Experiments
2.5.1. Effects of pH on Adsorption of MB Dye
- Experiments were conducted by varying pH from 4 to 12 while maintaining all other experimental conditions constant. The pH adjustments were done using procedure given by [10] 25 mL pH adjusted containing 25 mg/L of MB in monocomponent system was placed in 100 mL stoppered plastic bottles. 0.1000 g (weight with analytical precision) of geopolymer materials was put into each of the five stoppered bottles. The bottles were placed in a thermostatic electric shaker model SHR-2D at 120 rpm, maintained at 25°C ± 1 and shaken continuously for one hour. All experiments were carried out in triplicates and mean average values were used for further calculations. The reagent bottles were successively withdrawn after shaking and the supernatant solutions separated by filtration using whatman no 41 filter papers. The MB was analyzed by means of UV-Vis (model Specord 200 Shimadzu) at 664 nm by using calibration curve.
2.5.2. Effect of Residence Time on Kinetic Studies of Adsorption of MB Dye
- The impact of resident time was investigated by varying time from 20 to 80 minutes. 0.1000 g of geopolymer material was taken in 25 mL of 25 mg/L MB solution in each of a series of adsorption bottles. The bottles were placed in a thermostatic electric shaker at 120 rpm, maintained at 25°C ± 1. After adsorption time was completed, the adsorbents were removed from the solution by filtration and the concentration of residual MB in each solution determined using UV-Vis spectrophotometer.
2.5.3. Effect of MB Concentration on Equilibrium Studies
- The adsorption of MB by geopolymer adsorbents was investigated by varying initial MB concentrations from 25 to 50 mg/L while maintaining all other experimental conditions constant. 0.1000 g of geopolymer material was placed in each of the four bottles. 25 mL of concentrations 25, 30, 35, 40, and 50 mg/L of MB was put in bottles and placed in an electric shaker at 120 rpm for one hour. The authenticity during concentration measurements was ensured by repeating the experiments three times under identical conditions.
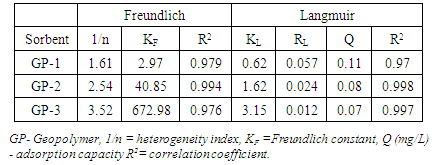
2.6. Adsorption Isotherms
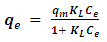
2.6.1. Langmuir Isotherms
- The Langmuir equation [11] used in this study is given as equation (1)
 | (1) |
2.6.2. Freundlich Isotherm
- The Freundlich isotherm [12] model can be described as (2)
 | (2) |
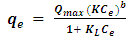
2.6.3. Sips Model
- A general form of Sips isotherm equation for lead adsorption can be written as in equation (3) [14].
 | (3) |
3. Results and Discussion
3.1. Chemical Composition of Raw Materials
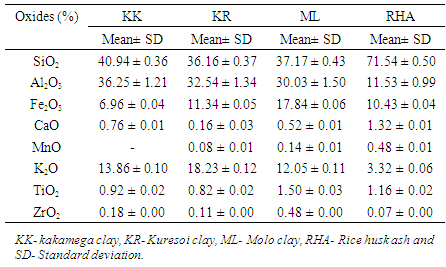
- Energy dispersive X-ray spectrometer model EDXR (800HS Shimadzu) was used to divulge the chemical compositions of raw materials as tabulated in table 1. The main oxide constituents of the raw materials Kakamega clay (KK), Kuresoi clay (KR), Molo clay (ML) and rice husk ash (RHA) were silica and alumina as shown in table 1. Percentage of SiO2 was 40.94, 36.16, 37.17 and 71.54%, Al2O3 was 36.25, 32.54, 30.03 and 11.53%, Fe2O3 was 6.96, 11.34, 17.84 and 10.43, and K2O was 13.86, 18.23, 12.05 and 3.312% for KK, KR, ML and RHA respectively. All the other oxides were below 1% in all parent materials with the exception of TiO2 in ML and RHA which was at 1.50 and 1.16% respectively. Calcined clays contained high percentages of silica and alumina as compared to other oxides. This results correlates well with results reported by [15] on oxide analysis of kaolinite clay.
|
3.2. Chemical Composition of Geopolymer
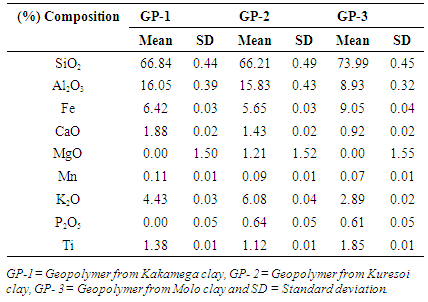
- The framework of geopolymers was analyzed using an XRF model S1 titan. The main components of the geopolymer materials GP-1, GP-2 and GP-3 were silica and alumina as shown in table 2. Percentage of SiO2 was 66.84, 66.21 and 73.99% and that of Al2O3 was 16.05, 15.83 and 8.93% for GP-1, GP-2 and GP-3 respectively. Other elements found included Fe at 6.42, 5.65 and 9.05%, K2O at 4.43, 6.08 and 2.89%, CaO at 1.88, 1.43 and 0.92% and Ti at 1.38, 1.12 and 1.85% for GP-1, GP-2 and GP-3 respectively. All the other elements were below 1% in all geopolymers with the exception of MgO in GP-2 which was at 1.21%. The results on composition of geopolymers are in agreement with results obtained by [7] showing that the main ingredients of geopolymer are silica and alumina.
|
3.3. FTIR Spectra Analysis on Geopolymers
- Spectroscopic analysis was carried out by using Fourier Transform Infra-Red Analysis (FT-IR).FT-IR absorption spectra were recorded in the 4000–400 cm−1 range using a Nicolet system, IRTracer model Shimadzu, equipped with a DLaTGS (deuterated, L-alanine doped triglycine sulfate with potassium bromide windows) detector. The spectrum of each sample represents an average of 32 scans.Figure 1 shows the IR bands of the geopolymers adsorbents. Broad bands were observed in all geopolymers at ~ ~3400 cm-1 for the (–OH, H–O–H) stretching mode. Another spectral band at around 1410 cm-1 appeared in all the geopolymer samples. This band is characteristic of the asymmetric O-C-O bonds of CO32- stretching mode, indicating the presence of sodium bicarbonate that is suggested to occur due to the atmospheric carbonation of a high alkaline NaOH aqueous phase, which is diffused on the geopolymeric materials surface [16, 17]. The strong peak at ~979 cm-1 is associated with Al-O and Si-O asymmetric stretching vibrations and which is the fingerprint of the geopolymerization [18] observed in GP-1, GP2 and GP-3. In the region of 775-650 cm-1, the bands are due to symmetrical vibrations of tetrahedral groups (TO4). The peak at~460 cm-1 is assigned to in-plane bending of Al-O and Si-O linkages [18] and appears in all graphs.
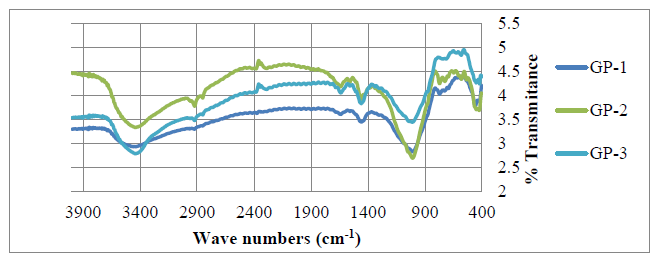 | Figure 1. FT-IR spectra for GP-1, GP-2, and GP-3 |
3.4. Scanning Electron Microscope (SEM) Microstructure Analysis of Geopolymers
- The particle micromorphology and the microstructure of the cured geopolymers were examined using Zeiss Evo LS 15 scanning electron microscope (SEM) at an accelerating voltage of 5 kV.A more porous microstructure with voids is clearly observed in these SEM micrographs. All SEM images (GP-1, GP-2 and GP-3) divulged that the particles of geopolymer are irregularly shaped but very compact. In these geopolymer materials, the continuity of the mass of reaction product appears like a layer of viscous fluid, suddenly frozen indicating the complete polymerization process. Cavities surroundings in figure GP-2 consists of tubular vitreous network [19]. EDS analysis of gel showed that gel mostly consists of the phases containing Na-Si-Al in the bulk region suggesting the formation of silicate-activated gel by polymerization throughout the inter particles volume [20] [21]. The major elements (e.g., Na, Al, Si, and O) make up geopolymers; Ca, Mg and Fe are also present and have influence in geopolymerization process [22]. These remnants (Fe, Ca, K, Mg) obviously represent the calcined clay and rice husk ash phases, which for various reasons, did not dissolve during alkali activation. [21] suggested that during alkaline activation these remnants may even disperse through the gel. This correlates with the published works of [16].
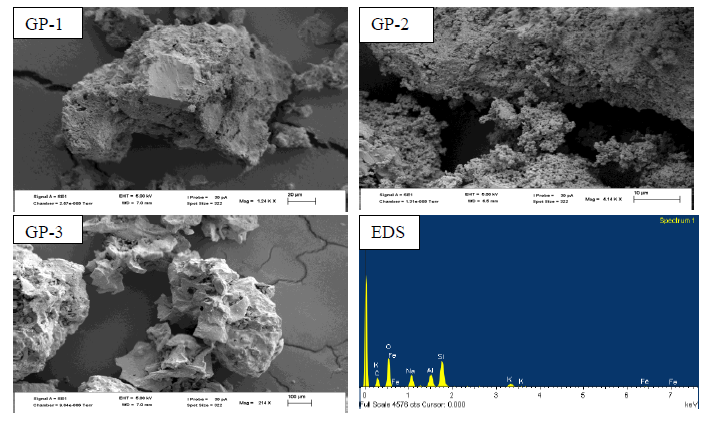 | Figure 2. SEM micrographs for GP-1, GP-2, GP-3 and energy dispersive spectroscopy (EDS) spectrum |
3.5. XRD Characterization of Geopolymers
- The geopolymers were analyzed using XRD (D2 Phaser Model-Bruker) and Cu Kα radiation at 40 kv and 40 mA with a graphite monochromator (λ=1.5418 À) at a scanning speed of 3s/ step and 0.02° per 2 θ step within diffraction angle ranging From 5 To 70° (2θ). An XRD micronizing mill (Glen Creston Company) was used to grind the samples so that they completely passed through sieve fisher brand test stainless aperture 250 μm microns. Data integration and evaluation was done using EVA software. The diffraction patterns of geopolymeric materials GP-1, GP-2 and GP-3 are as shown in figure 3.Figure 3 shows the XRD diffraction patterns obtained for three geopolymer samples with different Si/Al ratios GP-1, GP-2 and GP-3. Various crystalline phases were identified which included quartz (SiO2), Albite (NaAlSi3O8), Vermiculite (Mg,Fe,Al)3((Al,Si)4O10)(OH)2.4H2O), Microcline (KAlSi3O8), Analcime (NaAlSi2O6·H2O) and Natrite (Na2CO3) among others in GP-1 and GP-2. The minor phases in were natrite and heulandite in GP-1 and natrite and calcite in GP-2. The main crystalline phase in GP-3 was quartz and minor phase were natrite and microcline. The formation of carbonates was attributed to improper sealing of the samples, which allows atmospheric CO2 to react with the sodium-rich pore solutions [23]. Quartz is recognizable in all samples and with percentages phase composition of (28.4, 30.3, and 12.5%) for geopolymers GP-1, GP-2 and GP-3 respectively. It is the main crystalline phase present in calcined clay, and the rice husk ash. A broad hump between 18-36° (2θ), existed in the three types of geopolymers, which is the characteristic reflection of amorphous geopolymers [24, 25].
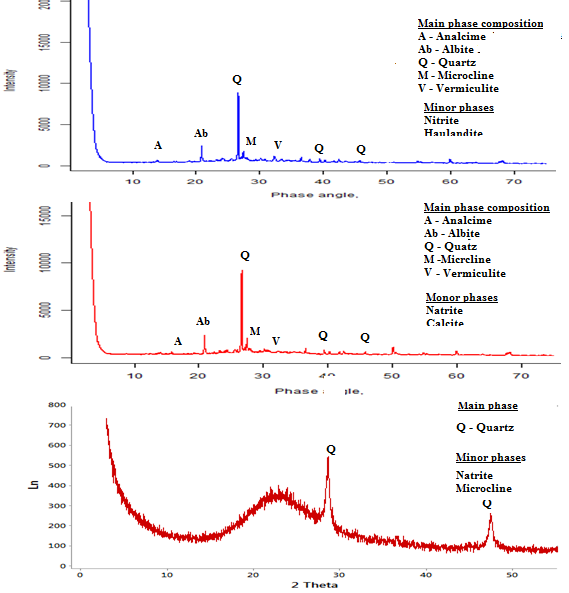 | Figure 3. Diffraction patterns for GP-1, GP-2 and GP-3 |
3.6. Adsorption Studies of MB onto Geopolymers
3.6.1. Point of Zero Charge (pHzpc) Studies of Geopolymers
- The point of zero charge (pHpzc) is an important factor that determines the linear range of pH sensitivity and then indicates the type of surface active centers and the adsorption ability of the surface [26]. The graph of pH final vs pH initial was plotted as shown in figure 4. The intersections of the curves with the straight line are known as the end points of the pHpzc, and these values were 8.7, 10.2 and 9.7 for geopolymers GP-1, GP-2 and GP-3 respectively. At higher solution pH (pH ≥ pHpzc), the geopolymers possibly negatively charged and enhance adsorption of the positively charged dye cations through electrostatic forces of attraction [27]. A pH 10 was selected for adsorption and kinetic experiments.
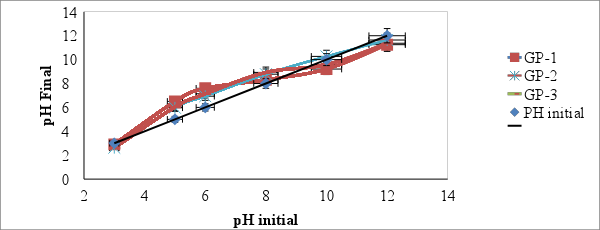 | Figure 4. A graph of pH final of geopolymer adsorbent against pH initial (Adsorbent dose = 0.1g, Volume of distilled water= 100 m/L, Room temperature 25°C ± 2 and Shaking speed of 120 rpm) |
3.6.2. Effect of pH on MB Adsorption
- The effects of solution pH on MB adsorption with geopolymer were investigated and the results are illustrated in figure 5, which shows that elevation of pH leads to increase of percentage uptake of MB onto geopolymer. When the pH of aqueous solution was increased from (4 to 10), mean percentage uptake increased from 54.34 ± 0.11, to 74.77% ± 0.10 and then dropped on increasing pH to 12 for GP-1. On using GP-2 the removal of MB increased from 58.02 ± 0.26 to 75.75% ± 0.29 when pH was varied from (4 to 12). Similarly, higher mean percentages removal of MB from solution were observed (89.74% ± 0.12) at pH (8) and then dropped on employing GP-3. Lower adsorption of MB at acidic pH (pH ≤ pHpzc) was due to the presence of excess H+ ions competing with the cation groups on the dye for adsorption sites. These results can be attributed to the effect of the solution pH on the charge of reactive groups within geopolymer surface which in turn, makes it more effective to adsorb dye in alkaline pH and increase the ionized sites [28]. Increasing pH to above point zero charge resulted in a decrease in adsorption uptake, presumably because of the deprotonation of the surface groups and protonation of the acidic functional groups of dye, leading to an electrostatic repulsion between adsorbent and adsorbate [29]. Similar observations on effect of pH were reported for adsorption of dyes indicating that the adsorbent has a net positive charge on its surface [30].
 | Figure 5. Effect of pH on adsorption of MB onto geopolymers (Temperatures= 25°C, shaking speed = 120 rpm and contact time = 60 minutes) |
3.6.3. Effect of Residence Time on Adsorption of MB
- Figure 6 shows the graph of mean percentage removal of MB against contact time. The mean percentage removal increased from 18.51 ± 0.37 and 99.35% ± 0.01.to 85.03 ± 0.31 and 99.60% ± 0.01 for adsorbents GP-1 and GP-3 respectively when contact time was varied from 20 to 60 minutes and thereafter dropped slightly on increase of contact time to 80 minutes. For adsorbents GP-2 the MB uptake increased from 62.27 ± 0.30 to 86.49% ± 0.29 for contact time between 20 and 80 minutes. The results suggest that, adsorption takes place rapidly at the initial stage on the external surface of the adsorbent followed by a slower internal diffusion process, which may be the rate determining step [31, 32]. In addition, the fast adsorption at the initial stage may be due to the fact that a large number of surface sites are available for adsorption but after a lapse of time, the remaining surface sites are difficult to be occupied [33]. This agrees with the report of other investigators in literature [34, 35].
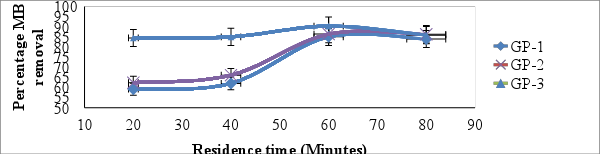 | Figure 6. Effect of residence time on adsorption of MB onto geopolymer (shaking speed of 120 rpm, pH = 10.0, temp= 25°C ± 1 and concentration of MB = 25mg/L) |
3.6.4. Effect of Initial Concentration on Adsorption of MB
- The effect of the initial dye concentration factor depends on the immediate relation between the dye concentration and the available binding sites on an adsorbent surface [36]. Figure 7 shows the effect of initial dye concentration. The percentage of uptake of MB as indicated by figure 7 decreased from 73.68 ± 0.73, 80.31 ± 0.11 and 88.19% ± 0.15 to 50.49 ± 0.77, 61.79 ± 0.24 and 65.49% ± 0.40 when concentration of MB was varied from (25-50mg/L) for GP-1, GP-2 and GP-3 respectively. At low concentration, there will be unoccupied active sites on the adsorbent surface, and when the initial dye concentration increases, the active sites required for adsorption of the dye molecules will disappear [37]. However, the increase in the initial dye concentration will cause an increase in the loading capacity of the adsorbent and this may be due to the high driving force for mass at a high initial dye concentration [38]. Similar trend on effect of initial dye concentration on adsorption of MB has been reported by [39].
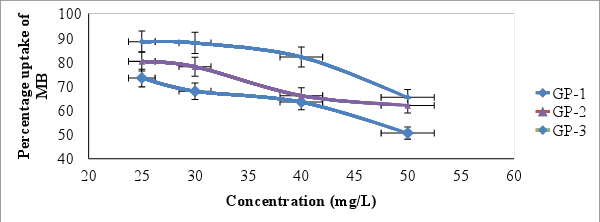 | Figure 7. Effect of initial concentration on adsorption of MB onto geopolymer (Contact time=60 minutes, shaking speed of 120 rpm, pH = 10.0, temp = 25°C ± 1 and adsorbent dose = 0.1g/25mL) |
|
|
|
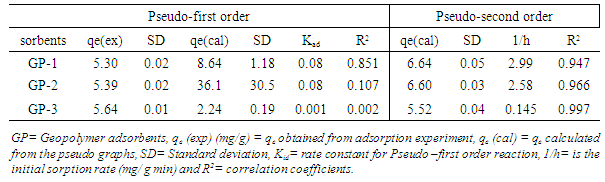
3.7. Kinetic Studies
- It is important to be able to predict the rate at which contaminants are removed from aqueous solution in order to design adsorption treatment plant [49]. Figure 8 shows the pseudo- second order kinetic model plots for adsorption of MB at various contact time at room temperature. From the relationship kd and qe were determined from the intercept and slope of the plot.
 | Figure 8. Pseudo- second order kinetic model for adsorption of MB by geopolymers |
|
3.7.1. Deduction from the Shape of the Intraparticle Diffusion Plot
- A non-regression coefficient plot by fitting experimental data to equation 4
 | (4) |
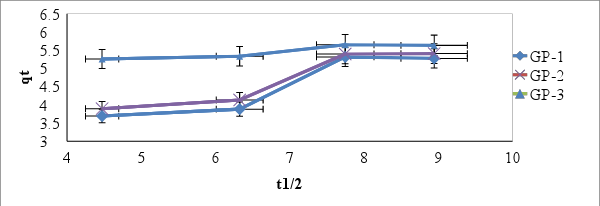 | Figure 9. Intra-particle diffusion plot for the adsorption process (geopolymer dosage = 4 g/L, Time 20-80 minutes, [MB] = 25 mg/L, T = 298 K, pH 10 and V = 0.025 L) |
4. Conclusions
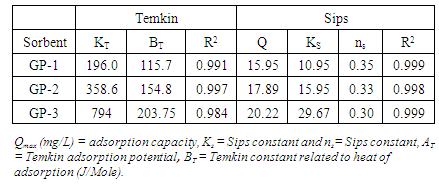
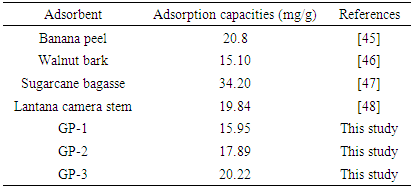
- Based on the adsorption data obtained, GP-3 worked better in adsorption of MB than their geopolymer analogues. Geopolymers GP-1 and GP-2 and GP-3 had adsorption capacities of 15.95, 17.89 and 20.22 mg/g respectively which propose them as potential adsorbents for MB. Increase in Si/Al ratio in geopolymers caused by use of different clays increased the ability to remove MB from synthetic wastewater. The experimental data was found to fit the Sips adsorption model better than the other models and hence was used for analyzing the efficiency of adsorption of the MB onto geopolymers. The correlation coefficients for the second-order kinetic model obtained were greater than those of Pseudo-first order and therefore indicating that adsorption system studied belonged to the pseudo-second order kinetic model. This study has shown that Kenyan common clays that have very few economic endeavors may be good raw materials for synthesis of geopolymers for adsorption application on MB from contaminated water.
ACKNOWLEDGEMENTS
- The authors would like to express great thanks to Kenyatta University.