-
Paper Information
- Paper Submission
-
Journal Information
- About This Journal
- Editorial Board
- Current Issue
- Archive
- Author Guidelines
- Contact Us
Physical Chemistry
p-ISSN: 2167-7042 e-ISSN: 2167-7069
2017; 7(3): 55-62
doi:10.5923/j.pc.20170703.01

Development and Validation of a Modern and Stability-Indicating Method for the Quantification of Ceftriaxone Sodium in Powder for Injection by Infrared Spectroscopy
 Abstract
 Reference
 Full-Text PDF
 Full-text HTML
Mariana Teixeira da Trindade, Hérida Regina Nunes Salgado
Department of Pharmaceutics, School of Pharmaceutical Sciences, Universidade Estadual Paulista, Araraquara, SP, Brazil
Correspondence to: Mariana Teixeira da Trindade, Department of Pharmaceutics, School of Pharmaceutical Sciences, Universidade Estadual Paulista, Araraquara, SP, Brazil.
| Email: |  |
Copyright © 2017 Scientific & Academic Publishing. All Rights Reserved.
This work is licensed under the Creative Commons Attribution International License (CC BY).
http://creativecommons.org/licenses/by/4.0/

This paper proposed the validation of a modern and useful analytical method for the quantification of ceftriaxone sodium in powder for injection, using Fourier-transform infrared (FT-IR) transmission spectroscopy. This technique has great advantage because it does not use organic solventes and it is in accordance with the International Conference on Harmonisation guidelines (ICH), contributing to the reduction of the generation of waste of organic solvents by the industry and minimizing the impact of its activities on the environment. The method was quantified by measuring the absorbance of the band corresponding to the carbonyl present in the drug molecule, in the region between 1800 and 1700 cm-1, showing to be linear, accurate, precise, selective and robust. It was linear over the concentration range of 0.4-1.2 mg with correlation coefficient of 0.9983 and limits of detection and quantification of 0.016 and 0.049 mg, respectively. The validated method is able to quantify ceftriaxone sodium powder for injection preparation, it is an environmentally-friendly and low cost method and can be applied in the routine quality control of the pharmaceutical industry.
Keywords: Ceftriaxone sodium, Validation, Infrared, Quantitative, Green Method
Cite this paper: Mariana Teixeira da Trindade, Hérida Regina Nunes Salgado, Development and Validation of a Modern and Stability-Indicating Method for the Quantification of Ceftriaxone Sodium in Powder for Injection by Infrared Spectroscopy, Physical Chemistry, Vol. 7 No. 3, 2017, pp. 55-62. doi: 10.5923/j.pc.20170703.01.
Article Outline
1. Introduction
- Since 1970 cephalosporins are among the most potent and widely used anti-infective agentes [1]. Ceftriaxone sodium (Figure 1) is a semi-synthetic antibiotic belonging to the class of the third generation cephalosporins. It is administered only by the parenteral route and has the capacity to overcome the blood-brain barrier [2-4].
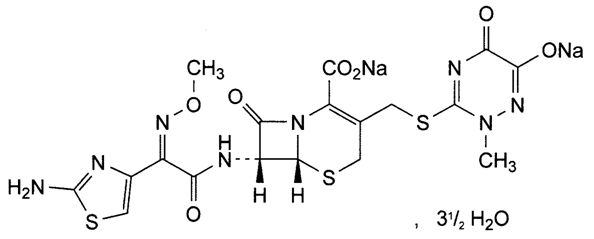 | Figure 1. Chemical structure of ceftriaxone disodium hemieptahydrate (CAS 104376-79-6) [5] |
|
2. Material and Methods
2.1. Chemicals
- The chemicals used were ceftriaxone sodium reference chemical substance (RCS) (assigned purity 99.6%) and ceftriaxone sodium in powder for injection, each flask contains 1.193 g of ceftriaxone sodium, equivalent to 1.0 g of ceftriaxone, it has no excipients, this was kindly donated by the pharmaceutical company ABL Antibióticos do Brasil® (Cosmópolis, SP, Brazil).The potassium bromide (KBr) (Neon®, Brazil) was of analytical grade and was used for the preparation of pellets. Before use, the KBr was ground and dried at 120°C until constant weight.
2.2. Instrumentation and Analytical Conditions
2.2.1. Equipments
- The FT-IR spectrometer (Shimadzu®, Kyoto, Japan, IR Prestige-21 model) was used and the spectral region was consisted of 4000 - 500 cm-1 at intervals of 2 cm-1. After obtaining the IR spectrum and with the assistance of the IR Solution software, quantitative analysis was carried out in the spectral region between 1800 and 1700 cm-1, related to a carbonyl band of the ceftriaxone sodium molecule, and this band had its height analyzed in terms of absorbance.
2.2.2. Obtaining the Analytical Curve
- Equivalent amounts of 0.4, 0.6, 0.8, 1.0 and 1.2 mg of ceftriaxone sodium RCS were previously diluted in KBr (1:10 w/w) and after diluted in KBr again to obtain sufficient quantities of 150 mg of pellets. The powders were mixed until a homogeneous mixture was obtained, this mixture was submitted to mechanical pressing for 10 minutes to obtain translucent pellets.
2.2.3. Preparation of Ceftriaxone Sodium RCS Pellets
- Aliquots of powder equivalent to 0.8 mg of ceftriaxone sodium RCS (8.0 mg diluting 1:10 in KBr) were properly homogeinized in 142 mg potassium bromide, to form pellets of 150 mg. The determinations of the substance were performed in triplicate absorbance.
2.2.4. Preparation of Ceftriaxone Sodium Sample Pellets
- The contents of twenty vials of ceftriaxone sodium in powder for injection solution were mixed. From this mixture, amounts of 0.8 mg of ceftrixone sodium (8.0 mg of the 1:10 dilution in potassium bromide) were taken and well homogenized with 142 mg of potassium bromide, comprising the total pellet weight of 150 mg. The determinations were performed in triplicate.
2.3. Method Validation
- The method was validated following ICH specifications showing accuracy, linearity, precision, robustness, selectivity, detection limit and quantitation limit.
2.3.1. Selectivity
- Selectivity was evaluated by the analysis of the spectra of the ceftriaxone sodium RCS and powder for injection (Figure 2) and also through the analysis of the ceftriaxone sodium in powder for injection was performed by submitting the photolytic degradation by exposure of the diluted sodium ceftriaxone sample (1:10) to UVC light (254 nm) for 3 hours (Figure 3) and thermal degradation by exposing the diluted sample (1:10) in an oven at 105°C for 2 hours (Figure 4).
2.3.2. Linearity
- To assess linearity of the method, five doses of ceftriaxone sodium RCS (0.4, 0.6, 0.8, 1.0 and 1.2 mg) were used. The method was evaluated by linear regression analysis, which is calculated by the square minimum method and statistical analysis was by ANOVA. The method was performed on three different days.
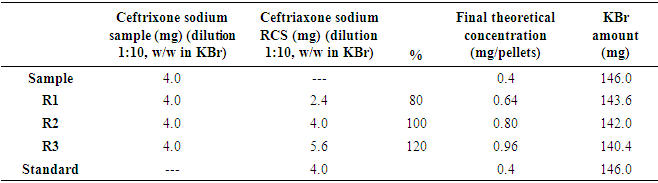
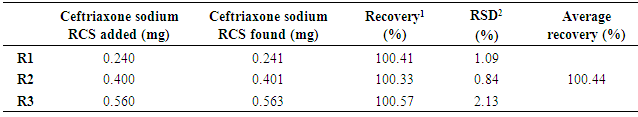
2.3.3. Accuracy
- Accuracy was attained by the recovery assay, to which was added a known amount of standard in known quantity of sample [35]. The method was performed at three different levels (R1, R2, R3), being prepared in triplicate on three different days. Table 1 shows the preparation of the pellets for the recovery test method.
2.3.4. Precision
- Precision was evaluated respecting both repeatability (intraday) and intermediate precision (interdays). The intraday precision was evaluated by the preparation and the analyses of six pellets ceftriaxone sodium at a concentration of 0.8 mg/150 mg on the same day and at about the same working conditions. Intermediate precision (among analysts) was assessed by performing the assay for a second analyst under the same experimental conditions. Six replicates at a concentration of 0.8 mg/150 mg were prepared and assayed. At the end of testing, the standard deviations of the measurements were calculated.
2.3.5. Robustness
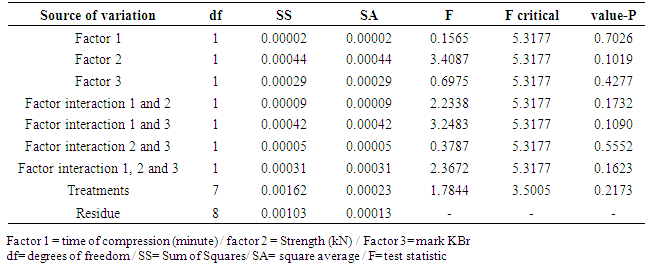
- The robustness of the method was evaluated with the purpose of showing the reliability of the analysis concerning small variations in its working parameters, that is, the validity of the method is maintained even with small variations in its working conditions. The following parameters were varied: compression of the pellets time two minutes down and above the usual working time compression; compressive strength, ranging four kN down and above the usual working compression and potassium bromide trade mark. The obtained responses were evaluated according to factorial design 23 and Table 3 shows the parameters of the evaluation of the robustness by factorial design 23 of the analytical method for ceftriaxone sodium analysis.
2.3.6. Detection and Quantitation Limits
- The detection (LOD) and quantification (LOQ) limits were calculated based on the intercept standard deviation and the curve slope [35]. Three different curves were performed to obtain the data necessary to calculate. The values were calculated by the equations 1 and 2.
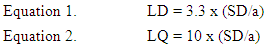 Where:a = inclination of the analytical curve SD = intercept of standard deviation
3. Results and Discussion
- Quality Control ensures the safety and efficacy of pharmaceutical products. The validation of analytical and bioanalytical methods is indispensable in the process of good manufacturing practices.The search for methods with low environmental impact is a tendency to be applied in routine analysis in the pharmaceutical industry, the replacement of analytical methods that employ organic solvents for others that do not employ them are viable alternatives for this objective [36]. Infrared spectroscopy is an excellent alternative because it does not use organic solvents, requires minimal or no pre-treatment of the sample and it is a suitable technique for drugs with solubility problems, once they can be prepared in the form of pellets [25-34].Therefore the quantification of ceftriaxone sodium samples is very important for conducting pharmacokinetic studies, bioavailability, bioequivalence and consequently for the therapeutic monitoring of this substance. In this paper, a single reagent was chosen in order to obtain a low cost, simple and environmentally friendly infrared spectroscopy method for quantification of this medicine.The method can be quantified by measuring the absorbance of the band corresponding to the carbonyl present in the drug molecule, in the region between 1800 and 1700 cm-1, this band is specific and useful in the determination of ceftriaxone sodium in powder for injection, the values of these bands/peaks were provided in absorbance presenting accuracy, linearity, precision, robustness and selectivity.
3.1. Selectivity
- The selectivity was determined by the overlap of the spectra of sodium ceftriaxone RCS and powder for injection as shown in Figure 2, the band used for the quantification is highlighted showing no interferences in the spectrum obtained for the quantification of the drug. Also it was determined by photolytic degradation, presenting a decrease of 19.82% of the band referring to carbonyl after 3 hours of exposure to the diluted ceftriaxone sodium in powder for injection (Figure 3). In the thermal degradation, there was a decrease of 19.88% of the band referring to carbonyl after 2 hours (Figure 4). It is noted that there was no presence of new bands in the spectro, only the decrease of the existing ones.
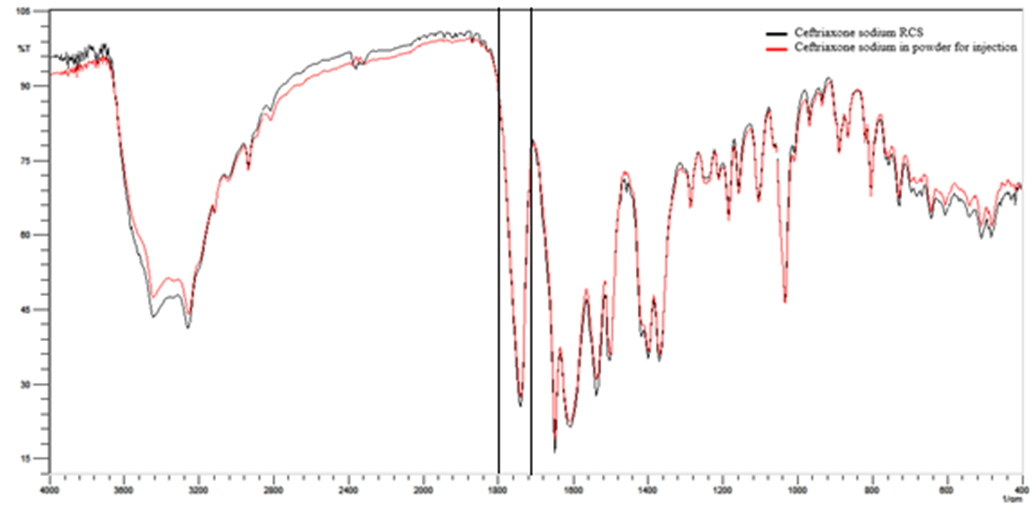 | Figure 2. Overlap absorption spectra in the infrared region ceftriaxone sodium RCS and powder for injection with the band used for quantification |
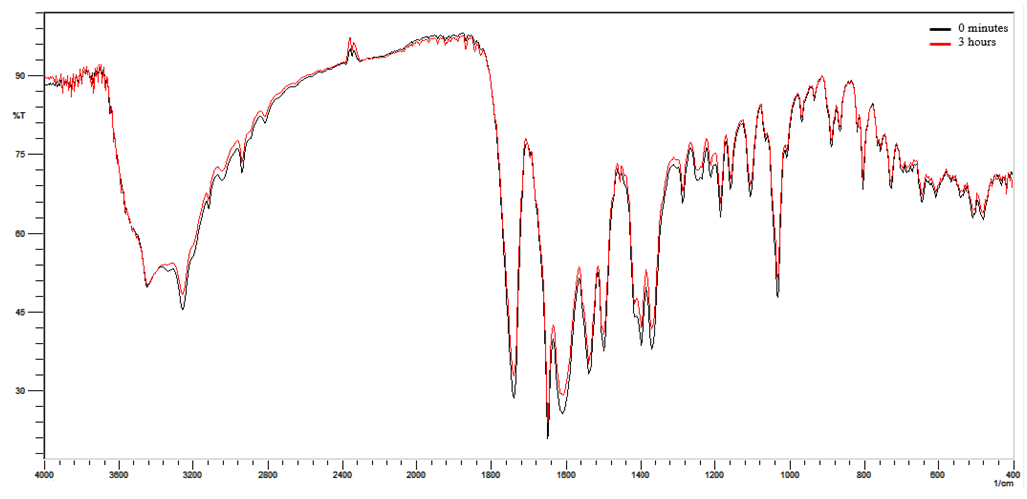 | Figure 3. Overlap absorption spectra in the infrared region of the photolytic degradation of ceftriaxone sodium at times zero and 3 hours |
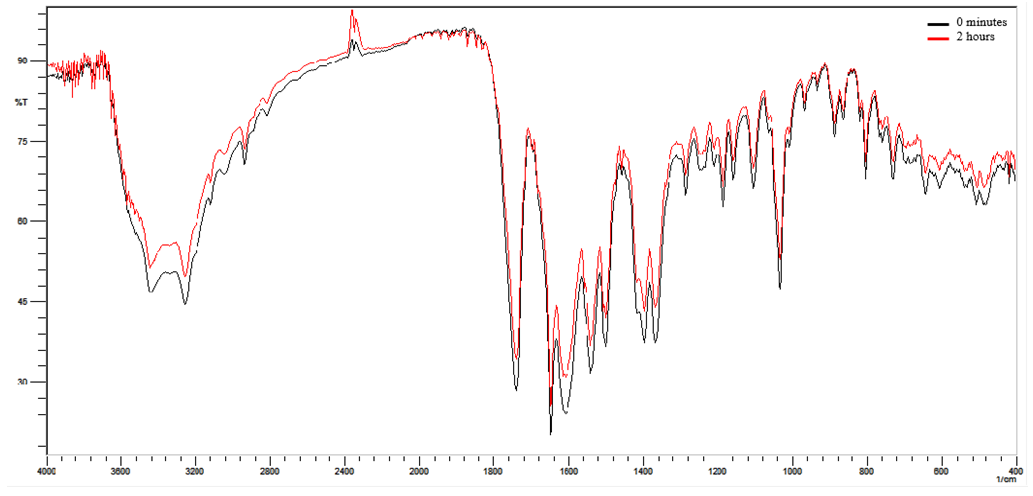 | Figure 4. Overlap absorption spectra in the infrared region of the thermal degradation of ceftriaxone sodium at times zero and 2 hours |
3.2. Linearity
- The analytical curve was generated on three consecutive days by plotting the main absorbance values of spectra in the region of 1800-1700 cm-1 in relation to concentrations between 0.4 to 1.2 mg/pellet as shown in Figure 5 along with the error bars (in red). The correlation coefficient (R) was of 0.9983, ANOVA was used for statistical analysis and the calculation showed (p <0.05), F calculation (3.54) lower than F critical (3.71), determining excellent linearity of the method, fact that reinforces the good linearity of the method.
3.3. Precision
- The precision of the method was evaluated by parameters: intra-day or repeatability, inter-days or intermediate (among analysts). The results were expressed by the relative standard deviation (R.S.D.).The repeatability showed provided the R.S.D. value of 2.64%. Intermediate precision was demonstrated on different days by two analysts, table 2 shows the comparative analysis and statistical findings.
|
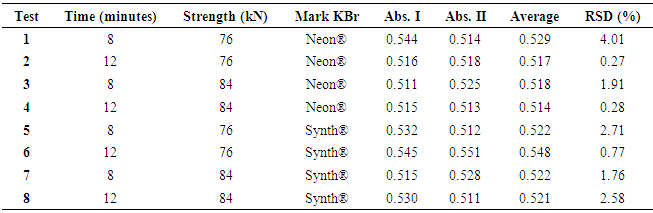
3.4. Robustness
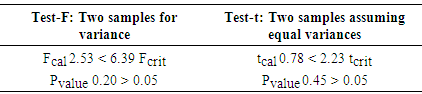
- The robustness of the method was evaluated through the absorbance values found through eight trials. Sixteen translucent pellets with concentration referring to 0.8 mg ceftriaxone sodium were read (Table 3). Then, the analysis of variance for each contrast was determined then the analysis of variance was determined for each contrast (Table 4), it is noticed that the changes did not present significant interference in the proposed method, where all values (p-value) are greater than (0,05), showing the appropriate robustness of the method.
|
|
|
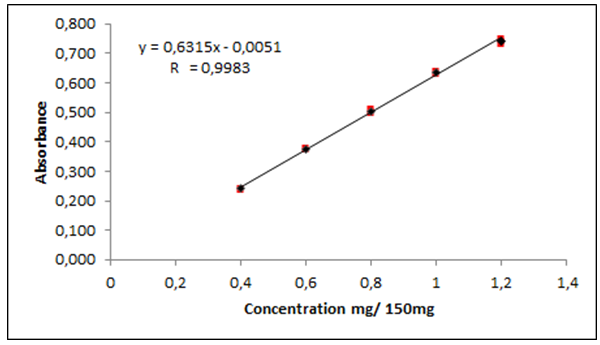 | Figure 5. Graphical representation of the calibration curve of ceftriaxone sodium by spectroscopy method in the infrared region |
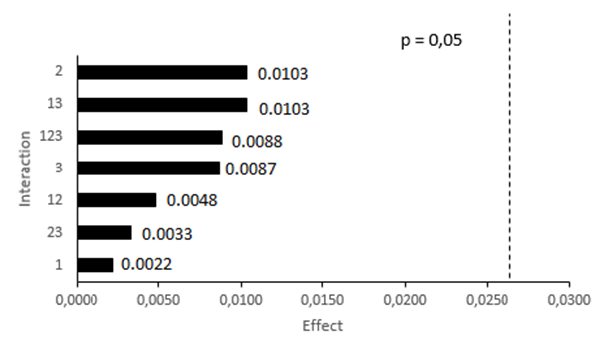 | Figure 6. Pareto graph of the interactions of the robustness variable for the spectroscopy method in the infrared region |
3.5. Accuracy
- The accuracy of the method is in accordance with fixed limits of 98.0 to 102.0%, as shown in table 5, indicating the adequacy of the method developed in the quantification of the ceftriaxone sodium in powder for injection.
3.6. Detection and Quantitation Limits
- The value found for the detection limit was 0.016 mg and the quantitation limit was 0.049 mg. These values indicate the reliability of the method for the determination and quantification of ceftriaxone sodium in powder for injection.
4. Conclusions
- The method presented for the quantification of ceftriaxone in powder for injection presented linearity, selectivity, precision, accuracy, robustness and adequate limits of detection and quantification in concentrations ranging from 0.4 to 1.2 mg. The proposed method used only one reagent with minimum procedures of sample preparation, encouraging its application in the routine analysis and contributing to minimize the environmental impact of pharmaceutical industries. Therefore, the validated method is an acceptable alternative method for quality control and can be easily applied in the routine analysis of ceftriaxone sodium.
ACKNOWLEDGMENTS
- The authors thank the pharmaceutical company ABL Antibióticos do Brasil® (Cosmópolis, SP, Brazil), for providing ceftriaxone in powder for injection. This work was supported by PACD-FCFAr-UNESP (Araraquara, Brazil), CNPq (Brasilia, Brazil) and CAPES (Brasilia, Brazil).