-
Paper Information
- Paper Submission
-
Journal Information
- About This Journal
- Editorial Board
- Current Issue
- Archive
- Author Guidelines
- Contact Us
Physical Chemistry
p-ISSN: 2167-7042 e-ISSN: 2167-7069
2017; 7(2): 42-53
doi:10.5923/j.pc.20170702.03

Toward Visible-Light Responsive Photocatalysts: Nano-Potassium Doping Zinc Oxide (K-ZnO) for Degradation of 2-Naphthol
 Abstract
 Reference
 Full-Text PDF
 Full-text HTML
Taha M. Elmorsi
Chemistry Department, Faculty of Science, Al-Azhar University, Cairo, Egypt
Correspondence to: Taha M. Elmorsi, Chemistry Department, Faculty of Science, Al-Azhar University, Cairo, Egypt.
| Email: |  |
Copyright © 2017 Scientific & Academic Publishing. All Rights Reserved.
This work is licensed under the Creative Commons Attribution International License (CC BY).
http://creativecommons.org/licenses/by/4.0/

Photocatalytic properties of photocatalysts depend generally on techniques employed for preparing nanostructures and doping processes. Nanostructured zinc oxides (ZnO) are promising photocatalysts due to their high stability, high surface activity, and low costs. This study highlights a simple method of a co-precipitation for synthesizing ZnO and potassium doped ZnO (K-ZnO). In this research, surface functionalization with high quality explored by multiple surface analytical methods such as crystal structural, morphology analysis, inductively coupled plasma-atomic emissions spectroscopy (ICP-AES) and scanning electron microscopy (SEM) attached with energy dispersive x-ray (SEM/EDX). The approach is well suited to produce crystalline K-ZnO, which possesses a shape of nanorods (35.2 to 48.9 nm) and acts as an efficient visible light responsive photocatalyst. The results indicated that the K-ZnO is more responsive to the visible light than pure ZnO. The degradation efficiency of 2-naphthol in aqueous solution in the presence of K-ZnO and sunlight was found to be 95% in 70 min at pH 10.5. In contrast, negligible degradation of 2-naphthol occurred in the absence of K-ZnO. Mechanism and type of photoreaction were identified by employing hydroxyl radical scavengers (e.g. tert-butyl alcohol and Cu2+/Ag+ ion) and electron  scavengers (e.g. Ag+ ions and molecular oxygen). The kinetic analysis of the photodegradation process using a Langmuir-Hinshelwood model suggests that the reaction has occurred on the surface of the photocatalyst. Also, the reaction is influenced by hydroxyl radical scavengers supporting a photooxidation pathway, whereas electron scavengers showed minor effect. Mineralization of 2-naphthol using K-ZnO in presence of sunlight was confirmed by ultra-performance liquid chromatography equipped with mass spectrometry (UPLC/MS).
Keywords: Visible-Light photocatalysis, ZnO, Doping process, Scavengers, Langmuir-Hinshelwood, 2-naphthol
Cite this paper: Taha M. Elmorsi, Toward Visible-Light Responsive Photocatalysts: Nano-Potassium Doping Zinc Oxide (K-ZnO) for Degradation of 2-Naphthol, Physical Chemistry, Vol. 7 No. 2, 2017, pp. 42-53. doi: 10.5923/j.pc.20170702.03.
Article Outline
1. Introduction
- One of the significant sources of pollution in the ecosystem is the discharge of hazardous wastewater such as phenolic pollutants [1, 2]. These pollutants are produced as a product of different industrial processes in addition to biogenic and anthropogenic activities [3, 4]. Therefore, industrial effluents usually contain a trace quantities of phenolic derivatives. These compounds are considered as priority pollutants and classified as hazardous due to their effect on human health [5-7]. Recently, removal of phenolic compounds from the environment was performed through different techniques. Particularly, electrochemical, biological, and chemical techniques, along with others have been used [8-10]. Although, most of these methods have several limitations, heterogeneous photocatalysis appeared to be the most effective method [10-13]. Among different photocatalysts, ZnO has been used due to its advantages of stability, low cost and high surface activity for degrading many organic pollutants [14, 15]. In photocatalytic reaction, when ZnO is excited with a suitable wavelength, it produces conduction band electrons
 and valence band holes
  (equation 1). The active species
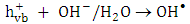
 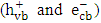 may react with
  and
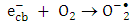
and  to produce hydroxyl radicals
  and super oxide anion radical
  respectively (equations 2-3). Photooxidation and photoreduction reactions of pollutants may occur directly and/or indirectly (equation 4-5) to produce different products (P) [16, 17].
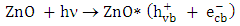 | (1) |
 | (2) |
 | (3) |
 | (4) |
 | (5) |
 radicals or via free solvated electron [13, 18]. Although, the applicability of experimental data to the Langmuir-Hinshelwood kinetic model would support a surface reaction, further evidences are required [13, 19]. Recently, researchers focused on improving the photocatalytic properties of the photocatalysts using different techniques for preparing nanostructures and doping processes [15]. Nanostructured ZnO has been synthesized by different techniques such as hydrothermal method, aerosol, micro-emulsion, ultrasonic, sol–gel method, evaporation of solution and suspensions, solid state reaction, wet chemical synthesis and other techniques [20-22]. However, among these methods, co-precipitation route appeared to be a simple route, low cost and provide large scale production of effective nanoparticle ZnO [22, 23]. It is known that synthesis of ZnO nanoparticles in different shapes with different particle sizes, would lead to increase its surface area which may improve its photocatalytic properties [24, 25]. On the other hand, incorporating dopant ions would generate lattice defects and lead to change in the band gap energy. Furthermore, lowering the band gap of ZnO is an efficient method for enhancing the visible light response of ZnO. Initiating photocatalytic reactions with visible light energy is the main need to overcome the cost and to use the renewable energy. The objective of this research was to use a simple method of co-precipitation for synthesizing nanoparticles of pure ZnO and potassium doped ZnO (K-ZnO) as a visible light responsive photocatalyst. K-ZnO nanoparticles will be used for photocatalytic degradation of 2-naphthol (an organic pollutant) using direct sun light. The optimum conditions for photocatalytic degradation will be determined and different
  and
and  scavengers will be used to elucidate the type of photocatalytic reaction.
 2. Experimental
2.1. Materials and Reagents
- Zinc acetate dihydrate purchased from Loba Chemie, potassium hydroxide was purchased from the Biotech Laboratories Ltd, and ethyl alcohol was purchased from ADWIC. Ferrous ammonium sulphate purchased from LOBA Chemie Company, India. 2-naphthol was purchased from Universal Laboratories, Mumbai. Transition metals such as silver nitrate and copper nitrate were purchased from Loba Chemie. Tert-butyl alcohol (t-butyl) was used as electron scavengers. Millennium Gases supplied nitrogen. A stock solution of 2-naphthol with a concentration of 42 mg/L was prepared in distilled water and further diluted for photodegradation experiments (3.0 to 24 mg/L). Sodium hydroxide and ethylene diamine tetra acetic acid and ethyl alcohol were purchased from ADWIC Company. Ascorbic acid was purchased from Morgan Company. Dilute solutions of HNO3 and NaOH were prepared to control the pH during the experiments. All chemicals were used without further purification. All solutions were prepared with distilled water.
2.2. Preparation of K-ZnO Nanoparticles (Photocatalyst)
- The potassium doped ZnO (K-ZnO) nanoparticles was obtained by co-precipitation method [22] using the following procedure. First, one beaker with 20 mL of aqueous solution of 6 mmol (CH3COO)2Zn•2H2O and another beaker with 10 mL of 20 mmol KOH (with a molar ratio of 1:3). Then, the KOH solution was added dropwise to the zinc acetate solution and stirred. The produced precipitate was kept at 70°C for 15 h, left to cool, rinsed with a mixture of water: ethanol (70:30), and dried at 70°C for 10 h before use in the experiments.
2.3. Characterization of K-ZnO Nanoparticles
- Several techniques used for the analysis of the prepared K-ZnO such as crystal structural, morphology analysis and the spectroscopic measurements. The crystal structure of the prepared samples was investigated by X-ray diffraction (XRD) using λ = 0.1542 nm and the 2θ values ranged from 10° to 80°. Also, the morphology and the structure of the sample was characterized by scanning electron microscopy(SEM) Model Quanta 250 FEG (Field Emission Gun) attached with EDX Unit (Energy Dispersive X-ray Analyses), with accelerating voltage 30 K.V. The elemental analysis of samples was determined by SEM-EDX. The morphology of K-ZnO was further analyzed by transmission electron microscopic (TEM) which performed by JEOL TEM 2100, operating at 200 kV. In addition, the spectroscopic analysis performed by Fourier transmission infrared (FT-IR) and UV-Vis spectra to determine the functional groups and the band gap of K-ZnO sample respectively. FTIR of K-ZnO was obtained by a Shimadzu Fourier transform infrared spectrometry (FTIR) using KBr pellet in the range of 400 to 4000 cm-1 at room temperature. Also, UV-Vis spectrophotometer (Perkin Elmer Lambda 35) was used for recording the transmission/absorption and spectrum of K-ZnO dispersed in water for determining the band gap energy. Further confirmation of doping process investigated by Inductively Coupled Plasma Atomic Emissions Spectroscopy (ICP-AES) using JY 138 instrument supplied from JOBIN-YNON France, sequential spectrometer used for determining the concentration of K doped in ZnO crystals. The working conditions were Power 1100 W, outer gas flow rate 14.0 L/min., auxiliary gas flow rate 0.2 L/min., carrier gas flow rate 1.0 L/min., observation height 15.0 mm, sample feed rate1.4 mL/min. In addition, pH values were measured by a pH meter (HANNA Model).
2.4. Photocatalytic Activity
- The photocatalytic efficiency of K-ZnO was evaluated by the rate of photocatalytic degradation of 2-naphthol under direct sunlight. The initial concentrations of 2-naphthol was varied from 3 to 24 mg/L (2.08 x10⁻⁵ to 16 x10-5 M). Most of the experiments performed at noon time during the month of April and May in Egypt. The average temperature of the solution was about 37C. In these experiments all solutions were pre-equilibrated for 15 min with stirring, then irradiated by sunlight in 15 mL Pyrex tubes. To determine whether 2-naphthol degraded by direct photolysis, corresponding experiments were conducted without K-ZnO. Scavengers were added to the water prior to introduction of 2-naphthol or K-ZnO. To minimize the concentration of O2 gas, solutions were purged with N2 gas for 30 min prior to addition of 2-naphthol.
2.5. Adsorption Experiments
- Dark adsorption by batch technique was used to investigate the removal of 2-naphthol. Known mass of the K-ZnO was added to known volume of 2-naphthol (with different initial concentrations) at room temperature and pH 10.5. Samples were centrifuged (2490 rpm for 12 min), and the amount of 2-naphthol sorbed to K-ZnO was determined by mass balance.
2.6. Analyses of 2-naphthol
- The concentration of 2-naphthol were determined using Perkin Elmer Lambda 35, UV-vis spectrophotometer. The maximum absorbance of 2-naphthol takes place at λ max = 228 nm, at which all subsequent quantitative analyses were performed. The concentrations of 2-naphthol were calculated using the measured absorbance and prepared calibration curve. The amount of 2-naphthol sorbed by K-ZnO at time t (
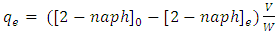
 (mg/g)), and at equilibrium (
 (mg/g)) calculated as in equations 6 and 7.
 | (6) |
 | (7) |
 and
and  are concentration (mg/L) of 2-naphthol before starting the experiment, concentration during the experiment and equilibrium concentrations. Solution volume is V(L) and the photocatalyst mass is W(g). The removal percentage of 2-naphthol by photocatalytic degradation can be calculated from equation 8:
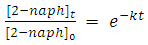
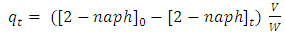 | (8) |
 | (9) |
 | (10) |
 | (11) |
 | (12) |
 and
and  are the reaction rate constants of first-order and second-order reactions respectively.
2.7. Analysis of 2-naphthol for Mineralization Study
- To investigate the mineralization of 2-naphthol, quantitative analyses performed on ultra-performance liquid chromatography waters Acquity equipped with Waters Xevo a triple quadrupole mass spectrometer (UPLC/MS). Samples separated on a Waters BEH C18 column (10 cm x 2.1 mm, 1.7 μm) with a linear, 7 min long gradient from 3 to 10% of acetonitrile containing 0.1% (v/v) formic acid (solvent B) in 0.1% formic acid (solvent A). All separations were carried out at 50°C at the flow rate of 700 μl/min. After each gradient elution, the column was washed with 90% solvent B for 1 minute and then re-equilibrated with 3% solvent B in solvent A for 3 minutes prior to the next injection.
3. Results and Discussion
3.1. Crystal Structural and Morphology Characterization of K-ZnO
3.1.1. X-ray Diffraction (XRD) Analysis
- The crystalline phase and purity of K-ZnO were predicted from XRD analysis as shown in Figure 1. The results show that diffraction peaks appear at 31.73°, 34.45°, 36.15°, 47.45°, 56.49°, 66.35°, 68.1°, 69.2°, 72.05°, and 77.13°. This pattern is in a high agreement with the phase of the standard ZnO (JCPDS card No. 36-1451), which is a hexagonal wurtzite polycrystalline structure (space group: P63mc (186), with lattice planes (hkl) as: (100), (002), (101), (102), (103), (200), (112), (201), (004), and (202), respectively). The XRD patterns and the intensity of the peaks of K-ZnO indicated that the c axis with (101) reflection showed the strongest orientation. Also, K-ZnO showed a broad and some sharp peaks which indicated that the prepared K-ZnO has a small particle size (as resulted from TEM analysis) and is crystalline [26, 27].
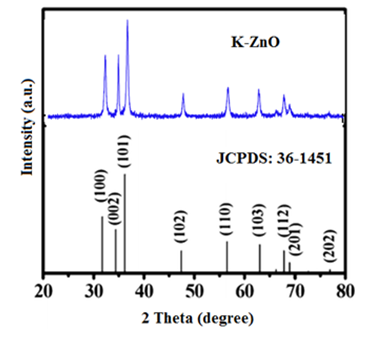 | Figure 1. X-ray diffraction patterns with (hkl) values of as-prepared K-ZnO nanorods compared to the standard (JCPDS:36-1451) of pure ZnO |
3.2. Analysis of the Surface Morphology and the Main Elements in K-ZnO
3.2.1. SEM-EDX and ICP-AES Analysis
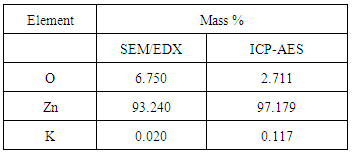
- Analysis of the surface morphology and the main elements in K-ZnO sample was determined by SEM–EDX (Figure 2). The SEM image of K-ZnO (Figure 2a) shows particles without any specific morphology. Energy dispersive X-ray analysis (EDX) was used to determine the chemical compositions of K-ZnO sample (Figure 2b). The results showed that in addition to Zinc and oxygen, potassium was detected in the sample of K doped ZnO to confirm the doping process. As mentioned previously, doping process of K in this research was very simple and performed by co-precipitation with only increasing the amount of KOH three times more than Zn+2 ions (3:1 molar ratio). Although K was detected in a small mass % as 0.02, it is a good indication of the efficiency of this simple method of preparation. In addition, the results of ICP-AES confirmed the presence of K in K-ZnO sample and showed a 0.11 mass % of K is present as shown in Table 1.
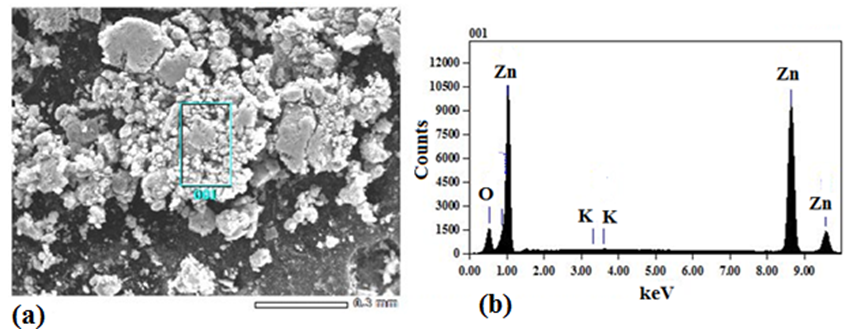 | Figure 2. SEM image (a) and EDX spectrum (b) of as prepared K-ZnO sample |
|
3.2.2. Transmission Electron Microscopic (TEM) Analysis
- Figure 3 shows TEM images of K-ZnO nanoparticle sample. The sample of K-ZnO consists of randomly distributed nanorods along with spherical shaped nanoparticles. The diameter of the nanorods ranges approximately from 35.2 nm to 48.9 nm.
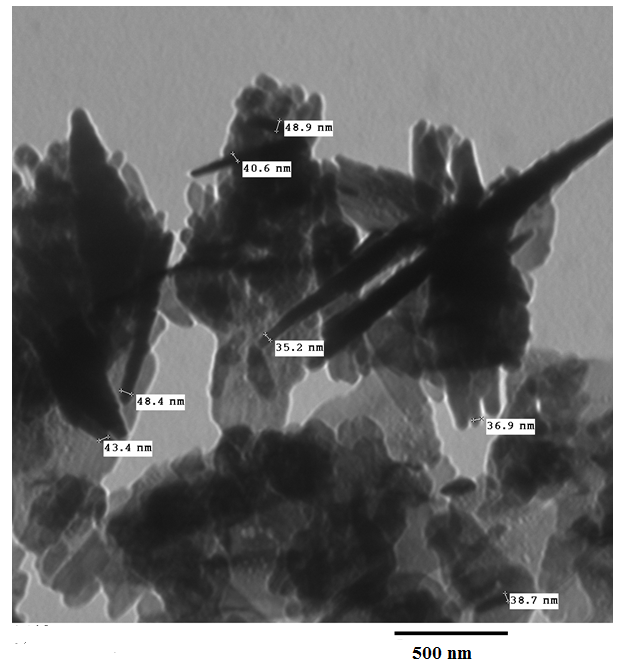 | Figure 3. TEM image of K-ZnO nanorods prepared by co-precipitation |
3.3. Spectroscopic Analysis
3.3.1. Fourier Transmission Infrared (FTIR) Spectra
- Figure 4 shows the typical FTIR spectra of K-ZnO, to investigate the chemical composition of as synthesized K-ZnO nanoparticles. Broad absorption bands near 3,427.85 cm-1 in ZnO and 3470.15 cm-1 in K-ZnO are corresponds to the O–H mode of the atmospheric water molecules absorbed on surface. It can be noted that the strong absorption band of hydroxyl group in K-ZnO spectrum is stronger than pure ZnO. This result may indicate a hydrogen bond formed at K-ZnO interface which increases the concentrations of hydroxyl groups onto the surface of K-ZnO. Presence of OH groups onto the surface of K doped ZnO would increase the formation of hydroxyl radicals and is expected to enhance its photocatalytic activity [15]. The bands centered around 1618.95 cm-1 in ZnO and 1628.85 cm-1 in K-ZnO resulted from the different vibration modes of C=O [28]. Also, the bands at 412.80 and 569.35 cm-1 could be corresponding to the K-ZnO stretching modes which is slightly shifted from the band of 561.18 cm-1 which is corresponding to the ZnO stretching modes [29]. The main bands in K-ZnO were slightly shifted from the corresponding bands in ZnO, that is because the addition of impurities to a semiconductor affects the vibrational properties.
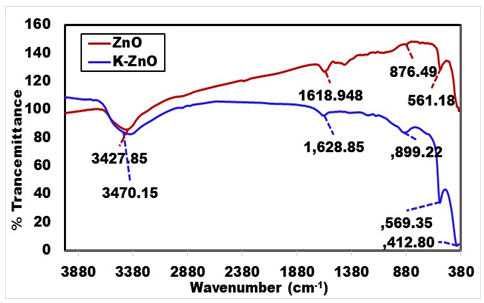 | Figure 4. FTIR spectra of K-ZnO nanorods and pure ZnO samples |
3.3.2. UV-Vis Analysis for Estimating the Band Gap Energy of K-ZnO
- Figure 5 shows the UV–vis spectrum of the pure ZnO and K-ZnO nanoparticles. The absorption spectrum of the K-ZnO nanoparticles presents a maximum absorption peak around 369 nm which is the characteristic peak of hexagonal ZnO nanoparticles (Figure 5a). It was noted that the nanoparticles of K doped ZnO has a red-shift along with an absorption in the visible light region higher than the absorption of pure ZnO [15]. These results indicated that the energy of the visible light is enough to induce the electron–hole pairs of K-ZnO nanoparticles, which enhances its photocatalytic degradation of 2-naphthol. Hence the band gap of the photocatalyst has an important role in its photocatalytic performance [30]. The absorption coefficient (α) and the photon energy (hν) of the incident light (calculated from the UV-vis spectrum) were used to estimate the optical band gap energy of K-ZnO according to Tauc’s model (equation 11) [31]:
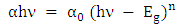 | (12) |
 are the absorption coefficient and the band tailing parameter (energy-independent constant) respectively,
  is the optical energy gap,
  is the power factor of the transition mode (in this study n =2),
  (is the photon energy) where
  is the plank’s constant and
  is the frequency of the radiation. It is noted that the term
  in equation (12) has different values based on the nature of the materials (amorphous or crystalline) and the type of the transition (allowed, not allowed and forbidden) as 1/2, 2, 3/2 and 3. In this study the best fit of our experimental data was obtained with n =2. The values of
  of K-ZnO was determined by plotting
  versus
  , (as shown in Figure 5b) based on the rearrangement of Tauc’s model equation 12 becomes:
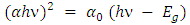 | (13) |
 ) axis at
  . The obtained values were 2.94 and 3.21 eV for K-ZnO and pure ZnO respectively. This result indicated that the K-ZnO is more responsive to the visible light than pure ZnO. Also, confirmed the effectiveness of K-ZnO for the photodegradation of 2-naphthol in sunlight.
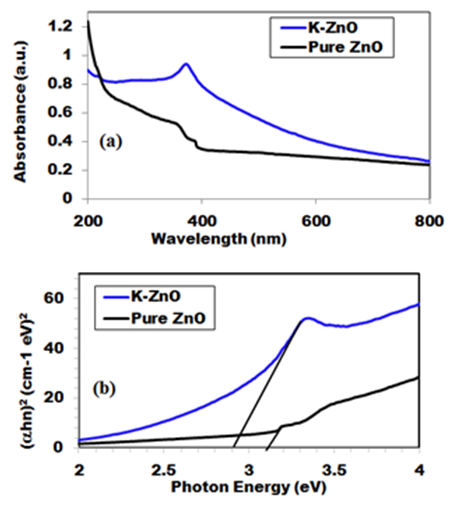 | Figure 5. UV-vis spectra of (a) the as-prepared K-ZnO and pure ZnO and (b) the estimated band gap energies |
3.4. Photocatalytic Degradation of 2-naphthol
3.4.1. Effect of K-ZnO on the Photocatalytic Degradation of 2-naphthol
- The photocatalytic activity of K-ZnO was investigated in the photocatalytic degradation of 2- naphthol under sunlight. The experiments performed at photocatalyst dose of 0.5g/L, temperature of 37°C and natural pH value of 7.3. Figure 6 showed the comparison between pure ZnO and K-ZnO for the photodegradation of 2-naphthol. Also, the removal of 2-naphthol by photolysis and adsorption process was investigated to confirm the efficiency of K-ZnO. The results indicated that doping process of ZnO with K produced K-ZnO as a very effective photocatalyst with a high response to the visible light. K-ZnO is excited with the energy of the sunlight to produce conduction band electrons
 and valence band holes
  which are capable of initiating photoreduction and photooxidation of 2-naphthol, respectively.The change in the concentrations of 2-naphthol
  with illumination time, indicated that about 95% disappearance occurred in 70 min of irradiation. This result can be explained in terms of presence of K in K doped ZnO nanoparticles in addition to its small particles size (35.2 nm to 48.9 nm) as determined by TEM analysis. Presence of K in K-ZnO led to increasing the response of K-ZnO to the visible light with enough energy to promote the photo redox species that are capable of photodegradation of 2-naphthol [28]. Furthermore, nanoparticles of K-ZnO would have large surface area which possess more available surface sits for photodegradation process [32]. However, in presence of pure ZnO under similar conditions the photocatalytic degradation of 2-naphthol was very small with only about 21% disappearance in same photoperiod. Furthermore, it was noted that both direct photolysis and dark adsorption led to slight remove to 2-naphthol. Hence removal of 2-naphthol due to direct photolysis and dark adsorption was only 12% and 16% respectively over similar conditions.
 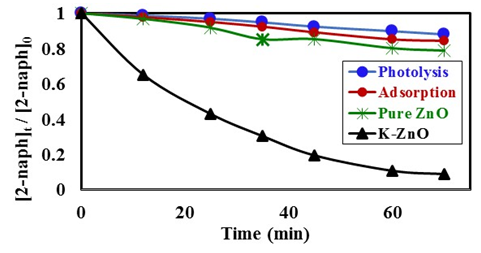 | Figure 6. Comparison of removal of 2-naphthol from aqueous solution using photolysis, adsorption, pure ZnO and K-ZnO, [2-naphthol]0 = 12 mg/L, dose of photocatalyst = 0.5 g/L, T = 37 C and pH = 10.5 under Sunlight |
3.4.2. Effect of pH
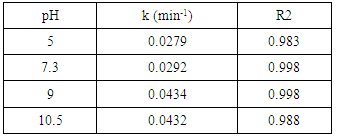
- The type of surface charge of the photocatalyst is affected mainly by the value of its point of zero charge (pzc) and the pH of the suspended solution, which in turn has an important role on the degradation process. PZC of K-ZnO used in this study is about pH 7.3. Therefore, the surface of K-ZnO is carrying a positive charge in acidic medium and negative charge in basic medium. In this study, photocatalytic degradation of 2-naphthol was investigated at different pH values from 3.5 to 10.5 adjusted by HNO3 and/or NaOH. Figure 7, showed the change in the concentrations of 2-naphthol with the change in the pH values. The photocatalytic degradation of 2-naphthol was relatively slow in acidic medium at pH 5 with about 80% degraded in 75 min. However, the rate constant increases by increasing the pH value (Table 2) and reached the maximum efficiency at pH 10.5 with about 95% degradation in the same photoperiod. This result indicated that increasing the concentration of OH ions at pH 10.5 would enhance the generation of
 radicals which are the key for the degradation of 2-naphthol. Similar results were reported for different studies [32, 33].
 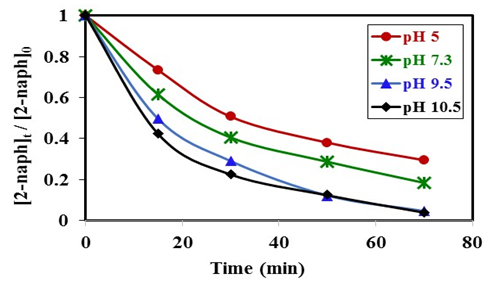 | Figure 7. Effect of pH value on photocatalytic degradation of 2-naphthol, [2-naphthol]0 = 12 mg/L, dose of K-ZnO = 0.5 g/L, T = 37 °C and pH = 3.5 to 10.5 under Sunlight |
|
3.4.3. Effect of dose of K-ZnO
- The dose of the photocatalyst plays an important factor for the photocatalytic degradation process. Hence the dose affected the number of active sites on the surface and consequently the degradation rate [34]. The effect of dose of K-ZnO, experiments were performed at fixed pH 10.5 and 12 mg/L of 2-naphthol with varying the amounts of the K-ZnO (0.25 to 1.5 g/L) under sunlight. The results (Figure 8) shows that the rate constant increases with an increase in the amount of K-ZnO within the studied range. Hence increasing the amount of K-ZnO led to increasing the number of the active sites on the surface of the photocatalyst. Therefore, there will be a high chance for the surface
 radicals to attack high number of 2-naphthol molecules and increase the degradation rate constant as shown in Table 3. Similar results were reported previously for the degradation of congo red by ZnO [34]. In subsequent experiments 0.5 g/L of K-ZnO was used to avoid using more dose of catalyst.
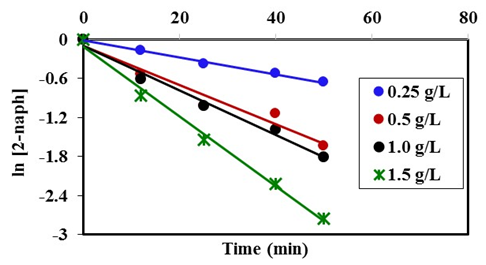 | Figure 8. Effect of K-ZnO dose on photocatalytic degradation of 2-naphthol, [2-naphthol]0 = 12 mg/L, dose of K-ZnO = 0.5 g/L, T = 37°C and pH = 3.5 to 10.5 under Sunlight |
|
3.4.4. Effect of Initial Concentration
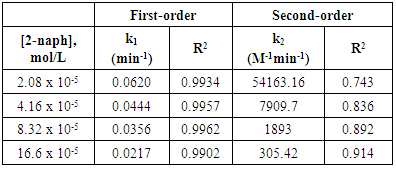
- The effect of the initial concentrations of the pollutant such as 2-naphthol has a significant effect on the photodegradation rate [35]. In this study, the effect of four different concentrations of 2-naphthopl were investigated in the range from 3.0 to 24 mg/L (2.08 x10⁻⁵ to 16.6 x10⁻⁵ mol/L) at 37°C . The results showed that the degradation rate varied with the change in the initial concentration. To investigate the kinetic of the photocatalytic reaction of 2-naphthol, linear form of both the pseudo first-order and the pseudo second-order reaction were employed (equations 10-11). All different initial concentrations were in a good agreement with the exponential function of the pseudo first-order reaction as shown in Figure (9a). It is indicated that the photocatalytic degradation 2-naphthol followed a pseudo-first order reaction with respect to the range of the concentrations in this experiment based on the value of coefficient of determination (R2) as shown in Table 4. The obtained values of the rate constants k1 (min-1) found to decrease from 0.0620 to 0.0217 min-1 with increasing the initial concentration of 2-naphthol from 2.08 x 10⁻⁵ to 16.6 x 10⁻⁵ mol/L as shown in Table (4). At low concentration of 2-naphthol in the solution led to small ratio of adsorbed molecules on the surface compared to the number of active sites at fixed amount of the photocatalyst. This would enhance the photocatalytic degradation of the 2-naphthol. On the other hand, increasing the concentration of 2-naphthol would require a number of active sites higher than the available sites on the same fixed amount of K-ZnO. In addition, high concentration of 2-naphthol may increase the covering area on the surface of K-ZnO and consequently decrease the formation of
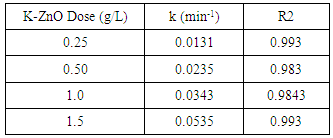
 radicals [32]. Hence decreases the degradation rate of 2-naphthol. This results were in a good agreement with previous reports [34, 36]. To investigate the relationship between the initial rate of photodegradation and the initial concentration of the pollutant, Langmuir–Hinshelwood (L–H) equation was used [13, 32]. This model is describing the photocatalytic degradation process occurred onto the surface of the photocatalyst. According to the linear form of L-H (equation 14), the reciprocal initial rate is plotted versus the reciprocal initial concentration as shown in Figure (9b).
 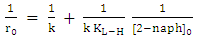 | (14) |
 , is initial rate of the photodegradation, k is the reaction rate constant (mol/l min),
  is the Langmuir-Hinshelwood equilibrium adsorption coefficient (l/mol) and
  is the initial concentration of 2-naphthol. The experimental data showed a good fit with L-H model. The values of the reaction rate constant (k) obtained as 0.681 (mol/l. min) and the adsorption coefficient of the reactant (KH-L) as 18350 (l/mol). The linearity of L-H model along with resendable value of K indicated that the photocatalytic degradation of 2-naphthol is taking place mainly on the surface of K-ZnO. It is better to note that in all subsequent experiments the initial concentration of 2-naphthol was used as 12 mg/L to investigate the effect of other parameters.
  | Figure 9. Effect of initial concentration on the degradation rate of 2-naphthol (a) First-order reaction plot and (b) the Langmuir–Hinshelwood plot: [2-naphthol]0 = 3.0 to 24 mg/L, dose of K-ZnO = 0.5 g/L, T = 37°C and pH = 10.5 under Sunlight |
3.5. Adsorption of 2-naphthol on the K-ZnO Surface
- Different concentrations from 3.0 to 24 mg/L (2.08 x10⁻⁵ to 16.6 x10⁻⁵ mol/L) were used to study the dark adsorption experiments of 2-naphthol on K-ZnO surface for 4.0 hr. The amount of 2-naphthol adsorbed on the surface
 of K-ZnO at equilibrium are calculated according to equation 7.While the equilibrium concentrations
  in the solution calculated from the calibration curve and the absorbance of 2-napthol at λmax of 228nm. The relation between
  and
and  at constant temperature which is called the adsorption isotherm is shown in Figure 10a. The adsorption isotherm of this experiments was found to follow the Langmuir model (equation 15) with very high coefficient of determination
  .
. 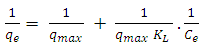 | (15) |
 is the maximum amount of 2-naphthol adsorbed on the surface of K-ZnO at a complete monolayer (mg/g) and
  is the Langmuir adsorption constant (L/mg) which is related to the free energy of adsorption. A plot of
  versus
  for the adsorption of 2-naphthol (Figure 10b) gives a straight line of slope
  and intercept
  which are used to calculate Langmuir constants. The maximum adsorption capacity of 2-naphthol on K-ZnO
  was found to be 3.29 x10⁻⁵ mol/g (4.74 mg/g) and the Langmuir constant
  is 1496.70 (L/mol). As discussed previously, the value of adsorption constant calculated from the Langmuir–Hinshelwood model (KL-H) for the photocatalytic degradation is 18350 L/mol. It can be noted that the adsorption rate of 2-naphthol in the light is 12 times more than the adsorption in the dark. It is indicated that the irradiated light would affect the adsorption rate along with the electronic properties of K-ZnO [32, 37]. Several studies have shown similar results for different compounds [38, 39]. It can be concluded that the adsorption of 2- naphthol on the surface of K-ZnO would enhance the degradation rate by the adsorbed
  radicals [13], However, the adsorption process is not only the key for the degradation of the pollutant, hence the adsorbed
  radicals may diffuse into the bulk solution and continue the process [37].
 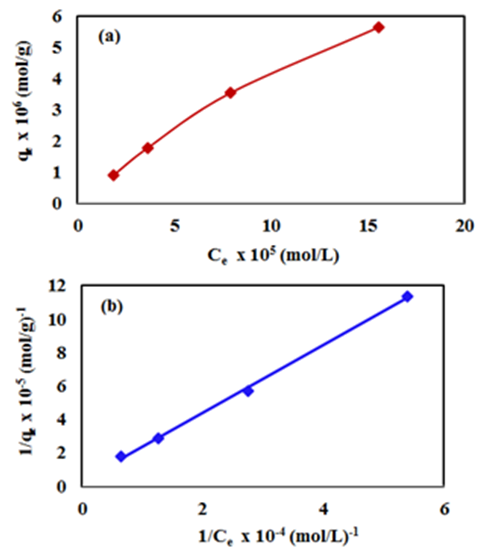 | Figure 10. (a) Adsorption isotherm of 2-naphthol on K-ZnO surface and (b) Langmuir isotherm model, [2-naphthol]0 = 3.0 to 24 mg/L, dose of K-ZnO = 0.5 g/L, T = 37°C, pH = 10.5 and Time = 4.0 hr |
3.6. Mechanism and Type of the Photocatalytic Degradation Reaction
- It is valuable to investigate the mechanism and the type of the photocatalytic degradation reaction of 2-naphthol on the surface of K-ZnO. Many reports have been devoted to understand that mechanism of photocatalysis [13]. The influence of different electron
 and
and  radical scavengers on the rate was mainly used to provide valuable information. Different scavengers were added to eliminate one route of degradation at a time.
 3.6.1. The Effect of Electron Scavengers
- Silver ion (Ag+) and molecular oxygen (O2) were used as a conduction band electron
 scavengers. In this experiment, electron scavenger is useful to confirm that the photocatalytic degradation of 2-naphthol was an oxidative process. It is expected that electron scavengers would inhibit the rate of degradation of 2-naphthol if it was being reduced by reaction with
  . While, the presence of the
  scavengers could enhance the rate of photocatalytic degradation if 2-naphthol was being oxidized by
  [13]. Ag+ ion, is known as an effective electron scavenger due to its reduction by
  to metallic silver
  according to equation (16):
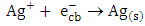 | (16) |
 radicals by a decrease in the degree of electron-hole recombination [13]. This result confirmed that the
  radicals are the main oxidizing species for degrading 2-naphthol by photooxidation process. Furthermore, molecular oxygen is another
  scavenger due to its conversion to the superoxide anion radical
  [13]. Then
  will eventually reproduce adsorbed oxygen
  . The photocatalytic degradation of 2-naphthol was rapid in presence of the natural level of O2 (line namely no scavengers in Fig.11) in the solution (without purging more O2). While decreasing the level of dissolved oxygen by N2 purging in the solution for an hour, led to a significant decrease in the degradation rate by about 30%. It appears that reducing the scavenging effect of
  enhances the degree of electron-hole recombination and decreases the available amount of
  radicals. Decreasing the degradation rate of 2-naphthol due to the absence of more
  radicals is further confirming for the photooxidation process.
 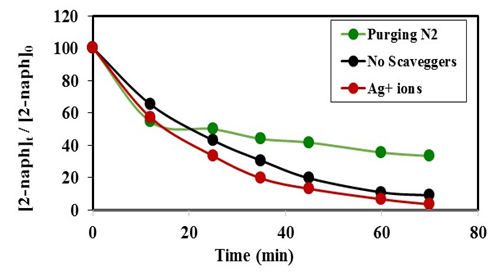 | Figure 11. Effect of electron scavengers on the photocatalytic degradation of 2-naphthol, [2-naphthol]0 = 12 mg/L, dose of K-ZnO = 0.5 g/L, T = 37°C and pH = 10.5 under Sunlight |
3.6.2. The Effect of  Radical Scavengers
- To further confirm the photooxidation process of degradation of 2-naphthol, experiment performed in presence of
 radical scavengers. Tert-butyl alcohol (TBA) and Cu2+ in presence of Ag+ ions were used. The result in Figure 12 showed that the degradation rate of 2-naphthol, was significantly decreased in the presence of TBA. Hence TBA is weakly adsorbed onto the surface of a photocatalyst [40], it is mainly reacted with free
  radicals
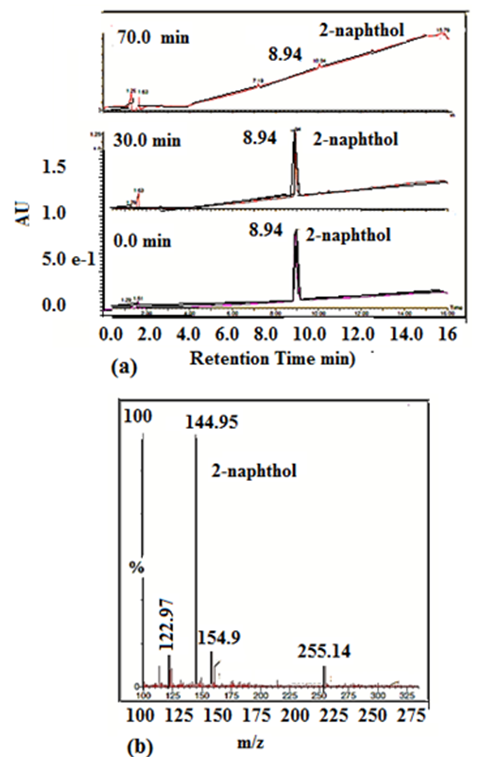
  which available for photooxidation. Presence of TBA inhibited the degradation of 2-naphthol as shown in Figure 12. Furthermore, the photodegradation of 2-napthol was strongly inhibited due to the addition of 1.5 mM of Cu2+ ion in presence of 1.5mM Ag+ ions lending further support for an oxidative degradation. Presence of Ag+ ions in the solution reduced Cu2+ ions to unstable Cu+. Consequently, the reactive Cu+ ions formed [13] compete with 2-naphthol for the oxidants,
  according to equation 17.
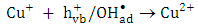 | (17) |
 radicals either free or adsorbed on the surface of K-ZnO. It is worthy to note that the adsorption experiments discussed previously, further confirmed the photooxidation process via the
  radicals.
 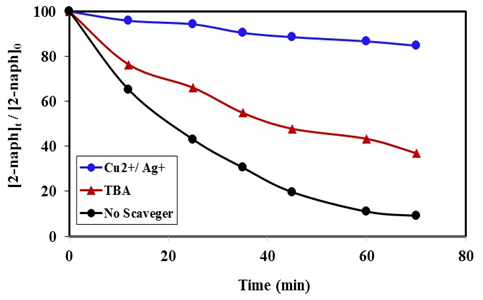 | Figure 12. Effect of  radical Scavengers on the photocatalytic degradation of 2-naphthol, [2-naphthol]0 = 12 mg/L, dose of K-ZnO = 0.5 g/L, T = 37°C and pH = 10.5 under Sunlight radical Scavengers on the photocatalytic degradation of 2-naphthol, [2-naphthol]0 = 12 mg/L, dose of K-ZnO = 0.5 g/L, T = 37°C and pH = 10.5 under Sunlight |
3.7. Mineralization of 2-naphthol
- To study the mineralization of 2-naphthol, a preliminary experiment was performed in aqueous solution of 2-naphthol (12 mg/L) with 0.5g/L K-ZnO using visible light. The extent of the photodegradation and the changes in the characteristic absorbance band of 2-naphthol were monitored by UPLC/MS. As shown in Figure 13, at time zero min, the UPLC chromatogram showed a main peak with retention time of 8.93 min which is corresponding to 2-naphthol. The intensity of that peak started to decrease due to the progress of the degradation reaction and reached a significant decrease after 30 min. Then a dramatic disappearance of 2-naphthol peak (at 8.93 mi) occurred at a period of 70 min of the degradation reaction. Although minor peaks appeared at different times, they were lower than the detection limit to find out their mass spectra for identification. It is apparent that if there was an intermediate species during the degradation process, they degraded at equal rate of the parent 2-naphthol. As reported previously [3], there are two different mechanisms to emphasis the degradation of some aromatic compounds which may confirm this result. One mechanism may occur by the direct attack of the redox species on the aromatic ring, leading to its break and a gradual decrease in the characteristic absorption band of the parent compound. In this case, there is no intermediates may form during the degradation and consequently no band displacement in their spectra. The second mechanism may occur by chemical substitution in the aromatic ring forming different intermediates, which may have led to a displacement of the characteristic absorption bands of the parent pollutant [41-43]. As shown in the UPLC chromatograms of 2-naphthol (Figure 13), there was a gradual decrease in the characteristic absorption band of 2-naphthol. Also, there was not a new significant band in the chromatograms. It can be concluded that photocatalytic degradation of 2-naphthol was effective by using K-ZnO under sunlight. This process resulted in a mineralization of 2-naphthol by direct attack on the aromatic ring.
 | Figure 13. (a) UPLC chromatograms at 228 nm (and TIC obtained at 8.93 min is 2-naphthol at different time of photocatalytic degradation; 0.0 min, 30 min and 70 min, (b) mass spectra of TIC at 8.93 min (for 2-naphthol) m/z = 144.95 |
4. Conclusions
- The result of this study indicated that nanorods of K-ZnO (0.5g/L) effectively degraded about 95% of 2-naphthol (12 mg/L) under direct sunlight in 70 min at pH 10.5. As prepared K-ZnO was characterized by several techniques such as crystal structural, morphology analysis and spectroscopic measurements. ICP-AES and SEM/EDX confirmed doping process of K -ZnO. Photooxidation mechanism of 2-naphthol was predominant route, in this study, as confirmed by different scavengers. Furthermore, photocatalytic degradation occurred on the surface of K-ZnO as confirmed by Langmuir-Hinshelwood model along with adsorption experiments. Presences of different scavengers of
 and
and  supported a photooxidation reaction. UPLC/MS analysis confirmed the mineralization of 2-naphthol using K-ZnO in presence of sunlight.
 ACKNOWLEDGEMENTS
- Author would like to thank Prof. Dr. Mostafa F. Bakr, Dr. Yasser M. Riyad, Faculty of Science, Al-Azhar University, Cairo, Egypt for valuable discussion. Also, we would like to thank Dr. Mohamed Abdel Halim, German University in Cairo for sample analysis.
References
| [1] | Pirilä, M., et al., Photocatalytic degradation of organic pollutants in wastewater. Topics in Catalysis, 2015. 58(14-17): p. 1085-1099. |
| [2] | Qourzal, S., et al., Photodegradation of 2-naphthol in water by artificial light illumination using TiO2 photocatalyst: identification of intermediates and the reaction pathway. Applied Catalysis A: General, 2008. 334(1): p. 386-393. |
| [3] | González, L.T., et al., Comparative Photocatalytic Performance on the Degradation of 2-Naphthol Under Simulated Solar Light Using α-Bi4V2O11 Synthesized by Solid-State and Co-precipitation Methods. Water, Air, & Soil Pollution, 2017. 228(2): p. 75. |
| [4] | Luo, H., et al., Electrochemical degradation of phenol by in situ electro-generated and electro-activated hydrogen peroxide using an improved gas diffusion cathode. Electrochimica Acta, 2015. 186: p. 486-493. |
| [5] | Benhebal, H., et al., Photocatalytic degradation of phenol and benzoic acid using zinc oxide powders prepared by the sol–gel process. Alexandria Engineering Journal, 2013. 52(3): p. 517-523. |
| [6] | Delval, F., G. Crini, and J. Vebrel, Removal of organic pollutants from aqueous solutions by adsorbents prepared from an agroalimentary by-product. Bioresource technology, 2006. 97(16): p. 2173-2181. |
| [7] | Liu, C., et al., Thermal conversion of lignin to phenols: Relevance between chemical structure and pyrolysis behaviors. Fuel, 2016. 182: p. 864-870. |
| [8] | Zhou, W., et al., Phenol degradation by Sulfobacillus acidophilus TPY via the meta-pathway. Microbiological Research, 2016. 190: p. 37-45. |
| [9] | Zhou, M., et al., Investigation on the preparation and properties of monodispersed Al2O3 ZrO2 nanopowder via Co-precipitation method. Journal of Alloys and Compounds, 2016. 678: p. 337-342. |
| [10] | Wang, T., et al., Research on degradation product and reaction kinetics of membrane electro-bioreactor (MEBR) with catalytic electrodes for high concentration phenol wastewater treatment. Chemosphere, 2016. 155: p. 94-99. |
| [11] | Aslam, M., et al., Evaluation of sunlight induced structural changes and their effect on the photocatalytic activity of V2O5 for the degradation of phenols. Journal of hazardous materials, 2015. 286: p. 127-135. |
| [12] | Quiñones, D., et al., Boron doped TiO2 catalysts for photocatalytic ozonation of aqueous mixtures of common pesticides: Diuron, o-phenylphenol, MCPA and terbuthylazine. Applied Catalysis B: Environmental, 2015. 178: p. 74-81. |
| [13] | El-Morsi, T.M., et al., Photocatalytic degradation of 1, 10-dichlorodecane in aqueous suspensions of TiO2: A reaction of adsorbed chlorinated alkane with surface hydroxyl radicals. Environmental science & technology, 2000. 34(6): p. 1018-1022. |
| [14] | Ravelli, D., et al., Photocatalysis. A multi-faceted concept for green chemistry. Chemical Society Reviews, 2009. 38(7): p. 1999-2011. |
| [15] | Raj, R.B., et al., Effect of potassium on structural, photocatalytic and antibacterial activities of ZnO nanoparticles. Advances in Natural Sciences: Nanoscience and Nanotechnology, 2016. 7(4): p. 045008. |
| [16] | Pelizzetti, E. and C. Minero, Mechanism of the photo-oxidative degradation of organic pollutants over TiO2 particles. Electrochimica acta, 1993. 38(1): p. 47-55. |
| [17] | Calza, P., C. Minero, and E. Pelizzetti, Photocatalytically assisted hydrolysis of chlorinated methanes under anaerobic conditions. Environmental science & technology, 1997. 31(8): p. 2198-2203. |
| [18] | Kerzig, C. and M. Goez, Generating hydrated electrons through photoredox catalysis with 9-anthrolate. Physical Chemistry Chemical Physics, 2015. 17(21): p. 13829-13836. |
| [19] | Hoffmann, M.R., et al., Environmental applications of semiconductor photocatalysis. Chemical reviews, 1995. 95(1): p. 69-96. |
| [20] | Kołodziejczak-Radzimska, A. and T. Jesionowski, Zinc oxide—from synthesis to application: a review. Materials, 2014. 7(4): p. 2833-2881. |
| [21] | Kale, R.B., Morphological evolution of hydrothermally derived ZnO nano and microstructures. Optik-International Journal for Light and Electron Optics, 2016. 127(11): p. 4621-4624. |
| [22] | Sadraei, R., A Simple Method for Preparation of Nano-sized ZnO. Research & Reviews: Journal of Chemistry, e-ISSN, 2016: p. 2319-9849. |
| [23] | Chen, C., P. Liu, and C. Lu, Synthesis and characterization of nano-sized ZnO powders by direct precipitation method. Chemical Engineering Journal, 2008. 144(3): p. 509-513. |
| [24] | Duo, S., et al., A facile salicylic acid assisted hydrothermal synthesis of different flower-like ZnO hierarchical architectures with optical and concentration-dependent photocatalytic properties. Materials Characterization, 2016. 114: p. 185-196. |
| [25] | Xiao, Q., et al., Sonochemical synthesis of ZnO nanosheet. Journal of Alloys and Compounds, 2008. 459(1): p. L18-L22. |
| [26] | Chen, X., et al., Self-assembly of ZnO nanoparticles into hollow microspheres via a facile solvothermal route and their application as gas sensor. CrystEngComm, 2013. 15(36): p. 7243-7249. |
| [27] | Hassanien, A. and A.A. Akl, Crystal imperfections and Mott parameters of sprayed nanostructure IrO2 thin films. Physica B: Condensed Matter, 2015. 473: p. 11-19. |
| [28] | Bharathi, V., et al., Optical, structural, enhanced local vibrational and fluorescence properties in K-doped ZnO nanostructures. Applied Physics A, 2014. 116(1): p. 395-401. |
| [29] | Djaja, N.F., D.A. Montja, and R. Saleh, The effect of Co incorporation into ZnO nanoparticles. 2013. |
| [30] | Ansari, S.A. and M.H. Cho, highly visible light responsive, narrow band gap TiO2 nanoparticles modified by elemental red phosphorus for photocatalysis and photoelectrochemical applications. Scientific reports, 2016. 6. |
| [31] | Tumuluri, A., K.L. Naidu, and K.J. Raju, Band gap determination using Tauc’s plot for LiNbO3 thin films. Chem Tech, 2014. 6(6): p. 3353-3356. |
| [32] | Laid, n., et al., study of the photocatalytic degradation of a cationic dye in aqueous solution by different types of catalysts. Sciences & technologie a, 2014(39): p. 75-82. |
| [33] | Konstantinou, I.K. and T.A. Albanis, TiO2-assisted photocatalytic degradation of azo dyes in aqueous solution: kinetic and mechanistic investigations: a review. Applied Catalysis B: Environmental, 2004. 49(1): p. 1-14. |
| [34] | Zuas, O., H. Budiman, and N. Hamim, Synthesis of ZnO nanoparticles for microwave induced rapid catalytic decolorization of congo red dye. Adv. Mater. Lett, 2013. 4: p. 662-667. |
| [35] | Teh, C.M. and A.R. Mohamed, Roles of titanium dioxide and ion-doped titanium dioxide on photocatalytic degradation of organic pollutants (phenolic compounds and dyes) in aqueous solutions: a review. Journal of Alloys and Compounds, 2011. 509(5): p. 1648-1660. |
| [36] | Bi, X.-y., et al., Treatment of phenol wastewater by microwave-induced ClO2-CuOx/Al2O3 catalytic oxidation process. Journal of Environmental Sciences, 2007. 19(12): p. 1510-1515. |
| [37] | Qourzal, S., et al., Photocatalytic degradation and adsorption of 2-naphthol on suspended TiO2 surface in a dynamic reactor. Journal of Colloid and Interface Science, 2005. 286(2): p. 621-626. |
| [38] | Huang, H.-H., D.-H. Tseng, and L.-C. Juang, Heterogeneous photocatalytic degradation of monochlorobenzene in water. Journal of Hazardous Materials, 2008. 156(1): p. 186-193. |
| [39] | Mills, A. and S. Morris, Photomineralization of 4-chlorophenol sensitized by titanium dioxide: a study of the initial kinetics of carbon dioxide photogeneration. Journal of Photochemistry and Photobiology A: Chemistry, 1993. 71(1): p. 75-83. |
| [40] | Ramakrishnan, A., et al., Enhanced performance of surface-modified TiO2 photocatalysts prepared via a visible-light photosynthetic route. Chemical Communications, 2012. 48(68): p. 8556-8558. |
| [41] | Martinez-de La Cruz, A., et al., Photoassisted degradation of rhodamine B by nanoparticles of α-Bi2Mo3O12 prepared by an amorphous complex precursor. Materials Chemistry and Physics, 2008. 112(2): p. 679-685. |
| [42] | Mart nez-de la Cruz, A. and S. Obreg n Alfaro, Synthesis and characterization of nanoparticles of?-Bi2Mo3O12 prepared by co-precipitation method: Langmuir adsorption parameters and photocatalytic properties with rhodamine B. Solid State Sciences, 2009. 11(4): p. 829-835. |
| [43] | Yuan, R., et al., Effects of chloride ion on degradation of Acid Orange 7 by sulfate radical-based advanced oxidation process: implications for formation of chlorinated aromatic compounds. Journal of hazardous materials, 2011. 196: p. 173-179. |