-
Paper Information
- Paper Submission
-
Journal Information
- About This Journal
- Editorial Board
- Current Issue
- Archive
- Author Guidelines
- Contact Us
Physical Chemistry
p-ISSN: 2167-7042 e-ISSN: 2167-7069
2017; 7(2): 31-41
doi:10.5923/j.pc.20170702.02

Copper Biosorption by Untreated and Citric Acid Modified Senna alata Leaf Biomass in a Batch System: Kinetics, Equilibrium and Thermodynamics Studies
 Abstract
 Reference
 Full-Text PDF
 Full-text HTML
Chijioke John Ajaelu1, Modupe O. Dawodu1, Esther Oremeiyi Faboro1, Olushola Sunday Ayanda2
1Department of Chemistry and Industrial Chemistry, Bowen University, Iwo, Nigeria
2Environmental Nanoscience Research, Department of Industrial Chemistry, Federal University Oye Ekiti, Nigeria
Correspondence to: Chijioke John Ajaelu, Department of Chemistry and Industrial Chemistry, Bowen University, Iwo, Nigeria.
| Email: |  |
Copyright © 2017 Scientific & Academic Publishing. All Rights Reserved.
This work is licensed under the Creative Commons Attribution International License (CC BY).
http://creativecommons.org/licenses/by/4.0/

Untreated Sennaalata (USA) and chemically modified Sennaalata (CAMSA) were evaluated for their effectiveness in the removal of Cu2+ from aqueous solution. USA was modified with citric acid and characterized by SEM and FTIR. The parameters determined included pH, point of zero charge and initial concentration. Batched equilibrium, kinetic and thermodynamic experiments were also carried out at 298K and at pH 5. The kinetic data obtained were analyzed using pseudo-first order and pseudo-second order models. The pseudo- second order model was better for describing the adsorption of both USA and CAMSA. The equilibrium data were analyzed using Langmuir, Freundlich and Temkin isotherms. The Sorption isotherm was well fitted to Langmuir for both USA and CAMSA. The maximum monolayer adsorption capacities were 2.44 and 23.8 mg/g for USA and CAMSA respectively. In addition, the specific surface area of CAMSA (3.56m2/g) was higher than that of USA (0.365 m2/g). Thus CAMSA removed more Cu2+ than USA. Effect of temperature revealed that the reaction was endothermic and the sorption process was physisorption for both USA and CAMSA.
Keywords: Senna alata, Kinetics, Equilibrium, Absorption, Surface area, Thermodynamics, Isotherm
Cite this paper: Chijioke John Ajaelu, Modupe O. Dawodu, Esther Oremeiyi Faboro, Olushola Sunday Ayanda, Copper Biosorption by Untreated and Citric Acid Modified Senna alata Leaf Biomass in a Batch System: Kinetics, Equilibrium and Thermodynamics Studies, Physical Chemistry, Vol. 7 No. 2, 2017, pp. 31-41. doi: 10.5923/j.pc.20170702.02.
Article Outline
1. Introduction
- The presence of heavy metals in our environment is posing serious threat to man and animal. The toxic heavy metals are released from anthropogenic sources such as metallurgical, galvanizing, metal finishing, electroplating, mining, power regeneration, electronic devices manufacturing and tannery industries. Copper is a common substance that is widely used in many industries as untreated materials or additives, and has been considered a very hazardous pollutant [1, 2]. Some of the sources of copper ion in industrial effluents include metal cleaning, plating bath, paper board, mining, anti-fouling for paint and pigment, fertilizer, wood pulp, etc. [3, 4]. Even though copper as a trace element is essential to human beings, excessive consumption of it can result in liver and brain damages, mucosal irritation, gastrointestinal irritation, hepatic and renal damage, widespread capillary damages, central nervous problems followed by depression, and possible necrotic changes in the liver and kidney [5, 6]. The maximum permissible amount of copper approved by the World Health Organization in drinking water is 1.5 mg/L [7]. Thus the removal of excessive copper in the water bodies has become very necessary. Some of the different methods of removing heavy metal ions from aqueous solutions include ion exchange, solvent extraction, reverse osmosis, chemical precipitation, membrane filtration, electro deposition. The drawbacks in these methods include the inability to remove low concentrations of heavy metals (10 mg/L), ineffectual removal of toxic sludge, unsuitable for wide range of pollutants, expensive to maintain and mostly involves ex-situ remediation.The biosorption methods are especially considered in recent decade. The major advantages of the heavy metals adsorption technology by biomass are its efficacious ability to decrease to a reasonable extent the concentration of heavy metal ions to very low levels [8] and the use of cost effective biosorbent materials. Furthermore, biosorption methods often provide better results than activated carbon and natural zeolites and are comparable to synthetic ion-exchange resins [9]. Other undeniable advantages of biosorption include the ability to carry out the remediation insitu and their environmentally benign nature.Senna alata, also known as Candle bush, is a medicinal tree as well as ornamental flowering plant. It is found in diverse habitat. It grows up to an altitude of 1200 m in the tropics. It has effective fungicidal property and is therefore, used for treating ringworms and other fungal skin infections.In this present study, the adsorption ability of untreated Senna alata (USA) and citric acid modified Senna alata (CAMSA) containing Cu (II) ions were determined. Both samples were characterized with FTIR and scanning electron microscope, SEM. The effects of some parameters such as initial metal concentration, contact time, temperature, adsorbent dosage and pH on the adsorption efficiency of copper from aqueous solutions onto Senna alata were investigated. Additionally, adsorption isotherms, kinetic and thermodynamic parameters were also evaluated.
2. Materials and Methods
2.1. Materials
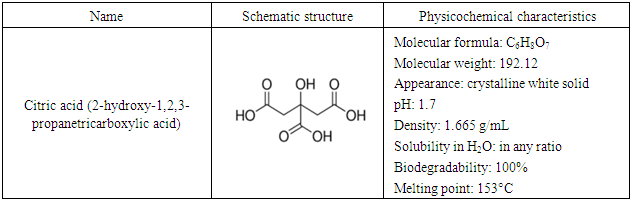
- All reagents employed in these experiments were of analytical grade. Citric acid monohydrate was used in the chemical modification of the biomass. Stock solution of 1000 mgL−1 of Cu(II) from Cu(NO3)2 salt was prepared. Series of work solutions with the concentrations ranging from 20 to 100 mgL−1 of Cu(II) were prepared by appropriate dilution of the stock solution immediately prior to their use. The Senna alata biomass was obtained from a wetland located in Iwo, Nigeria (7° 38′ 0l″ N, 4° 11′ 01″ E). After harvest, the biomass was washed several times with deionized water to remove the dust particles, and then dried in an oven at 363K for 24 h. The dried biomass was crushed by a high-speed electric grinder. The particles were sieved with a 500μm mesh size and stored in a plastic bag.
2.2. Citric Acid Modification
- Ground untreated Senna alata was mixed with 0.2 M CA at the ratio of 1:10 (untreated Senna alata: CA, w/v) and stirred for 60 min. The acid/Senna alata slurry was initially dried at 60°C for 2.5 hours in the oven after which the temperature was raised to 140°C for 2.5 hours. After cooling, the CA modified Senna alata was washed with deionized water. After filtration, the CA modified Senna alata was suspended in 0.15 M NaOH at suitable ratio and stirred for 60 min followed by washing thoroughly with de-ionized water to remove the residual alkali. The wet CA modified Senna alata was dried at 105°C until constant weight and preserved in a plastic container as modified sorbent for further use.NOMENCLATURES
2.3. Instrumental Characterization of USA and CAMSA
- The functional groups on the surfaces of USA and CAMSA containing adsorbed Cu (II) ions were analyzed by Fourier Transform Infrared Spectrophotometer, Agilent Technologies Cary 630FTIR spectrometer. A sample press, which is part of the ATR interface, was used to ensure that the ground USA and CAMSA were in good contact with the sensor surface. Spectral data were collected in the 4,000–650 cm –1 region at 4 cm –1 resolution.Scanning electron microscope (Zeiss Auriga HRSEM) was applied to analyze the surface morphology of both USA and CAMSA.
2.4. Equilibrium Adsorption
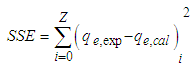
- Batch adsorption experiments were performed to examine the effects of different parameters, which included pH and adsorbent dose. In each experiment, 0.5 g of the adsorbent was added to 20 mL copper solution in a 250 mL conical flasks and the pH of the solution was adjusted to the desired value by adding a small quantity of 1.0 mol L−1 HCl or 1.0 mol L−1 NaOH solution, and measured with a pH meter. The conical flasks were then placed in an electric shaker to agitate at a speed of 250 rpm at 298K until the equilibrium was reached. Then the mixture was filtered by using Whatmann’s No 1 filter paper. Subsequently, the concentrations of the filtrates were determined using atomic absorption spectrophotometer (PG 990, PG instruments, Britain). The amount of Cu2+ adsorbed qe (mg/g) which represents the amount of adsorbed metal per amount of adsorbent and the removal percentage (%) can be calculated by the following equations:
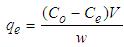 | (1) |
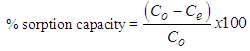 | (2) |
2.5. Kinetics and Thermodynamics
2.5.1. Adsorption Kinetic Experiments
- 0.3 g each of adsorbent was added to 120 mL of 20-100 mg/L copper solutions in 500 mL beakers. The beakers were placed on an electromagnetic stirrer at a constant temperature of 298 K with a speed of 250 rpm. Once the Senna alata was added, the timing began. The samples were extracted at a definite interval of time and filtered by Whatmann’s No 1 filter paper and the amount of metal adsorbed was determined using AAS. The amount of copper adsorbed qt (mg/g) which represented the amount of adsorbed copper per amount of adsorbent in a specific time can be calculated by the following equation:
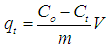 | (3) |
2.5.2. Adsorption Thermodynamics Experiments
- Adsorption was carried out by shaking (at 250 rpm) a fixed mixture with 20 mL of the copper solutions of different concentrations (20-100 mg/L) and 0.1 g of the adsorbent at different temperatures (303, 308, 313 and 318 K) in a batch of conical flasks.The amount of metal adsorbed was determined by AAS.
3. Results and Discussions
3.1. Biosorbent Characterization
- The examination of the textural structure of USA and CAMSA by SEM micrographs at 500x magnification was carried out and are reflected in Figs. 1a and b. Both USA and CAMSA revealed fibrous structures and agglomerates. But USA has more agglomeration than CAMSA. This may be ascribed to the adsorbent weight loss during modification process. Similar observation was obtained by Garcia-Mendeta et al [10] for untreated and formaldehyde modified green tomato husk. In addition, USA and CAMSA have unevenly distributed pores. The FTIR analysis was carried out to show the functional groups present in the USA and CAMSA containing adsorbed Cu (II) ions. Figs. 2a and 2b show the FTIR of USA and CAMSA. The absorption band at 3330.4 cm-1 corresponds to the stretching vibration of the OH group in CAMSA while the absorption band at 3328.5 cm-1 is assigned to the OH group of USA. The absorption bands at 2920.4 cm-1 corresponds to CH stretch for both CAMSA and USA. Saturated (sp3) C-H stretches were observed at 2851.4 cm-1 and 2849.5 cm-1 for CAMSA and USA respectively. The CO stretch (of saturated carboxylic acid) for USA and CAMSA were observed at 1720.2 cm-1 and 1718.3 cm-1 respectively. The band at 1617.2 cm-1 for both USA and CAMSA was assigned to N-H bend of primary or secondary amine. New absorption bands at 1507.7 cm-1 and 1438.9 cm-1, assigned to C-C stretch and sp3 C-H bend respectively, of CAMSA were absent in USA. 1241 cm-1, 1157.3 cm-1 and 1032.5 cm-1 were assigned to C-O (alcohol or carboxylic acid) stretch for CAMSA while 1235.6 cm-1 and 1032.5 cm-1 were assigned to C-O stretch (alcohol or carboxylic acid) of USA. The vibrational absorption band at 780.9 cm-1 (CAMSA) and 779.0 cm-1 (USA) were assigned to C-Cl. Fig. 2 revealed that most of the functional groups present on USA are also present on CAMSA. Thus the modification of adsorbent resulted in a strong OH of adsorption.
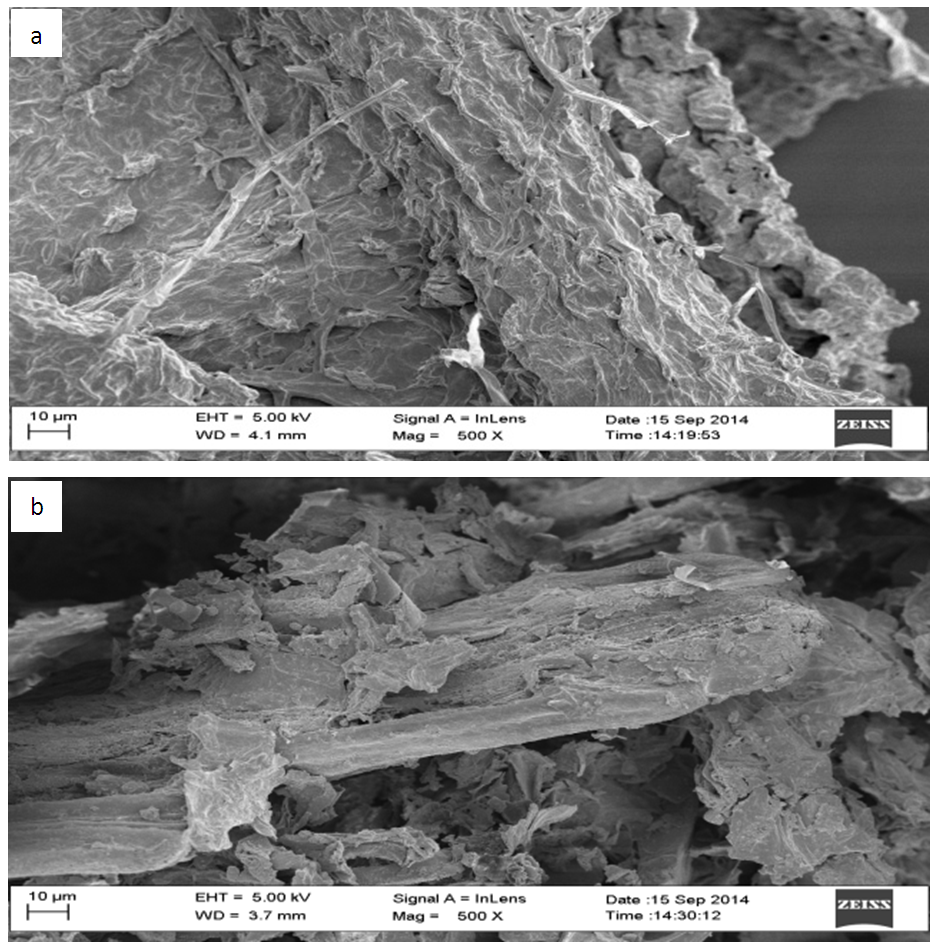 | Figure 1. A typical SEM micrograph of (a) USA and (b) CAMSA |
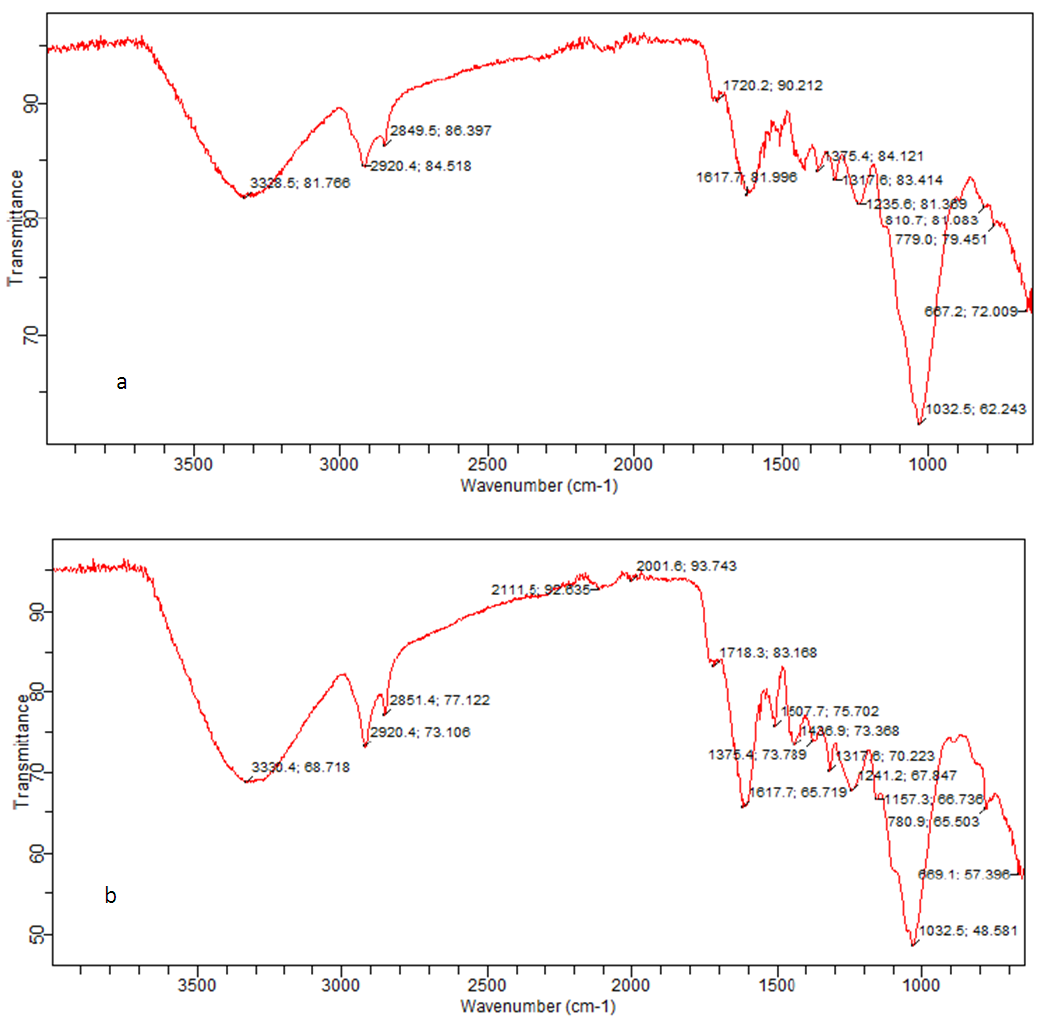 | Figure 2. FTIR spectra of (a) USA and (b) CAMSA |
3.2. Effect of pH
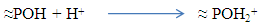
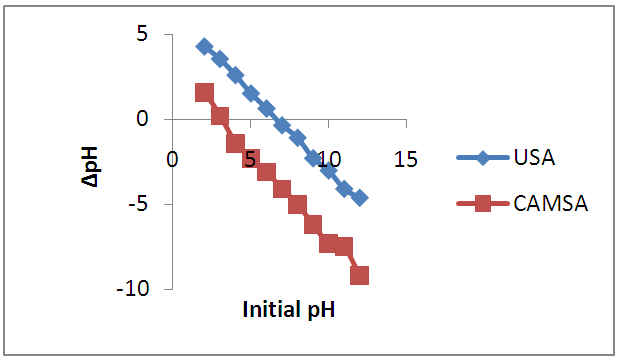
- The pH is an important parameter in the sorption process optimization. It affects not only the surface charge of the adsorbent, but also the degree of ionization and speciation of the metal ions in solution. Fig.3 presents the effect of pH on the adsorption amounts of Cu2+ by the untreated and modified adsorbents. It was found that as pH increased the competition of Cu (II) ions and protons for binding sites decreased and more binding sites are released, which resulted in the increase of adsorption effectiveness [12]. USA showed a sharp increase in adsorption from pH 1-2, the CAMSA showed a sharp increase in adsorption from pH 2-3 while the rate of adsorption gradually increased from pH 3 to 7. The pH at which there was optimum adsorption in untreated and modified Senna alata was coincidentally 5.0.The effect of pH can be explained by considering the surface charge on the adsorbent material [13, 14]. The pH value, at which the surface charge is zero, is called the point of zero charge (PZC).The PZCs of the adsorbent were 3 and 7 for CAMSA and USA respectively, which were determined by the method described by Gupta and Nayak [15] as reflected in Fig. 4. Below pH 3 and 7 for both CAMSA and USA, the surfaces were positively charged and under these conditions the uptake of metal ions would be quite low due to electrostatic repulsion. With increasing pH (beyond PZC) the negative charge on the surface of adsorbent increased thereby enhancing the metal adsorption. The positive charges of USA and CAMSA surfaces were primarily due to the next protonation reactions of the hydroxylic sites:
 whereas the negatively charged surface was due to the deprotonation of acidic sites depicted by the following reactions:
 Where ≈P represents the surface of USA or CAMSASimilar results were obtained by Vasconcelos et al [16] and Tong et al. [1] on adsorption of Cu2+ on chemically modified chitosan and Uncaria gambir respectively.
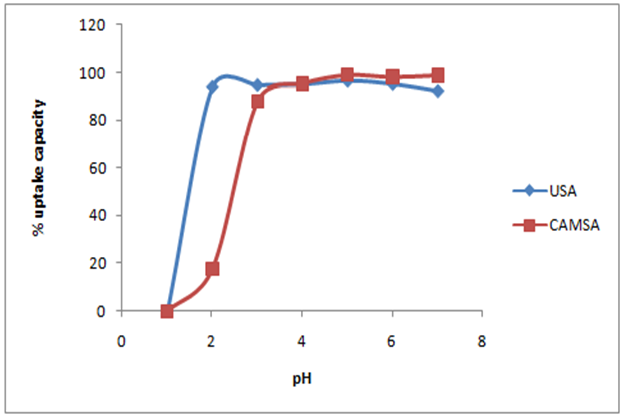 | Figure 3. The effect of pH on the adsorption of copper on USA and CAMSA. Conditions: Temp= 298 ± 1 K, Co= 20mg/L, agitation speed = 250 rpm |
 | Figure 4. The effect of point of zero charge on the adsorption of copper on USA and CAMSA at 298 ± 1 K |
3.3. Effect of Initial Metal Concentration
- The effect of initial metal concentration on the adsorption of Cu (II) ions is reflected in Fig. 5. The initial Cu (II) ions concentration has significant effect on Cu (II) ions adsorption. Biosorption of Cu(II) ions increased sharply with initial metal concentration where 98.3% of the Cu (II) ions were removed for USA, and 99.6% of the Cu (II) ions were removed for CAMSA.
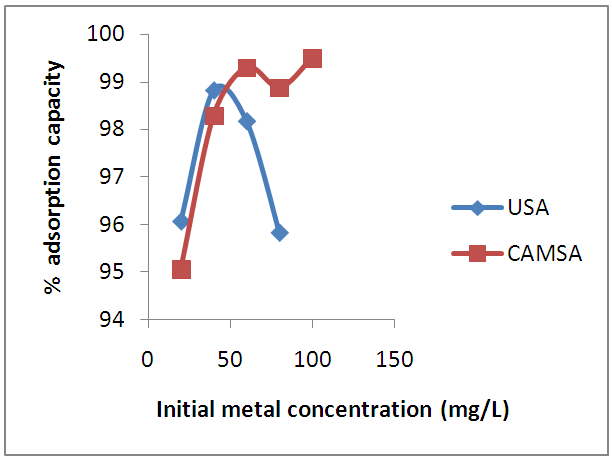 | Figure 5. The effect of initial metal concentration on the adsorption of copper on USA and CAMSA Conditions: Temp= 298 ± 1 K, w= 0.5 g, agitation speed = 250 rpm |
3.4. Adsorption Kinetics
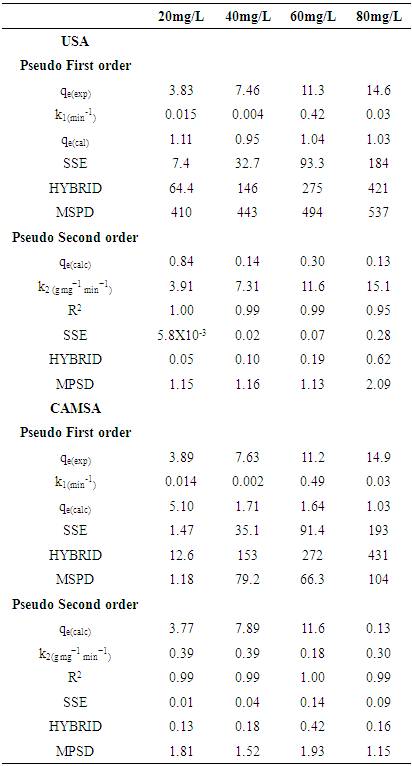
- Two kinetic models, Langergren first-order and pseudo- second order, were used to explain the adsorption of Cu2+ on USA and CAMSA. The equations for the Lagergren first-order (eq. 4) and pseudo- second order (eq. 5) are given below
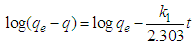 | (4) |
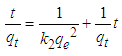 | (5) |
|
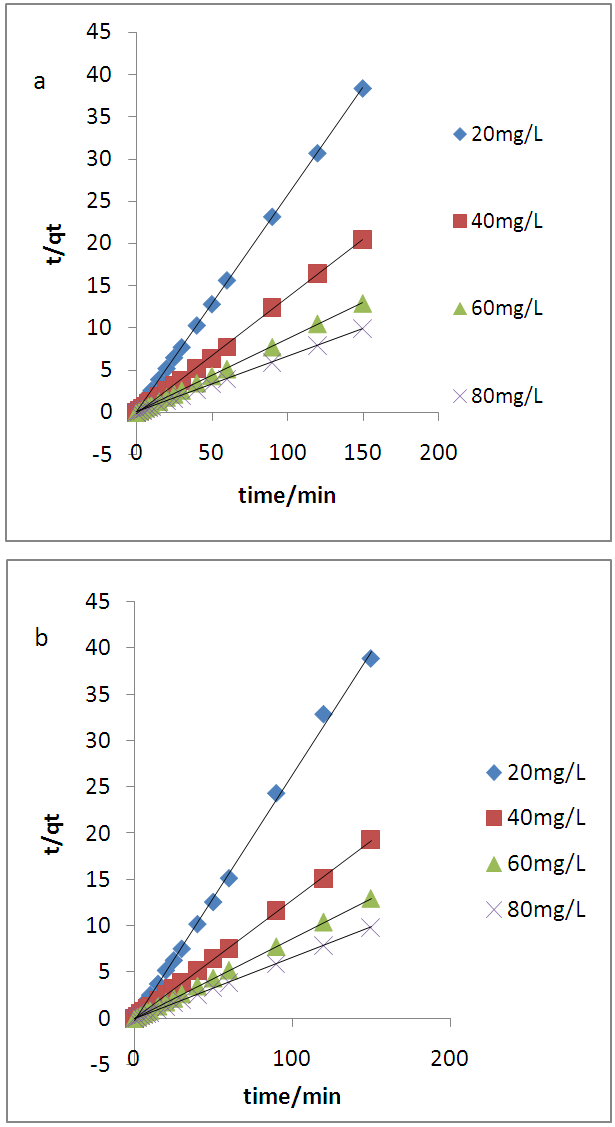 | Figure 6. Pseudo second order kinetics for the adsorption of Cu(II) ions on (a) USA and (b) CAMSA leaves powder. Experimental conditions: biosorbent dosage = 0.2 g, contact time = 150 min, shaking speed =250 rpm, temperature = 298 ± 1K |
|
 | (6) |
 | (7) |
 | (8) |
3.5. Adsorption Isotherms
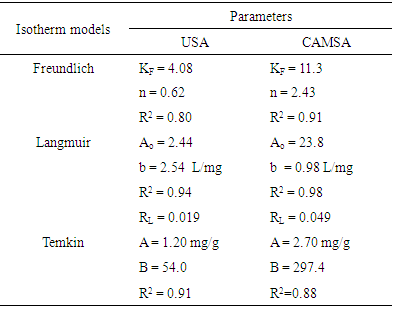
- In this study, Freundlich [17], Langmuir [18] and Temkin [19] isotherms were used to explain the equilibrium adsorption data for the adsorption of copper (II) ions by Senna alata.
3.5.1. The Langmuir Equation
- The assumptions of Langmuir isotherm model are that the removal of the adsorbate takes place on a specific adsorbent surface by uniform monolayer adsorption, all adsorption sites are equivalent and that there is no interaction between adsorbed molecules [20]. The Langmuir equation is given by
 | (9) |
 | (10) |
3.5.2. The Freundlich Isotherm
- The Freundlich isotherm model is an empirical and exponential equation. It is used to describe heterogeneous systems and reversible adsorption and is not restricted to the formation of monolayers [22]. It assumes that increase in the adsorbate concentration increases the concentration of adsorbate on the surface of the adsorbent. Freundlich model is given by
 | (11) |
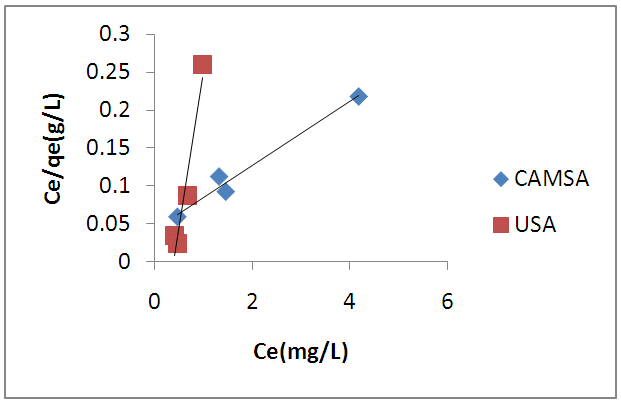 | Figure 7. Langmuir sorption isotherm of copper (II) ions on USA and CAMSA. Experimental conditions: pH 6, temperature, 298 ± 1K, shaking speed = 250 rpm |
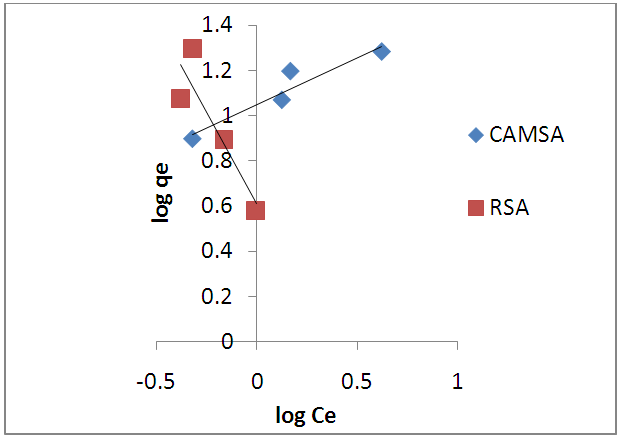 | Figure 8. Freundlich sorption isotherm of copper (II) ions on USA and CAMSA. Experimental conditions: pH 6, temperature, 298 ± 1K, shaking speed = 250 rpm |
3.5.3. Temkin Isotherm
- The Temkin adsorption isotherm equation assumes that there is a linear decrease in the heat of adsorption of all the molecules as the surface of the adsorbent is covered increasingly as a result of the interactions between the adsorbate and adsorbent, and that the binding energies are uniformly distributed up to some maximum binding energy [26]. Temkin model is given by
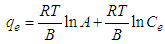 | (12) |
|
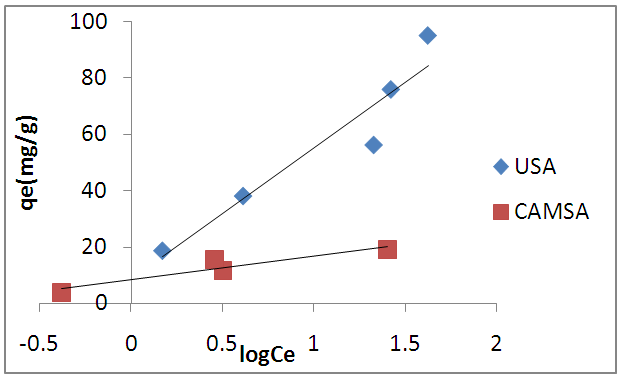 | Figure 9. Temkin sorption isotherm of copper (II) ions on USA and CAMSA. Experimental conditions: pH 6, temperature, 298 ± 1K, shaking speed = 250 rpm |
 | (13) |
3.6. Adsorption Thermodynamics
- The effect of temperature on adsorption was investigated at 303°C, 308°C, 313°C and 318°C at optimum pH 6 with different initial Cu(II) concentration. Percentage removal of Cu(II) ions was increased gradually with rise of temperature from 303 to 318°C for both USA and CAMSA.In addition, as reflected in Figs. 10a and b, increase in concentration increases the adsorption of Cu (II) ions at a fixed temperature. The thermodynamic equilibrium constant, Kd, at the respective temperatures was be evaluated from the equation
 | (14) |
 | (15) |
 | (16) |
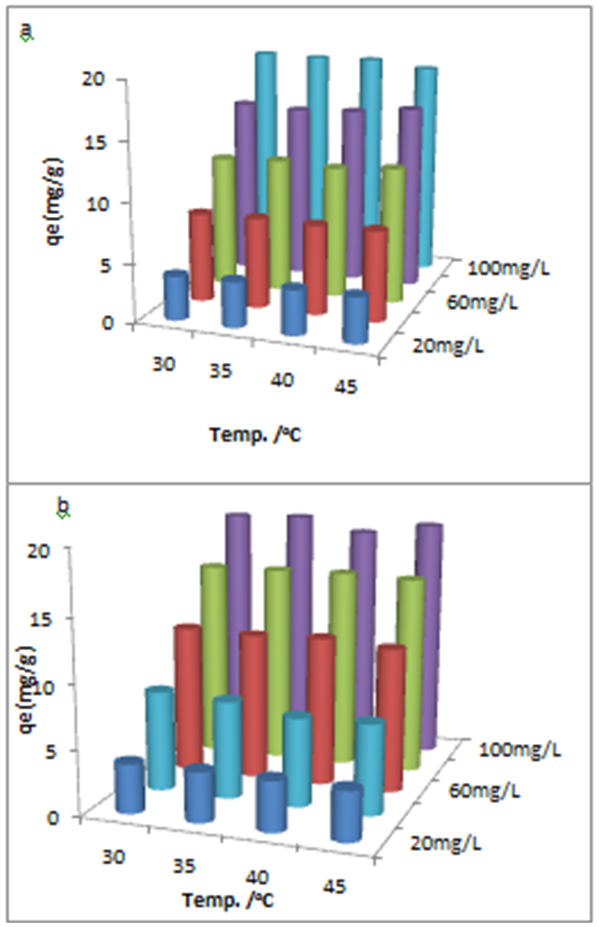 | Figure 10. Effect of adsorption capacity and initial concentrations on the temperature for the adsorption of Cu(II) ions on (a)USA and (b)CAMSA |
|
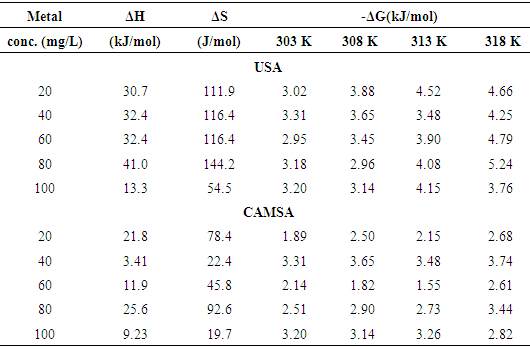
 is positive for both USA and CAMSA which is an indication that the sorption reaction is endothermic. A probable explanation is that there was the hydration of Cu2+ ions and high energy was required to break the hydration covering for adsorption to progress. Thus high temperatures facilitated the dehydration process and consequently, the adsorption process. Similar results were obtained by Chen and Wang [30] and Gupta and Sharma [13]. It can be observed from Table 4 that
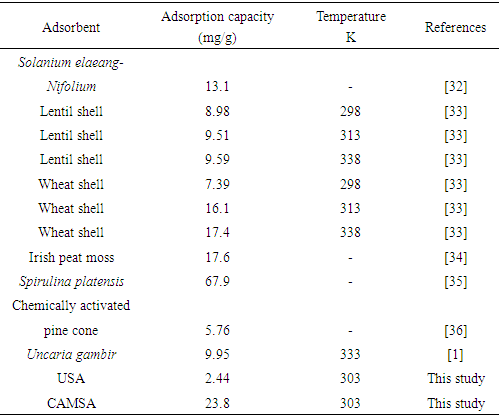
  for USA increases as the concentration increases from 20 to 80 mg/L. The sorption process was achieved at less values of enthalpy change for CAMSA (11.9-25.6 kJ mol-1) than for USA (30.7-41.0 kJ mol-1). This could be attributed to the presence of more available pores for adsorption in CAMSA than in USA. The values of ΔGo at all temperatures studied for both USA and CAMSA as reflected in Table 4 were between -20 to 0 kJ mol-1 which are indications that the sorption process was physisorption. ΔSo reflected the good affinity of adsorbent for adsorbate and increased randomness during the sorption process. Table 5 presents the comparison of adsorption capacities of different adsorbents. From Table 5, USA has the lowest adsorption capacity. On citric acid modification of the USA to give CAMSA, adsorption increased about ten fold. Thus, CAMSA adsorbed more copper than all the adsorbents except for Spirulina platensis (35).
|
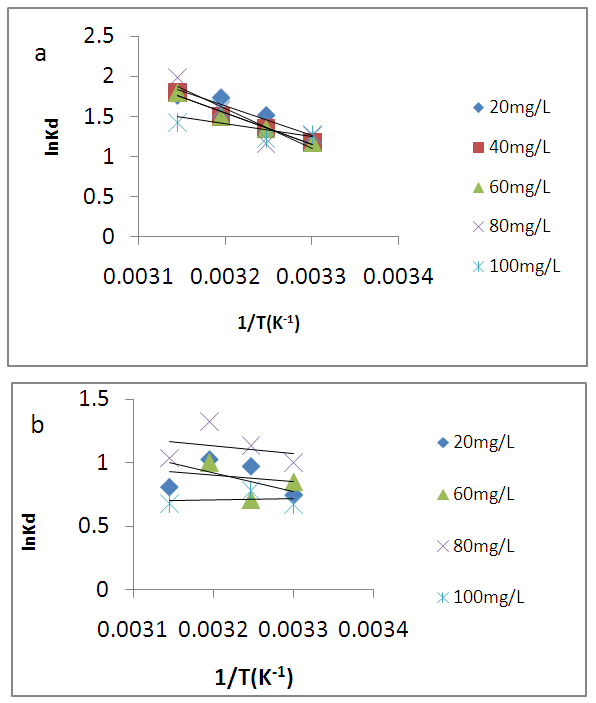 | Figure 11. The plot of lnK against T-1/K-1 for the adsorption of Cu (II) ions on (a) USA and (b) CAMSA. Experimental conditions; pH6, shaking speed 250 rpm |
3.7. Conclusions
- Citric acid modified Senna alata was a good adsorbent for the removal of copper (II) ions. The optimum pH for the removal of the untreated (USA) and modified Senna alata (CAMSA) was coincidentally 5.The pH, PZC, initial concentration and temperature on the adsorption played significant roles in the Cu (II) ions adsorption capacity of Senna alata. The maximum adsorption capability of the adsorption of Cu (II) ions by USA and CAMSA are 2.44 mg/g and 23.8 mg/g respectively. The pseudo-second-order model fitted the experimental data well. Isotherm modeling revealed that the Langmuir equation could better describe the adsorption of Cu on both USA and CAMSA as compared to Freundlich and Temkin models. Negative values of free energy change, ΔG◦, indicated that adsorption of Cu by USA and CAMSA was spontaneous. The thermodynamic study showed that the adsorption processes are random, spontaneous and endothermic.
ACKNOWLEDGEMENTS
- We acknowledge Miss Dorcas Isaac and Mr. S. A. Adeniran for assisting us with the FTIR and AAS respectively.