-
Paper Information
- Paper Submission
-
Journal Information
- About This Journal
- Editorial Board
- Current Issue
- Archive
- Author Guidelines
- Contact Us
Physical Chemistry
p-ISSN: 2167-7042 e-ISSN: 2167-7069
2016; 6(2): 39-48
doi:10.5923/j.pc.20160602.02

Removal of Methyl Orange (MO) from Water by adsorption onto Modified Local Clay (Kaolinite)
 Abstract
 Reference
 Full-Text PDF
 Full-text HTML
Fortunate Phenyo Sejie , Misael Silas Nadiye-Tabbiruka
Department of Chemistry, University of Botswana, Gaborone, Botswana
Correspondence to: Misael Silas Nadiye-Tabbiruka , Department of Chemistry, University of Botswana, Gaborone, Botswana.
| Email: |  |
Copyright © 2016 Scientific & Academic Publishing. All Rights Reserved.
This work is licensed under the Creative Commons Attribution International License (CC BY).
http://creativecommons.org/licenses/by/4.0/

The kinetics and thermodynamics of the removal of methyl orange from water, by using kaolinite clay from Lobatse, was investigated spectrophotometrically using the batch technique. The adsorption rate and the capacity increased with increasing initial MO concentration, with decreasing solution pH and with decreasing temperature indicating a physisorption process. The adsorption kinetics data fitted the pseudo second order model best. However, the possibility of a three body collision mechanism at the rate determining step was discounted on grounds of very low probability. Instead two simultaneous two body collisions mechanism at the rate determining step was preferred as it has a higher probability. The two simultaneous body collisions were identified as the adsorption of the dye on the external, and on the internal surfaces of Lobatse clay. The external surface is thought to be the virgin unhidden surface while the internal surface is either in pores or in the narrow gaps between adsorbed molecules on the pre-adsorbed surface. Results from the thermodynamic study fitted the Freundlich model best indicating heterogeneity of the surface of the clay sample.
Keywords: Adsorption, Methyl orange, Lobatse clay, Kinetics, Thermodynamics
Cite this paper: Fortunate Phenyo Sejie , Misael Silas Nadiye-Tabbiruka , Removal of Methyl Orange (MO) from Water by adsorption onto Modified Local Clay (Kaolinite), Physical Chemistry, Vol. 6 No. 2, 2016, pp. 39-48. doi: 10.5923/j.pc.20160602.02.
Article Outline
1. Introduction
- Purification of water can be achieved by using a variety of methods including coagulation, flocculation, ozonation, reverse osmosis, and adsorption [1]. The method of choice is determined by the type of contaminant to be removed. Several water contaminants/pollutants are chemicals that are useful in industries like pharmaceutical, food, laboratory printing and textile industries [2-6]. Organic compounds are major pollutants used in the mentioned industries especially the synthetic dyes. A variety of azo dyes find use in the food and textile industries. However, most of these dyes are highly carcinogenic even when present in minute quantities.Methyl orange is a carcinogenic water soluble azo dye which is widely used in textile industries, in manufacturing printing paper, and in research laboratories. It is also metabolised into aromatic amines by intestinal microorganisms [7, 8]. Methyl orange is stable, shows low biodegradability and is soluble in water hence it is difficult to remove from aqueous solutions by common water purification/treatment methods [9]. Clays contain minerals which are responsible for their properties. Clay minerals are widely used in several industries and fields such as in polymers nano-composites adsorbents fields, in heavy metal ion adsorption, ceramics, and paper fillings [10-12]. These minerals are made up of tetrahedral and octahedral layers and hence they are characterised by the ratio of this sheets/ layers in the structure. A clay made up of 2 tetrahedral sheets and 1 octahedral sheet it is referred to as a 2:1 clay type (3 sheets) while those with 1 octahedral sheet and 1 tetrahedral sheet are called 1:1 (2 sheets) clay types [13-19]. Clay minerals in soil may play a role in scavenging of pollutants from water. The commonly used clays include montmorillonite, semectites kaolinite and illite.
2. Experimental
2.1. Materials
2.1.1. The Adsorbent
- The powdered clay obtained from Lobatse Clay Works which is near Lobatse town in southern Botswana, was mixed with excess deionised water and stirred for 48 hours. It was then allowed to settle for 24 hours. The top water layer as well as the top fine particles were decanted and filtered under vacuum. The clay was leached with 2M Oxalic acid for 2 hours at 371K to remove metal ferrous ions which absorb at the same wavelength as the investigated dye. The acid was filtered off and the clay was washed with deionised water until the filtrate no longer formed a precipitate with sodium hydroxide. The Clay was dried in an oven at 383.15K and stored in a desiccator. FTIR, ESEM and XRPD analysis techniques were employed to characterise the powder.
2.1.1.1. Characterisation of the Adsorbent
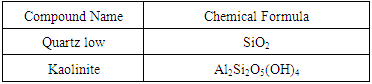
- X-Ray Powder DiffractionThe spectrum shows the clay to be highly crystalline as the peaks are narrow. The main peaks at 2θ=20.89° and 26.65° are characteristic bands for quartz SiO2 which is a silica polymorph consisting of interconnected SiO2 tetrahedral that build up a rigid three-dimensional network. The peak at 2θ=12.41° and 50.13° are characteristic of a kaolinite clay mineral. From this XRPD analysis, Lobatse clay is a crystalline silicate Kaolinite of chemical formulae Al2Si2O5(OH)4 mixed with interconnected quartz SiO2. The identified phases are represented in table 1 below.
|
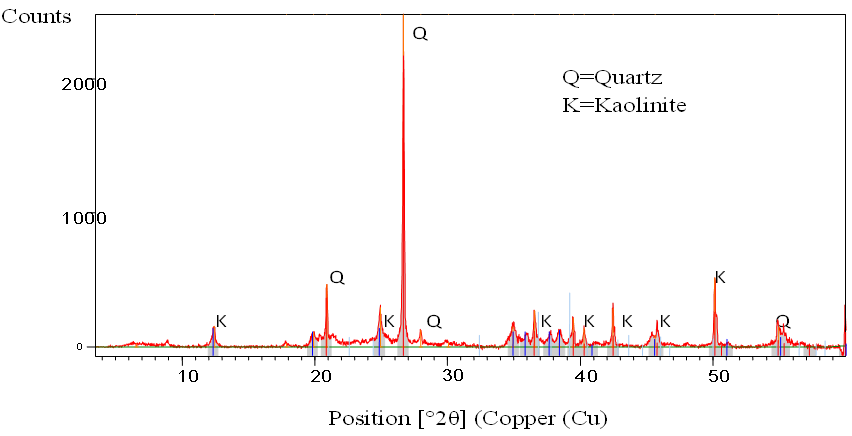 | Figure 1. Shows the XRPD spectrum of Lobatse clay |
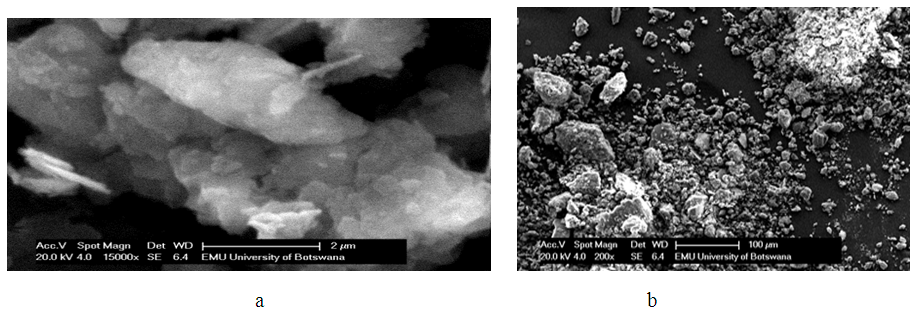 | Figure 2. a and b SEM micro structures of Lobatse clay |
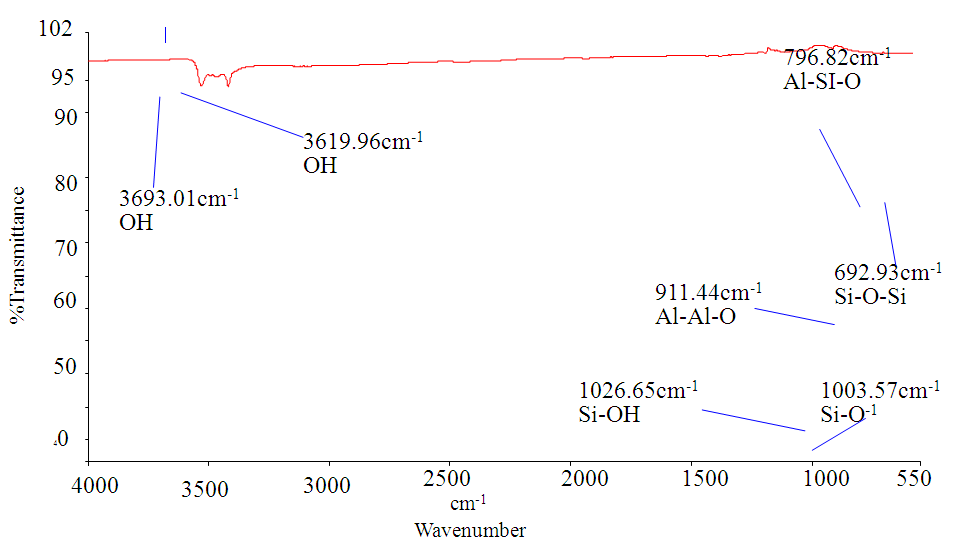 | Figure 3. FTIR Spectrum of Lobatse clay |
2.1.2. The Adsorbate (methyl orange MO)
- Methyl orange (Anionic, water soluble azo dye) powder (C14H14N3NaO3S, figure 4) supplied by SAARCHEM, South Africa was used without any further purification. A solution of the dye was made by dissolving a known weight into double distilled de-ionised water. Other required dye concentrations were prepared by serial dilution. Several of these concentrations were used to obtain calibration a curve of absorbance against concentration at a predetermined wavelength at maximum absorbance λ=463 nm using a UV-Visible spectrophotometer spectronic 20. This wavelength was determined by scanning and plotting the absorbance for all the wavelengths on the machine using methyl orange solution. Measurements of absorbance at a wavelength maximum improves the sensitivity and hence the accuracy of the machine. Exact concentrations were then determined from this calibration curve.
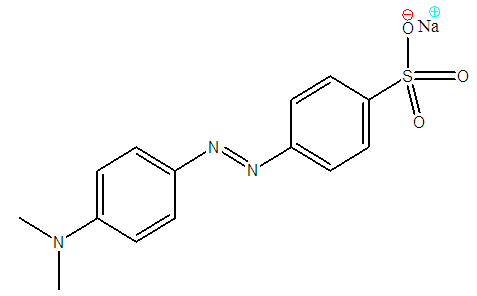 | Figure 4. Methyl orange structure |
2.2. Procedure
2.2.1. Adsorption Kinetics’ Studies
- 1.5g of powdered clay was added to 150ml of MO solution in a screw capped bottle contained in a water bath at constant temperature, and adsorption time was recorded. Samples of the supernatant liquid were drawn off after predetermined time intervals, filtered using an appropriate filter paper and their absorbance were taken using a UV/VIS spectrophotometer at a wavelength of 463 nm. The amount adsorbed was obtained by difference from the initial concentrations and plotted against time. The experiment was repeated for various MO concentrations, reaction temperature and pH.
2.2.2. Adsorption thermodynamics Studies
- In this section, a batch technique was used. Lobatse clay (0.5 g) was added to each of several 250 mL screw capped bottles containing 50 ml of methyl orange of different initial concentrations. The bottles were kept in a thermostatic water bath shaker at a speed of 220 rpm for 3.8 hours at constant temperature. After the samples had reached equilibrium, the Solutions were filtered using 0.45 μm filter paper and their residual concentrations were determined spectrophotometrically as before. The amount adsorbed at equilibrium, qe (mol/g), was calculated by using equation 1 below:
 | (1) |
3. Results and Discussion
3.1. Adsorption Kinetics Analysis
3.1.1. Lagergren Pseudo 1st Order Model
- Lagergren first-order rate equation is the earliest known model describing the adsorption rate based on the adsorption capacity [21]. The equation representing this model is:
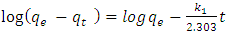 | (2) |
 is the pseudo first order rate constant in g/mg* minqe is the amount adsorbed at equilibriumqt is the amount adsorbed at time tt is the timeA plot of
  against t will give a straight line and
  can be determined from the slope and
  from the intercept. The straight line shows that adsorption onto the adsorbate (solid) follows the pseudo first order model kinetics. The parameters that can be derived from this model are the rate constant the theoretical and the equilibrium amount adsorbed qe.Figure 5 show the Lagergren pseudo first order model plot for MO adsorption onto Lobatse clay at various temperatures. The plot gives two straight line segments for the temperature range 288K-318K indicating that two processes are operating. There is a faster process dominating the period from 0-5 minutes then a slower process which dominates thereafter. The first section can be related to the binding of methyl orange to the most active sites on the external surface of the adsorbents while the second longer linear segment can be associated to the same process that is pseudo first order kinetics of adsorption of the dye molecules onto the internal or less accessible surface of the adsorbents [22-28].
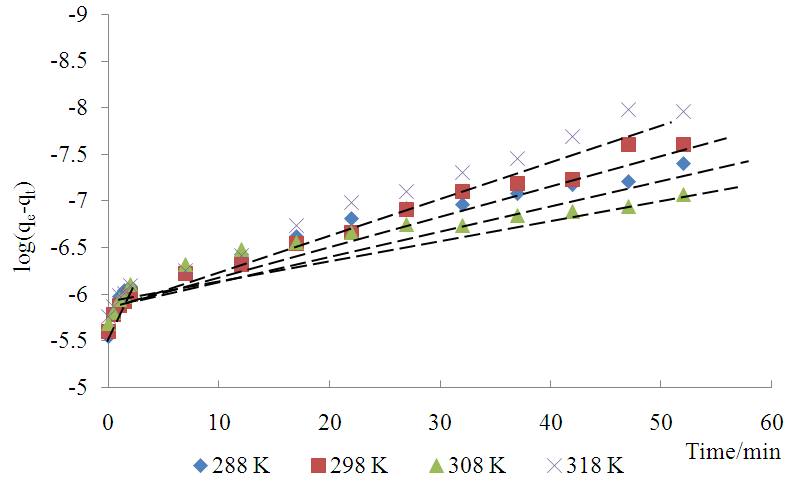 | Figure 5. Lagergren pseudo first order plot for MO adsorption onto Lobatse clay |
3.1.2. Lagergren Pseudo Second Order Model
- Pseudo-second-order rate expression is mostly used in an attempt to describe adsorption process. It has been widely applied to the adsorption of pollutants from aqueous solutions.This model is represented by the equation
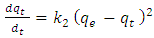 | (3) |
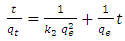 | (4) |
 is the pseudo first order rate constant in mol/g min
 is the amount adsorbed at equilibrium
 is the amount adsorbed at time tt is the adsorption timeThis equation is only applicable if a plot of
  against t gives a straight line from which
  and the theoretical equilibrium amount adsorbed can be determined. The fitting of the kinetics data onto the pseudo second order is shown in Figure 6.
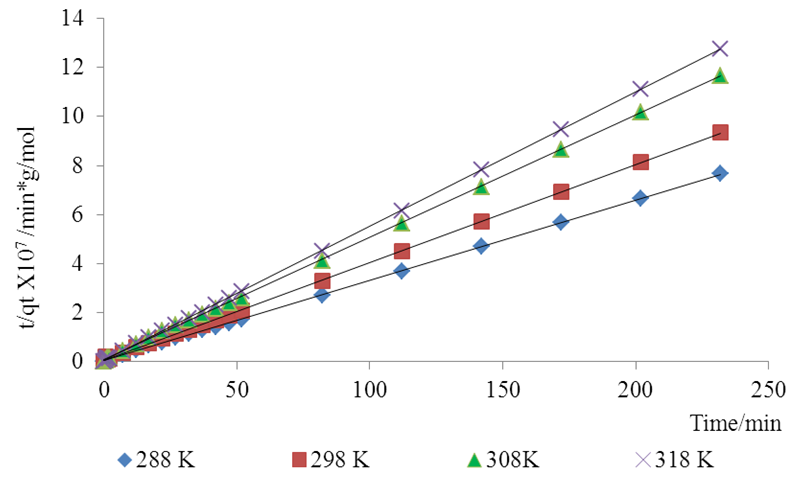 | Figure 6. Lagergren pseudo second order Kinetic model plot for the adsorption of methyl orange onto Lobatse clay 5.49 × 10⁻⁵ M pH 7.18 10 g/L sorbent dosage |
3.1.3. Effect of Varying Concentration on the Adsorption Process
- The effect of varying concentration on methyl orange adsorption kinetics was investigated in the concentration range 1.02×10⁻⁴ M to 1.56×10⁻⁵ M, at pH 7.18, 298K and sorbent dosage of 10gL-1. Figure 7 presents the kinetics data at 298K. Clearly, at all concentrations, the process is at equilibrium within fifty minutes, with the higher concentrations taking longer and giving a higher adsorption capacity than the lower concentrations.
 | Figure 7. Effect of varying initial molar concentrations on the adsorption of MO onto Lobatse clay at 298K, pH 7.18 and sorbents dosage of 10gL-1 |
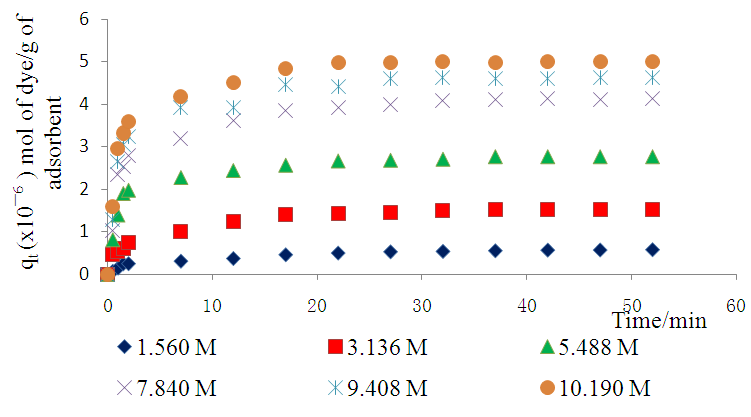
3.1.4. Effect of Varying Temperature on the Adsorption Process
- Increase in the temperature from 288K-318K lead to a decrease in the adsorption capacity, as shown in figure 8, indicating possibilities of reversible adsorption process [20].
 | Figure 8. Effect of Temperature (K) on the adsorption of methyl orange onto Lobatse clay, 5.49× 10⁻⁵ M, pH 7.18 and sorbent dosage 10gL-1 |
3.1.5. Effect of Varying pH on the Adsorption Process
- A change in the pH of the solution affects both the dye structure and the surfaces of the adsorbent. This should in turn lead to a change in the adsorbents sorption rate and capacities.As seen in figure 9 the adsorption of methyl orange onto the clay increases as pH is lowered from 12 to 4.
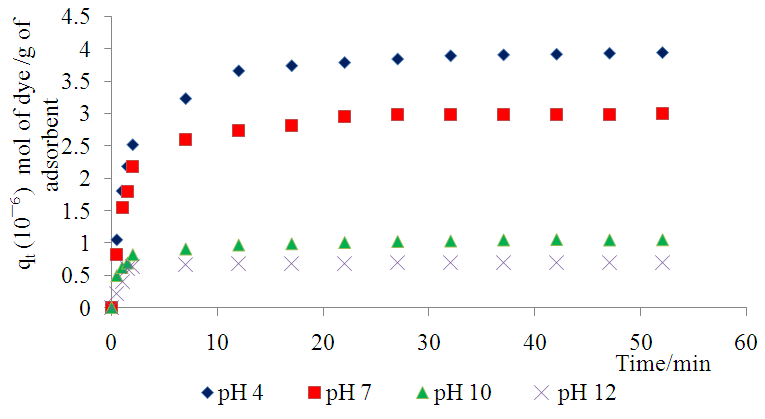 | Figure 9. Effect of varying pH on the adsorption of Methyl Orange onto Lobatse clay 5.49× 10⁻⁵ M, 298 K and sorbent dosage 10gL-1 |
3.1.5.1. Effect of pH on the Structure of the Dye
- As pH is increased to more basic conditions, the double bond conjugation is lost and a proton is lost, and the molecule rearranges to form a negatively charged species (figure 10a). The positive charges have been neutralized. Due to excess anions in the solution, there will be repulsion of the dye by the negatively charged surfaces of the adsorbents, also an increase in pH leads to the modification of the pi (Π) system delocalization pattern. In the literature, the uptake of methyl orange on several adsorbents was similarly found to be favoured at lower pH (acidic medium). Furthermore, at lower pH, the surface of the adsorbent was found to be activated by the acid in solution and the dye became protonated thus enhancing adsorption process.At lower pH Methyl orange assumes the structure shown in figure 10.
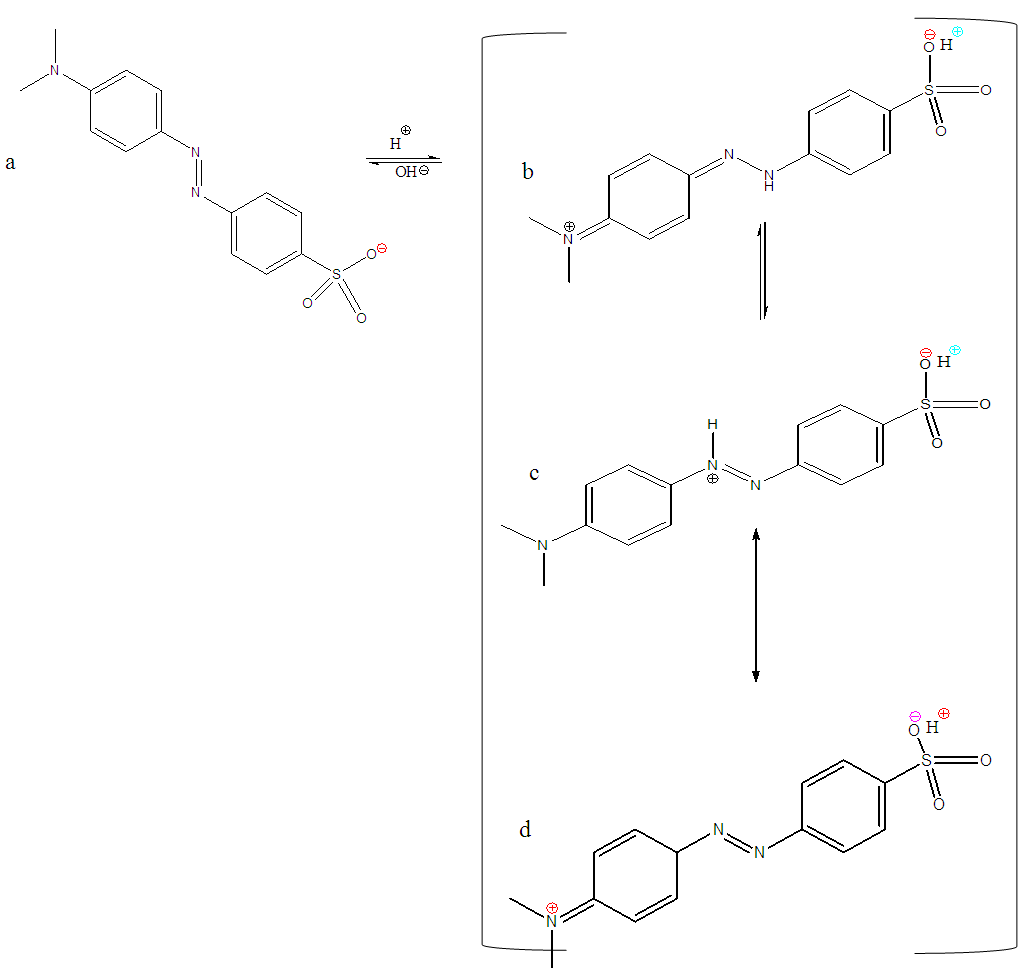 | Figure 10. Alkaline form of Methyl orange (a) and its mono-protonated zwitter ionic structures under acidic conditions (b, c and d) |
3.1.5.2. Effect of pH on the Structure of the Dye
- As the pH is increased to more basic conditions, the double bond conjugation is lost and a proton is lost, and the molecule rearranges to form a negatively charged species as shown in figure 8 above. The positive charges have been neutralized. Due to excess anions in the solution, there will be repulsion of the dye by the negatively charged surfaces of the adsorbents.
3.2. Thermodynamics’ Analysis
- Interaction of adsorbate with adsorbents can be investigated by plotting adsorption isotherms. In the current case equilibrium adsorption is plotted against concentration at constant temperature. The data obtained can then be fitted on various models to obtain a comprehensive understanding of the nature of the interactions involved.
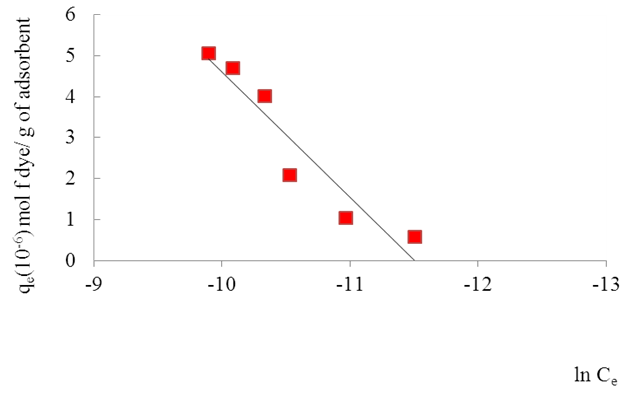
3.2.1. Freundlich Isotherm
- Freundlich (1906) established an empirical relationship between the equilibrium amounts adsorbed qe and their equilibrium concentrations Ce. It has now been shown to represent non-ideal adsorption onto heterogeneous surfaces of adsorbents; thus:
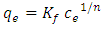 | (5) |
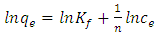 | (6) |
 | Figure 11. Freundlich Isotherm for the adsorption of Methyl orange Lobatse clay |
3.2.2. Temkin Model
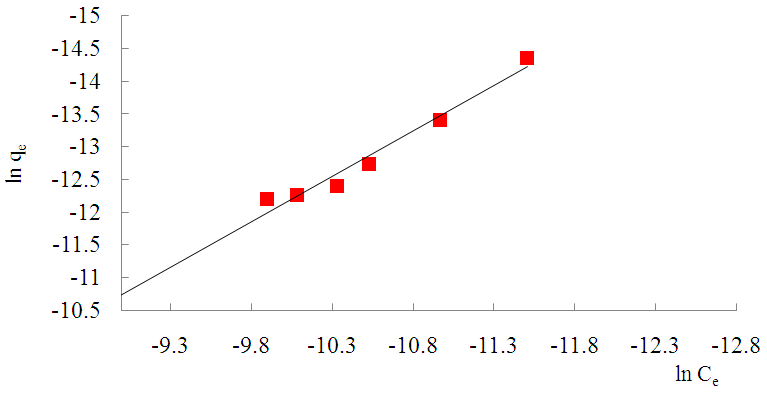
- Temkin and Pyzhev’s adsorption model based on the effect of indirect adsorbent -dye interactions on adsorption leads to, the heat of adsorption of all the molecules in a layer decreasing linearly with surface coverage.The quantity adsorbed at equilibrium qe is related to equilibrium concentration ce by the equation 7 below Which linearizes to equation below. And a plot of qe against ln Ce gives the heat of adsorption from the slope and the equilibrium binding constant from the intercept. A small value of the parameter b model indicates a physisorption process.
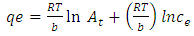 | (7) |
 | Figure 12. Temkin model for the adsorption of the dye onto the clay |
|
 was found to be 1.3880. This value is higher than 1 which indicates cooperative adsorption [36-38], and confirms heterogeneity which probably originates from the rough irregularities of the surface as shown by the SEM micrograms (see Figure 2).
4. Conclusions
- It was found that adsorption attains equilibrium within 50 minutes. The adsorption rate process is best described by the Lagergren pseudo second-order rate model. Adsorption of Methyl orange onto the clay increases with decreasing temperature, with decreasing pH and with increasing concentration, as expected from the law of mass action, in the range studied. The decrease of adsorption with increasing temperature is thought to be due to weak attraction between the dye molecule and the surface originating from the weak Van der Waal’s forces. This is indicative of physical adsorption. The increase of adsorption with decreasing pH is believed to originate from the increased concentration of MO cationic species resulting from the protonation of the nitrogen atoms in the MO molecule in acid conditions. It is recommended that the surface area and pore-size distribution of the clay be obtained from nitrogen gas adsorption to gage its current capacity and then improve on it as well as on the accessibility of the adsorbent by activation and grinding the clay to nano particle size. This will not only increase its surface charge density but also its accessible surface area and porosity thus enhancing its water purification application.
ACKNOWLEDGEMENTS
- The authors wish to acknowledge the services and contributions from the University of Botswana, Department of Chemistry for financing this research project and providing laboratory space. The contribution from the technical staff in the Chemistry department is highly appreciated.