-
Paper Information
- Paper Submission
-
Journal Information
- About This Journal
- Editorial Board
- Current Issue
- Archive
- Author Guidelines
- Contact Us
Physical Chemistry
p-ISSN: 2167-7042 e-ISSN: 2167-7069
2016; 6(2): 33-38
doi:10.5923/j.pc.20160602.01

Study in the Solvent Polarity Effects on Solvatochromic Behaviour of Pomiferin
 Abstract
 Reference
 Full-Text PDF
 Full-text HTML
Erol Tasal1, Ebru Gungor2, Tayyar Gungor2
1Physics Department, Eskisehir Osmangazi University, Eskisehir, Turkey
2Energy Systems Engineering Department, Mehmet Akif Ersoy University, Burdur, Turkey
Correspondence to: Ebru Gungor, Energy Systems Engineering Department, Mehmet Akif Ersoy University, Burdur, Turkey.
| Email: |  |
Copyright © 2016 Scientific & Academic Publishing. All Rights Reserved.
This work is licensed under the Creative Commons Attribution International License (CC BY).
http://creativecommons.org/licenses/by/4.0/

Solvent polarity is very important considering the coulombic and dispersive interactions between the charge distribution in the solubility and the polarizability of the solvent. Therefore, the solvatochromic properties of pomiferin molecule in solvents of different polarities has been investigated. So, the electronic absorption of pomiferin molecule at room temperature was analyzed by using some physical parameters such as refractive index, dielectric constant, Kamlet–Taft parameters  (hydrogen bond donating ability) and
  (hydrogen bond accepting ability). The absorption spectra were decomposed by using multiple peak analysis. It was obtained that some solvents indicated a good linearity for hydrogen-bond acceptor basicity parameter,refractive index and dielectric constant with respect to wavenumber. This showed that the hydrogen-bond acceptor basicity parameter is the most important parameter for both dissociation and complex formation reactions, and the hydrogen bonding acceptor ability and the induction-dispersive forces of solvent molecules have caused the bathochromic shift in absorption maxima of pomiferin molecule.
Keywords: Solvatochromism, Solvents, Polarity, Pomiferin, Absorption
Cite this paper: Erol Tasal, Ebru Gungor, Tayyar Gungor, Study in the Solvent Polarity Effects on Solvatochromic Behaviour of Pomiferin, Physical Chemistry, Vol. 6 No. 2, 2016, pp. 33-38. doi: 10.5923/j.pc.20160602.01.
Article Outline
1. Introduction
- Pomiferin molecule is known to exhibit solvatochromic behavior and find various pharmaceutical applications. Flavonoid compounds, such as pomiferin extracted from different parts of Derris Malaccensis (Leguminosae) and Maclura Pomifera (Moraceae), isopomiferin, isolated from these plants have biologically significant properties. They have intensive attention due to their widespread range of applications about their antidiabetic and antioxidant capabilities [1-9]. Especially, pomiferin can be used as potential antidiabetic drugs [10-17]. The pomiferin has positive effects for the suppression of oxidative stress and this correlates with improved ventricular function [18], and also protective antioxidative and antidiabetic effect [19]. In addition, the relationship between the antioxidant effect and the dose of pomiferin during a prophylactic administration has been investigated [20]. There are some studies on the effect of maclura pomifera extract upon the spermatological parameters in Cisplatin (anti-tumoural chemotherapeutic with reactive oxygen species (ROS) generating side effects) treated rats [21]. Pomiferin could inhibit cell viability, CD133+ cell population, sphere formation, and invasion ability of glioma neurosphere cells [22]. Pomiferin is also increased collagen expression in ex vivo hair follicles [23].Ultraviolet–visible (UV-Vis) spectroscopy is proven as a convenient technique to study electronic absorption properties of the molecule and to understand the solvent effect on various polarity scales such as refractive index n, dielectric constant ε, Kamlet–Taft parameters
 (hydrogen bond donating ability) and
  (hydrogen bond accepting ability). In this paper, we defined several macroscopic solvent parameters at room temperature and examined their different influences on the electronic absorption spectra giving information on the intermolecular interactions in solution [24-26].
2. Materials and Method
2.1. Experimental Details
- In order to obtain the pomiferin material maclura pomifera fruits were used as source materials. They were rinsed and dried at room temperature and then chopped into the little pieces. Details of the synthesis process of pomiferin were given by Küpeli [11]. The synthesized Pomiferin was dissolved in thirteen solvents. The organic solvents (Sigma-Aldrich Co.) as dimethyl sulfoxide (DMSO), methanol (MeOH), ethanol (EtOH), 2-propanol, iso-butanol (2-methyl-1-propanol), tetrahydrofuran (THF), ethyl acetate, chloroform, toluene, benzene, carbon tetrachloride (CCl4), 1,4-dioxane, cyclohexane of analytical grade were used. Each solution of 2.10-5 M concentration was prepared. The electronic absorption spectra of the samples were obtained by a Shimadzu UV-2550 spectrophotometer at room temperature using 1cm-quartz cells.
2.2. Procedure of Multiple Linear Regression Analysis
- Electronic absorption peak position expressed as suitable combination of solvent parameters provides to characterize the specific interactions. Therefore, the Kamlet–Taft parameters such as hydrogen bond donating ability
 and hydrogen bond accepting ability
  as well as refractive index (n), and dielectric constant
  were used. The solvent parameters, the electronic absorption maxima in terms of λ with the calculated (νcalc) and experimental wavenumbers (νexp) are given in Table 1. The peak positions were labeled as
  (i = 1, 2, 3, 4). These positions obtained by using multi-Gaussian peak analysis in the electronic absorption spectra are given in Table 2. To understand the solvent effects on these parameters, the electronic polarizability function f(n) = (n2-1) / (n2 +1) and polarity function
 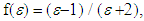 respectively [26] were examined. The solvent dependent absorption band position, νmax, expressed as a multiple linear function of the parameters is as follows;
 | (1) |
|
|
|
3. Results and Discussion
3.1. Analysis of Electronic Absorption Spectra for Pomiferin Molecule
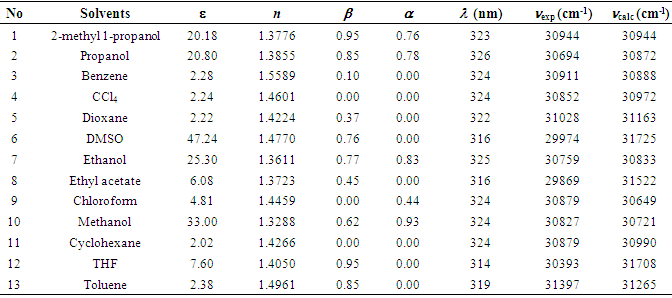
- The electronic absorption characteristics of the pomiferin whose structural characteristics are known [27] were studied. The molecular structure of pomiferin was shown in Fig.1 [11]. The electronic absorption spectra of the pomiferin molecule in apolar, polar protic and polar aprotic solvents were given Fig. 2, Fig. 3. and Fig. 4, respectively. Although twenty-one solvent with different polarity were used, the spectra of thirteen were taken into account. These spectra appeared to be composed of nested peaks. Therefore, the multi-Gaussian peak analysis was performed for the peaks observed on the absorption spectra. For example, multiple peak analysis for CCl4 solvent was shown in Fig. 5. It was observed that absorption spectrum usually consisted of three or four sub-peaks (Table 2). While the lowest and the highest peak wavelength values among the sub-peaks remained in the spectrum tails, other peaks centered at around 320 nm and 360 nm were due to
 and
and  transitions, respectively.
 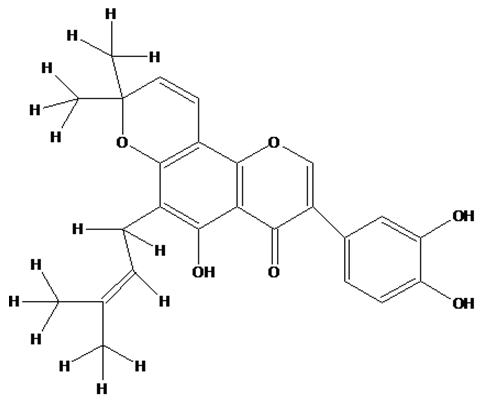 | Figure 1. Molecular structure of pomiferin [11] |
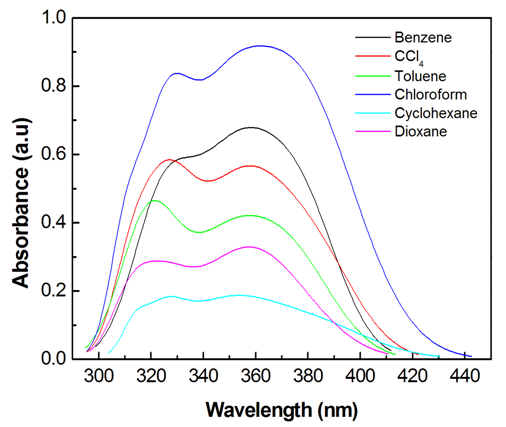 | Figure 2. UV- Vis absorption spectra of pomiferin molecule in apolar solvents |
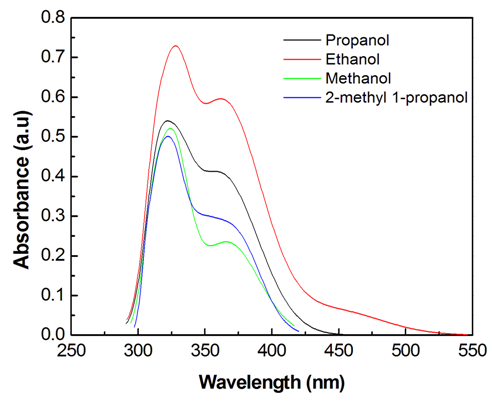 | Figure 3. UV-Vis absorption spectra of pomiferin molecule in polar protic solvents |
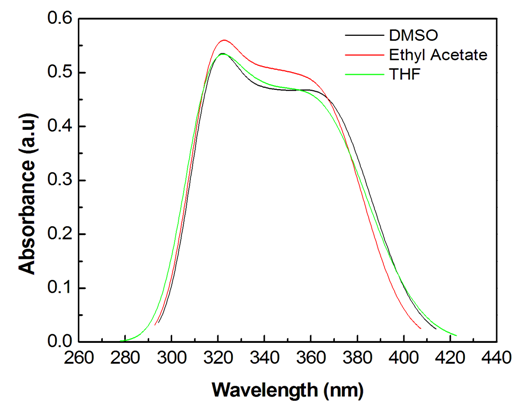 | Figure 4. UV- Vis absorption spectra of pomiferin molecule in polar aprotic solvents |
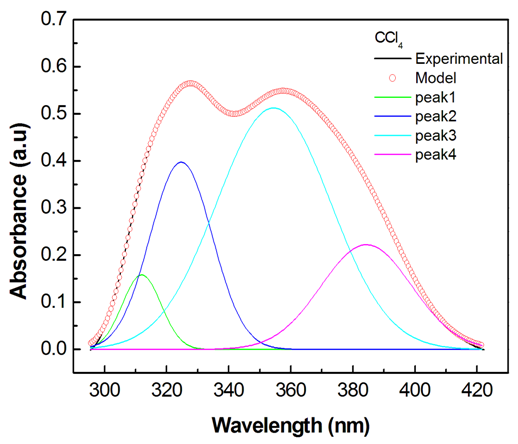 | Figure 5. Multi-Gaussian peak analysis for pomiferin molecule in CCl4 |
3.2. Multiple Linear Regression Analysis for  Transition
- The solvent parameter effects on the spectral changes of pomiferin were evaluated by using the suitable combinations of the parameters. With these solvents such as CCl4, ethyl acetate, chloroform, cyclohexan, THF, toluene taken into account, it was observed that there is a good correlation (R=0.962) between νmax and f(n) for pomiferin (Fig. 6). This result suggests that f(n) plays an important role in determining the spectral shifts for the solvents given above.
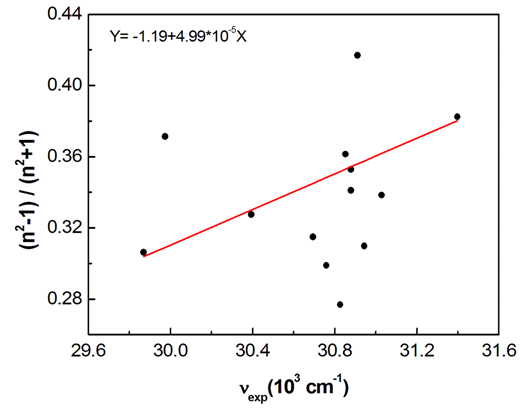 | Figure 6. A plot of refractive index function (f(n)) vs wavenumbers in the π-π* absorption band of pomiferin molecule. Only apolar solvents among the other solvents give a linear correlation |
 absorption band of pomiferin depends linearly on the dielectric function f(ε) of solvents. However, a good correlation (R=0.999) is seen between νexp and f(ε) for propanol, ethanol, ethyl acetate, and methanol. H-bonding acceptor ability of the solvents
  does not correlate with the wavenumber in the maximum of the
  absorption band of pomiferin, whereas there is a good correlation (R=0.994) between
  and νexp of pomiferin for the propanol, dioxane, ethanol and methanol (Fig. 8). Most of the
  values for the solvents are zero and just three non-zero of them (propanol, ethanol, methanol) show good linear behaviour (R=0.984). Therefore, H-bonding donor ability of the solvents
  does not correlate with the wavenumber in the maximum of the
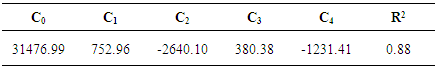
  absorption band of pomiferin. There is no remarkable dependency for the possible binary and ternary combinations of the parameters. However, considering all the parameters take into account there is a good correlation. As a result of multiple linear regression techniques R2 is 0.88 indicating the model accounts for about 90% of the variability in the observations. Fig. 9 exhibits a good correlation between the calculated and experimental wavenumbers of pomiferin in the some solvents.
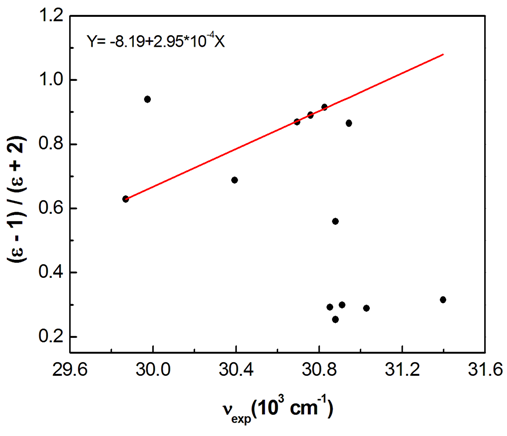 | Figure 7. The polar solvent group give a linear correlation in the plot of dielectric function (f(ε)) vs wavenumbers in the π-π* absroption band of pomiferin molecule |
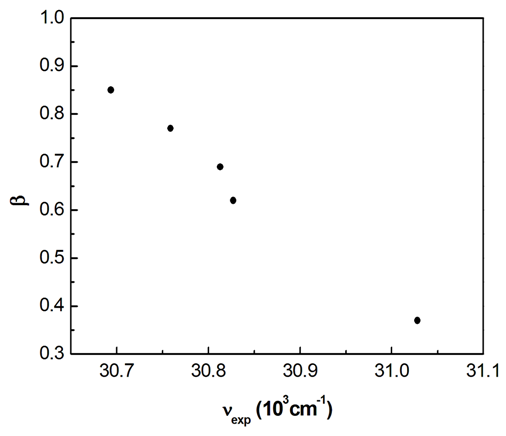 | Figure 8. A plot of β vs wavenumbers in the π-π* absorption band of pomiferin molecule |
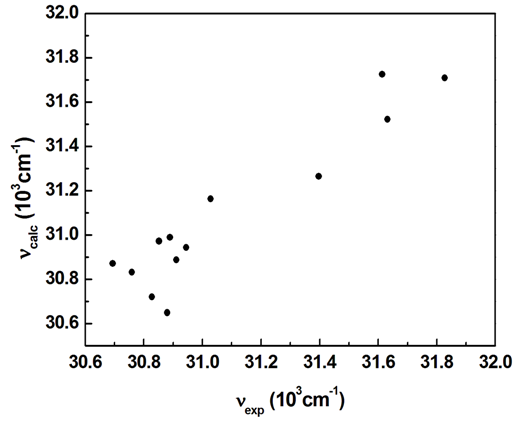 | Figure 9. A plot of calculated wavenumbers (νcalc) vs experimental wavenumbers (νexp) in the maximum of π-π* absorption band of the pomiferin |
 to antibonding orbital
  The
The  transition requires much energy which does not fall in the UV-Vis range. Thus, only
  and
and  transitions occur in the UV-V is region. In addition, the energy gap between
  and
and  is higher than that of between
  Therefore,
 transitions are more favourable than that of
  transitions. Saturated compounds containing unshared electron pairs (lone electron carriers) show
  transitions. However, the transitions can be related to the absorption properties of some chemical groups (chromophores) present in the molecule. A chromophore is a chemical group which absorbs UV-V is radiation at a specific wavelength, with little influence from the other groups in the molecule. Pomiferin has typical chromophores such as C=C double bonds, C=O carboxylic groups and benzene rings (Fig. 1). The chromophores interact with the solvent and with other chromophores. They generally modify position, intensity, and shape of absorption bands. Therefore, we tried to analyze the the solvents effects on the pomiferin using
  absorption band.In the study, the increase in the molar absorbitivity values indicated a hyperchromic shift for pomiferin in apolar solvents such as cyclohexane, dioxane, toulen, CCl4, benzene and chloroform, respectively. In addition, the least polar solvent was cyclohexane but the most polar solvent was chloroform. Considering the multiple peak analysis (Fig.2), main contribution came from two peaks centered at 324 and 346 nm (in cyclohexane), 322 and 358nm (in dioxane), 347 and 374nm (in toluene), 324 and 354nm (in CCl4), 324 and 352nm (in benzene), 324 and 344nm (in chloroform). The peaks centered at 346, 358, 374, 354, 352 and 344 nm were assigned to
  transitions and they did not show a bathochromic shift due to the O-H bondigs (Fig. 1).The polar protic solvent (methanol, ethanol, propanol and 2-methyl 1-propanol) effect was observed that there were two types of behavior in the absorption spectrum of pomiferin (Fig.3). Considering the multiple peak analysis, two main peaks are centered at about 324 nm and 362 nm, the higher one is responsible for the
  transitions. For methanol and ethanol, the maximum value of the peaks at lower wavelength can be distinguished, and for propanol and 2-methyl 1-propanol second maximum peaks at higher wavelength can not be easily distinguished because of broadening. This case is related with the f(ε) and f(n). Both f(ε) and f(n) are very close to each other except methanol. Pomiferin shows a hyperchromic shift for polar protic solvents. The hypsochromic shift is due to the rearrangement of hydroxyl and carbonly bonds which can provide enol-keto tautomeric equilibrium. So, for polar protic solvents the possible different combinations of vinylic hydroxyl groups can cause the hypsochromic shift. For the
  transition, the absorption maxima and wavelength were obtained 0.55 at around 334 nm and 0.48 at around 364 nm. In addition, no significant increase in the absorption intensity and peak position for the polar aprotic solvents such as DMSO, THF and ethyl acetate. It was concluded that the pomiferin was not sensitive hydrogen bonding for polar aprotic solvents.
4. Conclusions
- Electronic absorption spectra showed that solvent polarity effects
 band of pomiferin molecule. The peak positions were obtained using multi-Gaussian peak analysis in the absorption spectra. The main peak observed in the absorption spectrum is composed of sub-peaks. Absorption spectrum usually consists of three or four sub-peaks. Among the sub-peaks, the lowest and the highest peak wavelength values that correspond to parts of the tail of the spectrum, and two peaks centered at around 320 nm and 360 nm are responsible for
  and
and  transitions, respectively. The linear relationship between the refractive index function f(n) and the wavenumber in the maximum of the
  absorption band of pomiferin is dominant for the apolar solvents. The linear relationship between the dielectric function f(ε) and the wavenumber in the maximum of the
  absorption band is dominant for the polar solvent group. Considering parameters obtained from multiple linear regression, it was observed that the effect of the dielectric function in
  transitions is much more than that of the refractive index function (|C1| < |C2|). For pomiferin molecule the |C4| value is bigger than the |C3| value. So,
  electronic transition of the pomiferin occur by the stronger effect of H-bond donor ability in accordance with H-bond acceptor ability. We have observed that the hydrogen bonding acceptor ability and the induction-dispersive forces of solvent molecules have caused the bathochromic shift in absorption maxima of pomiferin molecule. The
  transitions of pomiferin molecule are mainly controlled by global interaction, which is induction-dispersive and orientation interactions.
 ACKNOWLEDGEMENTS
- We are thanks to I.ORHAN for pomiferin molecule from Gazi University (Ankara, Turkey) and Eskisehir Osmangazi University Research Foundation (Eskisehir, Turkey) via Research Project Number, 200819015.