-
Paper Information
- Paper Submission
-
Journal Information
- About This Journal
- Editorial Board
- Current Issue
- Archive
- Author Guidelines
- Contact Us
Physical Chemistry
p-ISSN: 2167-7042 e-ISSN: 2167-7069
2016; 6(1): 11-22
doi:10.5923/j.pc.20160601.02

Kinetic and Adsorption Behaviour of Aqueous Cadmium Using a 30 nm Hydroxyapatite Based Powder Synthesized Via a Combined Ultrasound and Microwave Based Technique
 Abstract
 Reference
 Full-Text PDF
 Full-text HTML
Gérrard Eddy Jai Poinern1, Sridevi Brundavanam1, Suraj Kumar Tripathy2, Mrutyunjay Suar3, Derek Fawcett1
1Murdoch Applied Nanotechnology Research Group, Department of Physics, Energy Studies and Nanotechnology, School of Engineering and Energy, Murdoch University, Murdoch, Western Australia, Australia
2Chemical & Bioprocess Engineering Lab, Center of Industrial Technology & School of Biotechnology KIIT University, Campus-11, Bhubaneswar, Odisha, India
3School of Biotechnology, KIIT University, Bhubaneswar, Odisha, India
Correspondence to: Gérrard Eddy Jai Poinern, Murdoch Applied Nanotechnology Research Group, Department of Physics, Energy Studies and Nanotechnology, School of Engineering and Energy, Murdoch University, Murdoch, Western Australia, Australia.
| Email: |  |
Copyright © 2016 Scientific & Academic Publishing. All Rights Reserved.
This work is licensed under the Creative Commons Attribution International License (CC BY).
http://creativecommons.org/licenses/by/4.0/

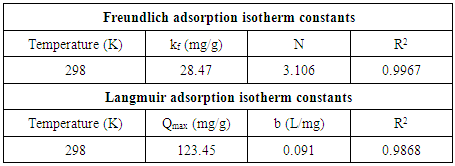
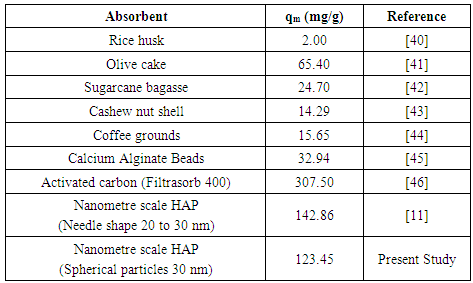
The removal of heavy metals such as cadmium from contaminated waterways and soils is a very important aspect of environmental remediation. This study investigated the kinetic and adsorption performance of a nanometre scale hydroxyapatite (HAP) synthesised from a combined ultrasound and microwave based technique for the removal of cadmium from an aqueous salt solution. Parameters such as contact time, initial pH, initial cadmium concentration and temperature were investigated. The Freundlich isotherm resulted in a more precise modelling of the communicated experimental data. Maximum monolayer adsorption capacity of absorber was found to be 123.45 mg/g at 298 K. Kinetic studies established cadmium adsorption tended to follow a pseudo-second order model and intra-particle diffusion played a significant role in determining the rate. Adsorption was endothermic, spontaneous and resulted in structural changes to the HAP matrix. The structural changes were investigated using both X-ray diffraction and field emission scanning electron microscopy.
Keywords: Nanohydroxyapatite, Adsorption, Cadmium, Ultrasound, Microwaves
Cite this paper: Gérrard Eddy Jai Poinern, Sridevi Brundavanam, Suraj Kumar Tripathy, Mrutyunjay Suar, Derek Fawcett, Kinetic and Adsorption Behaviour of Aqueous Cadmium Using a 30 nm Hydroxyapatite Based Powder Synthesized Via a Combined Ultrasound and Microwave Based Technique, Physical Chemistry, Vol. 6 No. 1, 2016, pp. 11-22. doi: 10.5923/j.pc.20160601.02.
Article Outline
1. Introduction
- Accumulation of heavy metal contaminants in freshwater supplies, effluents, wastewater, and soils is an extremely important environmental problem that threatens the world. Even in small concentrations, heavy metals are extremely hazardous to living organisms due to their toxicity and tendency to accumulate in the food chain [1, 2]. Therefore, the removal of heavy metals from contaminated water sources is a priority issue in many environmental remediation programs worldwide. Heavy metals such as cadmium (Cd), copper (Cu), chromium (Cr), lead (Pb), mercury (Hg), nickel (Ni), and zinc (Zn) are generally considered the major contaminants of surface water, ground water and soils. The main sources of these contaminants are metal plating industries, mining industries and drainage from abandoned disposal sites. In particular, cadmium is highly toxic, very hazardous for aquatic and soil life and is a known carcinogen in humans [3]. Although cadmium can be found in very small quantities in the natural environment, a significant level of this particular harmful metal is potentially released during industrial and mining processes [4]. Three most common modes of non-ecologically friendly metal uptake by the human metabolic system are via nutritional intake, drinking water and inhalation. Inhalation of cadmium produces significant irritation to the respiratory tract and all three modes of consumption lead to anaemia, osteoporosis, osteomalacia, kidney damage and Itai-itai disease [5-7]. In the case of osseous related diseases, it is the remarkable ion exchange capacity of natural hydroxyapatite (HAP) present in bone tissue that permits the replacement of calcium ions with cadmium ions. It is due to this extraordinary ability of HAP to accumulate and bind with heavy metals ions such as cadmium within the body, which produces the serious detrimental effect on the health and well-being of an individual. In the case of environmental remediation of contaminated wastewaters, several processes such as filtration, chemical precipitation, electrochemical deposition, ion exchange, adsorption and solvent extraction have all been extensively used with varying degrees of efficiency and cost effectiveness [8-10]. Chemical immobilization by adsorption is one method for reducing the bioavailability of toxic metals via the formation of new stable minerals with lower solubilities in the environment. Several studies have identified the high adsorption capacity of HAP and its ability to combine especially with divalent heavy metals. It is this property that enables HAP to significantly reduce metal ion concentrations in aqueous solutions [11-14]. HAP is a naturally occurring mineral with a hexagonal crystal structure composed of calcium phosphate groups and has the general formula of [Ca10(OH)2 (PO4)6] for the unit cell. Both chemical and crystallographic studies have also shown that synthetic HAP is similar to the chemical composition of the naturally occurring inorganic component found in teeth and bone tissue [15]. Synthetic forms of HAP have been successfully used in a wide range of applications such as bioceramics for dental and bone repair procedures, absorbents to separate enzymes and proteins during chromatography and as catalysts for dehydrogenation and dehydration of alcohols [16, 17]. The wide range of applications stem from the advantageous surface properties of HAP that include a hydrophilic nature, surface charge, pH, porous structure and 2.6 P-OH surface groups per nm2 which act as sorption sites [18, 19]. It is the sorption properties of HAP that makes it an attractive absorbent material for potential remediation of heavy metal contaminated water, which adds up from the environment naturally or synthesized and disposed as waste industrial process by-products into the ecosystem.The synthesis of nanometre scale crystalline HAP (nano HAP) for use as an adsorbent material has been extensively studied and has resulted in techniques such as emulsions, hydrothermal and solution-gelation being used to produce the material [20-22]. However, wet chemical synthesis offers many advantages due to its straightforward and economically efficient protocols during the process. In particular, one advantage is being able to control size and morphology of the forming particles by varying experimental parameters. It is the control of experimental parameters that directly regulates particle nucleation, aging and growth kinetics. Recent studies have also investigated the use of ultrasonic irradiation during wet chemical synthesis to enhance the manufacture of nanometre scale materials [23, 24]. During ultrasonic irradiation, acoustic cavitations create bubbles that grow and then implosively collapse creating localized hot spots with temperatures as great as 5300 K and pressures around 500 atmospheres. The acoustic cavitations also produce very rapid cooling rates that often exceed 1010 K/s [25]. It is the extreme pressures and temperatures experienced during ultrasonic irradiation that promotes the physical effects and chemical reactions which directly influence the size and morphology of the forming particles [26]. Another technique that has been successfully used to improve the synthesis route is microwave heating that significantly reduces reaction times and increases product yields when compared to conventional heating methods [15, 26, 27]. Therefore, incorporating ultrasonic and microwave based techniques into the wet chemical method offers greater efficiency in manufacturing nanometre scale materials. In this study, solutions containing calcium, hydroxyl and phosphate ions were subjected to ultrasound irradiation to form the initial calcium phosphate compounds. This was followed by thermally treating the compounds in a microwave oven to produce the nanometre scale HAP powders used in characterisation and adsorption studies. The objectives of this study were to first synthesize a nanometre scale HAP powders via a combined ultrasonic and microwave heating based wet chemical method. And secondly, investigate the potential use of the powders as an adsorbent material for the removal of Cd2+ cations from aqueous solutions. The synthesized powders were characterized using X-ray diffraction (XRD), field emission scanning electron microscopy (FESEM), energy dispersive spectroscopy (EDS) and Fourier transform infrared spectroscopy (FTIR). The adsorption capacity of the powders was investigated via the removal of Cd2+ cations from cadmium contaminated water using a batch equilibrium procedure. Both Langmuir and Freundlich adsorption isotherms were used to model the experimental data. While the kinetic behaviour of the adsorption mechanism were studied using Lagergren’s pseudo-first order, McKay & Ho’s pseudo-second order and intra-particle diffusion models. Furthermore, the influence of initial Cd2+ cation concentration, contact time, temperature, solution pH and thermodynamic parameters were all evaluated from the adsorption measurements.
2. Materials and Methods
2.1. Materials
- HAP powders were synthesized from high purity calcium nitrate tetra-hydrate [Ca(NO3)2.4H2O] and potassium di-hydrogen phosphate [KH2PO4], while solution pH was controlled by the addition of ammonium hydroxide [NH4OH]. An Ultrasound Processor [UP50H: 50 W, 30 kHz, MS7 Sonotrode (7mm diameter, 80 mm length)] supplied by Hielscher Ultrasound Technology was used to deliver ultrasound irradiation during HAP synthesis. The source of Cd 2+ ions used in the adsorption studies was high purity cadmium chloride [CdCl2]. All chemicals used in this work were supplied by Chem-Supply (Australia) and all aqueous solutions were made using Milli-Q® water (18.3 MΩ cm-1) produced by an ultrapure water system (Barnstead Ultrapure Water System D11931; Thermo Scientific, Dubuque, IA).
2.2. Synthesis of Nanometres Scale Hydroxyapatite
- The synthesis procedure used to produce the nanometre scale HAP powders was developed by the authors and a detailed description is given elsewhere [15, 24, 28]. However, in the interest of completeness a brief description is presented. The procedure in brief consists of adding a 40 mL solution of 0.32 M calcium nitrate tetra-hydrate into a small glass beaker and then adjusting the solution pH to 9.0 using approximately 2.5 mL of ammonium hydroxide. The solution was then sonicated for 1 h using the Ultrasound Processor set to 50 W and maximum amplitude. During the second hour of ultrasound treatment 60 mL of 0.19 M potassium di-hydrogen phosphate solution was slowly added while the solution pH was maintained at 9.0 and the Calcium/Phosphate [Ca/P] ratio was maintained at 1.67. On completion of the ultrasound treatment, the solution was then subjected to 20 minutes of centrifugation (15,000 g) at room temperature to produce a solid white precipitate. The precipitate was collected, washed and centrifuged for a further 10 minutes. After the second centrifugation, the precipitate was deposited into a fused silica crucible before being placed into a domestic microwave oven for thermal treatment [Set at 100% power for 40 minutes: 1100W at 2450 MHz-LG® Australia]. After thermal treatment, the resultant agglomerated powder was then ball milled until an ultrafine nanometre scale HAP powder was produced.
2.3. Advanced Characterisation Techniques
2.3.1. X-Ray Diffraction (XRD) Spectroscopy
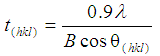
- Powder X-ray diffraction (XRD) spectroscopy was used to examine and identify the purity, crystalline size and phases present in synthesized nanometre scale HAP powders. Spectroscopy data was recorded at room temperature, using a Siemens D500 series diffractometer [Cu Kα = 1.5406 Å radiation source] operating at 40 kV and 30 mA. The diffraction patterns were collected over a 2θ range of 20° to 60° with an incremental step size of 0.04° using flat plane geometry with 2 second acquisition time for each scan. The crystalline size of the particles in the powders was calculated using the Debye-Scherrer equation [Equation 1] from the respective spectroscopy patterns.
2.3.2. Field Emission Scanning Electron Microscopy (FESEM)
- FESEM was used to study the size, shape and morphological features of the HAP powders before and after the adsorption studies. All micrographs were taken using a high resolution FESEM [Zeiss 1555 VP-FESEM] at 3 kV with a 30 µm aperture operating under a pressure of 1.333x10⁻¹⁰ mbar. Samples were mounted on individual substrate holders using carbon adhesive tape before being sputter coated with a 2 nm layer of gold to prevent charge build up using a Cressington 208HR High Resolution Sputter coater.
2.3.3. Energy Dispersive Spectroscopy (EDS)
- EDS was used to provide an elemental analysis of the powder samples using an Oxford Instruments energy dispersive system (133 eV resolution), via a 10 mm2 SATW detector. The analysis was carried out to verify the results of the XRD analysis and to calculate the Ca/P ratio of the synthesised nano-HAP powders.
2.3.4. Fourier Transform Infrared Spectroscopy (FT-IR)
- FT-IR spectroscopy of synthesized nanometre scale HAP powders and cadmium loaded HAP powders was carried out using a Perkin–Elmer Frontier FT-IR spectrometer with Universal Single bounce Diamond ATR attachment. Both FT-IR spectra were recorded in the range from 525 to 4000 cm−1 in steps of 4 cm-1.
2.4. Batch Adsorption Studies
- All adsorption experiments were carried out using the batch equilibrium technique. During experiments the adsorption capacity of absorber for Cd2+ ions was investigated. The study also examined the influence of the initial Cd2+ ion concentration, contact time, temperature and pH of the test solutions.The influence of contact time on Cd2+ ion adsorption on absorber was examined using aqueous solutions containing 100 mg/L of Cd2+ ions (100 ppm) prepared from cadmium chloride [CdCl2]. A sample of 0.1 g HAP taken from the stock solution (1g/L) was added to a 100 ppm Cd2+ prepared solution. The magnetic stirring speed was set to 400 rpm, while the temperature of the suspension was maintained at 298 ± 1 K. The pH of the suspension was adjusted by adding drops of 0.1 M NaOH to the suspension and then maintaining the value of 7 throughout the experiment. Sample volumes were taken from the suspension during the mixing process at pre-determined time intervals (10, 20, 30, 40, 60, 90, 120, 180, 240 and 300 min) so that Cd2+ ion concentration in the solution could be measured. After each specified time, the sample solution was first filtered using a Whatman® 0.22μm membrane syringe filter and then centrifuged at 15,000 g for 20 minutes. Each time a sample volume was taken, an equal volume was then added to the solution to maintain the initial volume. The concentration of Cd2+ ions in the sample solution was determined by inductively coupled plasma atomic emission spectrometer (Varian Vista Axial CCD ICP-AES). All experiments were carried out in triplicate. The effect of solution pH on adsorption was studied by adjusting the pH from 2 to 12. This was done by treating the solution with either 0.1M HCl or 0.1M NaOH. The temperature was normally set to 298 K, except where temperature variation studies were carried out. After 300 min, the solid was separated from the suspension using a Whatman® 0.22μm membrane syringe filter and the residual cadmium level was measured. The influence of initial Cd2+ ion concentration was studied by first preparing a series of Schott reagent bottles containing 100 mL aqueous solutions consisting of varying concentrations of Cd2+ ion (50 to 175 mg/L) with an initial pH of 7. Then 1 g/L stock solution containing nanometre scale HAP powder was added (100 mL) into each bottle. The bottles were then sealed and the magnetic stirring speed was set to 400 rpm, while the bottles were thermostatically maintained at the respective isotherm (283, 293, 303, 313 and 323 K). Measurement of Cd2+ concentration levels was carried out at pre-determined time intervals (10, 20, 30, 40, 60, 90, 120, 180, 240 and 300 min). All initial Cd2+ ion concentration experiments were carried out in triplicate. The data collected from the adsorption experiments was then used in the subsequent kinetic and adsorption isotherm modelling studies.
3. Results and Discussions
3.1. XRD Spectroscopy Analysis
- Analysis of respective powder XRD patterns was used to identify the purity and crystalline size of the synthesised nanometre scale HAP powders used in the adsorption studies. A XRD pattern of a representative pure HAP powder before being used in the adsorption studies is presented in Figure 1. Inspection of the HAP powder (blue pattern in Figure 1) reveals that the reflection pattern matches the known phases present in pure HAP and is consistent with the phases listed in the ICDD database. The pattern also identifies main (h k l) indices found in the HAP sample, namely (002), (211), (300), (202), (310), (222) and (213). The pattern only shows characteristic HAP peaks and there was no evidence of non-HAP phases. In addition, the crystalline size, t (hkl), of each sample was calculated from the respective XRD patterns using the Debye-Scherrer equation [29-31]
 | (1) |
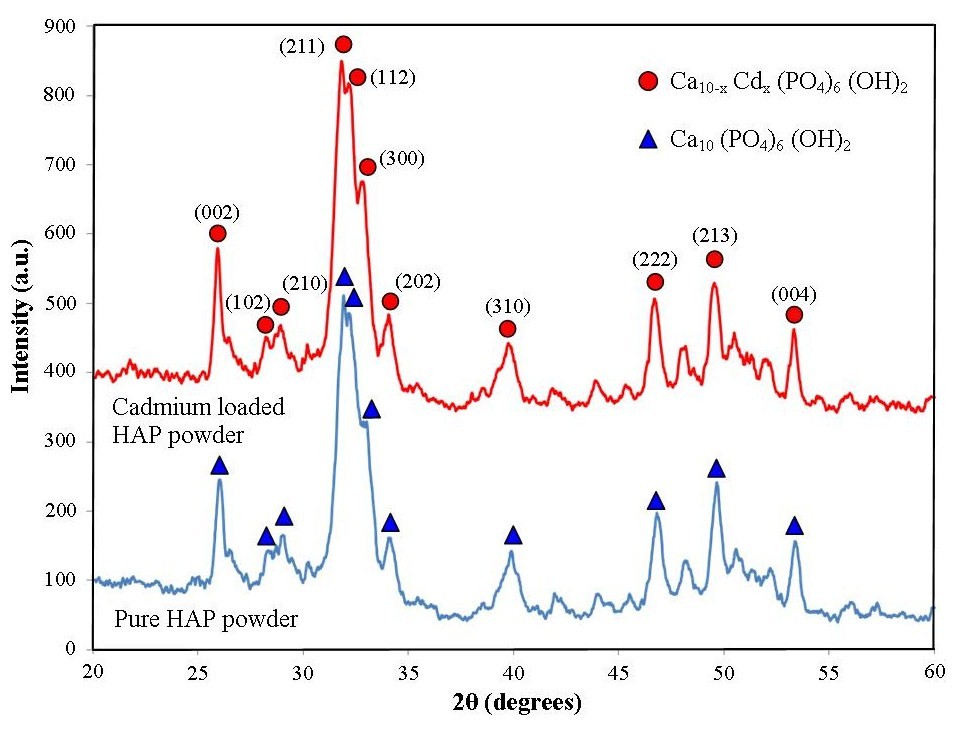 | Figure 1. XRD pattern of synthesized nanometre scale HAP powder after milling and drying (Blue), while the second XRD pattern (Red) reflects the maximum uptake of  of the solid residue at the end of the adsorption study. The study used 1 g/L HAP absorbent, a 100 mg/L of the solid residue at the end of the adsorption study. The study used 1 g/L HAP absorbent, a 100 mg/L  ion solution, with a pH of 7 and stirred at 400 rpm for a total contact time of 300 min ion solution, with a pH of 7 and stirred at 400 rpm for a total contact time of 300 min |
3.2. FESEM and EDS Analysis
- FESEM was used to study particle size and morphology before and after adsorption studies. A typical micrograph of a pure HAP powder sample is presented in Figure 2(b) and reveals a sphere like particle morphology that is highly agglomerated. The spherical morphology seen is similar to particle morphologies previously reported in the literature [15, 29-31]. Particle size analysis of micrographs revealed a mean particle diameter of 28 ± 5 nm and compared favourably to the XRD determined value of 30 ± 5 nm. After adsorption studies, FESEM analysis was also performed on samples to determine any changes in size or morphology. Figure 2 (d) presents a typical micrograph of the Ca10−xCdx(PO4)6(OH)2 structure displaying the same agglomerated spherical morphology seen in samples prior to adsorption studies. The mean particle size seen in the Cd2+ loaded samples was estimated to be 26 ± 5 nm. The studies have revealed that there was no significant difference in particle size and morphology between unloaded and loaded powder samples. Figure 2 (a) presents a typical EDS spectrum of an unloaded sample showing peaks corresponding to Ca, P, and O, and confirms the chemical composition of HAP. In addition, a number of Au and Cu peaks were also seen in the EDS spectrum. The Au peaks were the product of the Au coating used on the samples, while the Cu peaks are a consequence of X-rays being scattered from the copper grid. Figure 2 (c) presents an EDS spectrum of a representative Cd2+ loaded sample and confirms the chemical composition of the sample. The presence of two cadmium peaks (indicated by red arrows) also confirms the results of the XRD analysis discussed above.
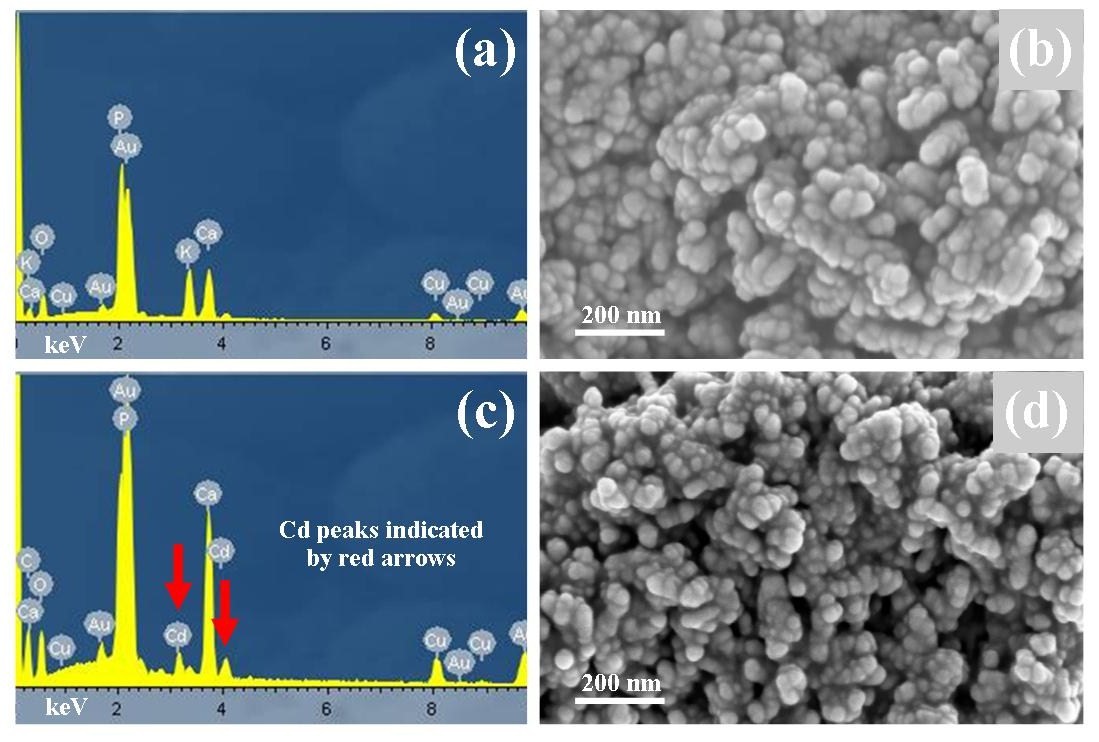 | Figure 2. EDS spectrum (a) and FESEM micrograph (b) of unloaded nanometre scale crystalline HAP powder and EDS spectrum (c) and FESEM micrograph (d) of a typical  loaded HAP residue loaded HAP residue |
3.3. FT-IR Studies
- FT-IR spectroscopy and subsequent analysis was used to identify species, functional groups and vibration modes associated with peaks seen in sample spectra taken before and after adsorption studies. Figure 3 presents the results of FT-IR spectroscopy of representative powder samples taken before and after adsorption studies. Starting from the right hand side of Figure 3 with a powder sample prior to adsorption testing. We see three peaks occurring at 561 cm-1, 600 cm-1 and 631cm-1 that are consistent with ν4 vibrations normally associated with O-P-O modes. The weaker peak located at 832 cm-1 is associated with a carbonate group and clearly indicates the presence of carbonates in the sample. The presence of carbonate ions in the sample is a consequence of atmospheric carbon dioxide interacting with HAP precursors in the synthesis solution and has been reported in the literature by other researchers [34, 35]. The small peak located at 963 cm-1 indicates ν1 symmetric stretching vibrations normally associated with a P-O mode. The strong peak located at 1027 cm-1 and the smaller peak located at 1091 cm-1 correspond to PO43- functional groups. While the weaker peak located at 1374 cm-1 corresponds to a CO32- functional group. Moving further leftward we encounter a smaller peak located at 1644 cm-1 which indicates the presence of a CO32- group. The next peak located at 3215 cm-1 indicates the presence of absorbed water, while the last identified weak peak located at 3570 cm-1 corresponds to OH- ion vibrations in the HAP crystal lattice. The second pattern presents the FT-IR analysis of a representative powder sample after adsorption testing. The results are very much the same as the pre-adsorption sample, except both 600 and 631cm-1 peak intensities are significantly smaller than those of the pre-adsorption sample as seen in Figure 3 insert. Both peaks are associated with the P–OH groups that act as sorption sites on the surface of the HAP powder [18, 19]. Collectively, their reduced intensities confirm the decrease in the number of free sites available due to Cd2+ ion attachment and collaborates the results of XRD analysis.
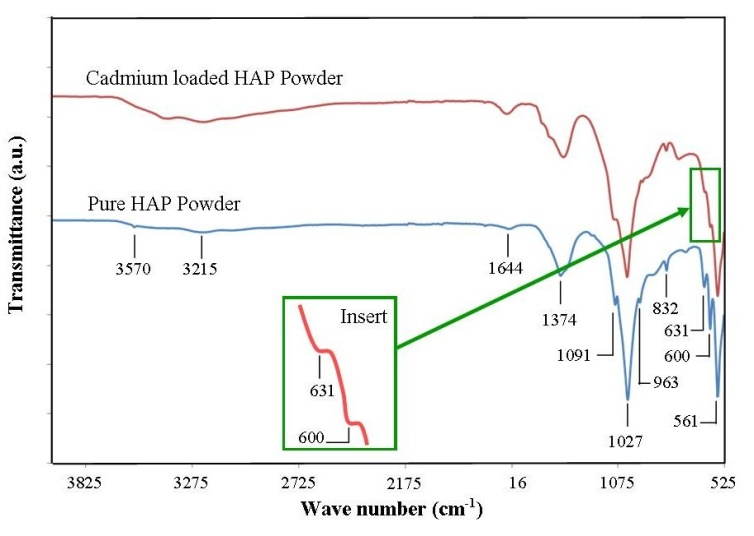 | Figure 3. FT-IR Spectroscopy analysis of synthesized pure nanometre scale hydroxyapatite powder after drying and a cadmium loaded HAP residue. The study used 1 g/L HAP absorbent, a 100 mg/L  ion solution, with a pH of 7 and stirred at 400 rpm for a total contact time of 300 min ion solution, with a pH of 7 and stirred at 400 rpm for a total contact time of 300 min |
3.4. Effect of Initial Cd2+ Concentration and pH on Adsorption
- The influence of initial Cd2+ concentration and contact time on adsorption was carried out on initial cadmium concentrations ranging from 50 to 175 mg/L and over contact times ranging from 10 to 300 minutes. Solution temperature was maintained at 298 ± 1 K and solution pH was maintained at 7. During adsorption studies all solutions were magnetically stirred at 400 rpm and concentration measurements were taken at different interval times over a 300 minute test period (10, 20, 30, 40, 60, 90, 120, 180, 240 and 300 min). Figure 4 (a) presents the adsorption results of a HAP absorber (1 g/L) placed in an initial Cd2+ ion concentration of 100 mg/L maintained at 298 ± 1 K and stirred at 400 rpm for 300 min. Inspection of Figure 4 (a) reveals maximum Cd2+ removal (75 %) occurred after 90 minutes and beyond this period no further adsorption was observed. The trend was typical of the absorber and further investigations were undertaken to quantify Cd2+ ion uptake by increasing initial metal concentrations. The results of these investigations are presented in Figure 4 (b) and reveal increasing initial Cd2+ ion concentration (50 to 175 mg/L) tended to produce a corresponding increase in capturing capacity of the absorber (45.75 to 110 mg/g). The increasing trend suggests the higher initial concentrations were able to overcome mass transfer related resistances existing between the aqueous and solid absorber phase by effectively creating a driving force. The effect of pH on adsorption was investigated by repeating batch equilibrium studies using an initial Cd2+ ion concentration of 100 mg/L (100 ppm) at various pH values ranging from 2 to 12. Figure 4 (c) presents the results of the pH study and illustrates the effect of pH on adsorption. It is apparent form Figure 4 (c) that Cd2+ adsorption steadily increases from pH 2 up to a value of 12 and pH influences the degree of Cd2+ removal from the solution. At lower pH values H+ ions compete with Cd2+ ions for binding sites on the absorber surface. However, as the pH increases there is a reduction in competition between H+, Cd2+ and Cd(OH)+ ions and as a result, metal uptake by the absorber increases [11]. The experimental results indicate Cd2+ removal was predominantly controlled by adsorption up to a pH of around 8. However, beyond pH 8 Cd2+ ion removal was significantly enhanced by cadmium hydroxide precipitation.
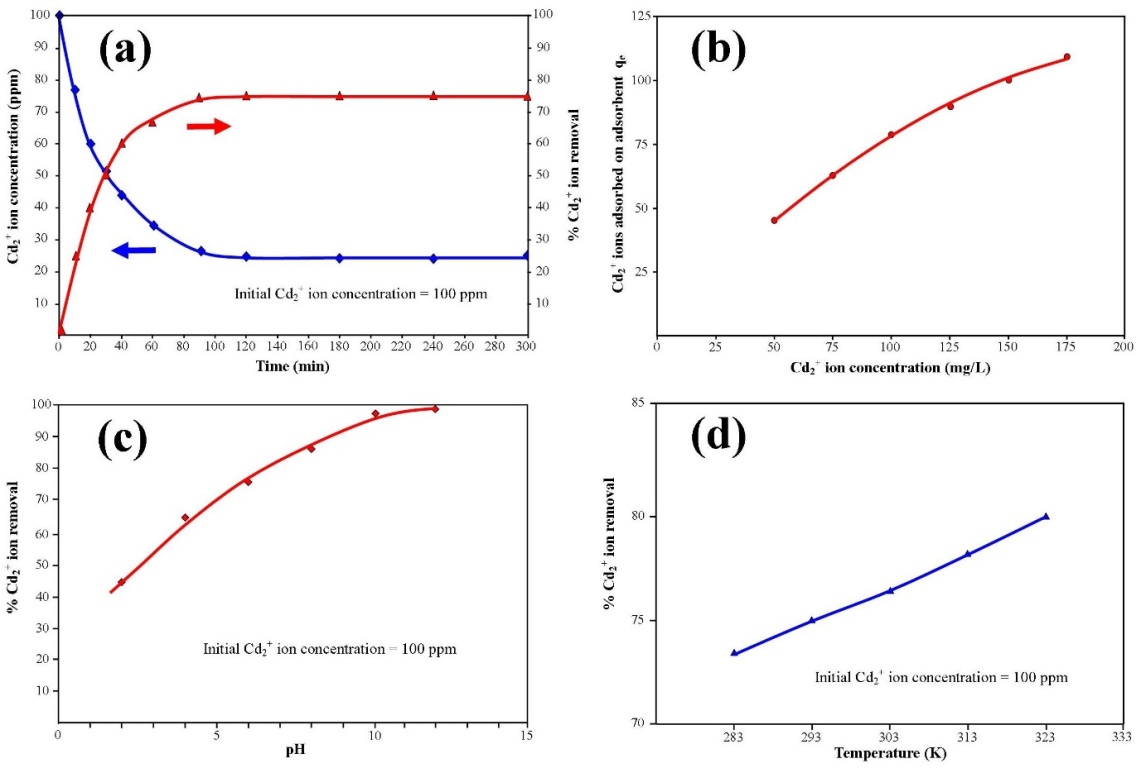 | Figure 4. (a) Influence of initial  concentration and contact time; (b) capturing capacity of the HAP absorbent with increasing initial concentration and contact time; (b) capturing capacity of the HAP absorbent with increasing initial  ion concentration (50 to 175 mg/L); (c) the effect of pH on ion concentration (50 to 175 mg/L); (c) the effect of pH on  adsorption, and (d) the effect of temperature % adsorption, and (d) the effect of temperature %  removal removal |
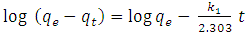
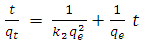
3.5. Adsorption Kinetics
- Kinetic analysis is essential for understanding any adsorption process. This is because sufficient residence time on the absorber surface is needed to complete the adsorption reaction. The amount of Cd2+ ions adsorbed at equilibrium time (qe) was calculated using equation 2 below:
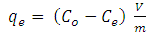 | (2) |
 | (3) |
 | (4) |
 | (5) |
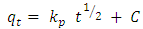
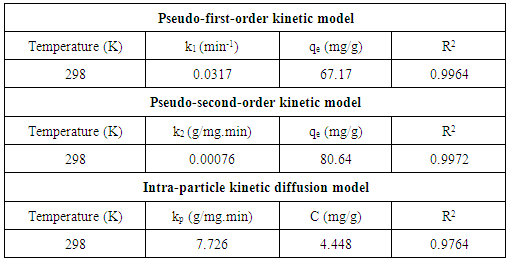
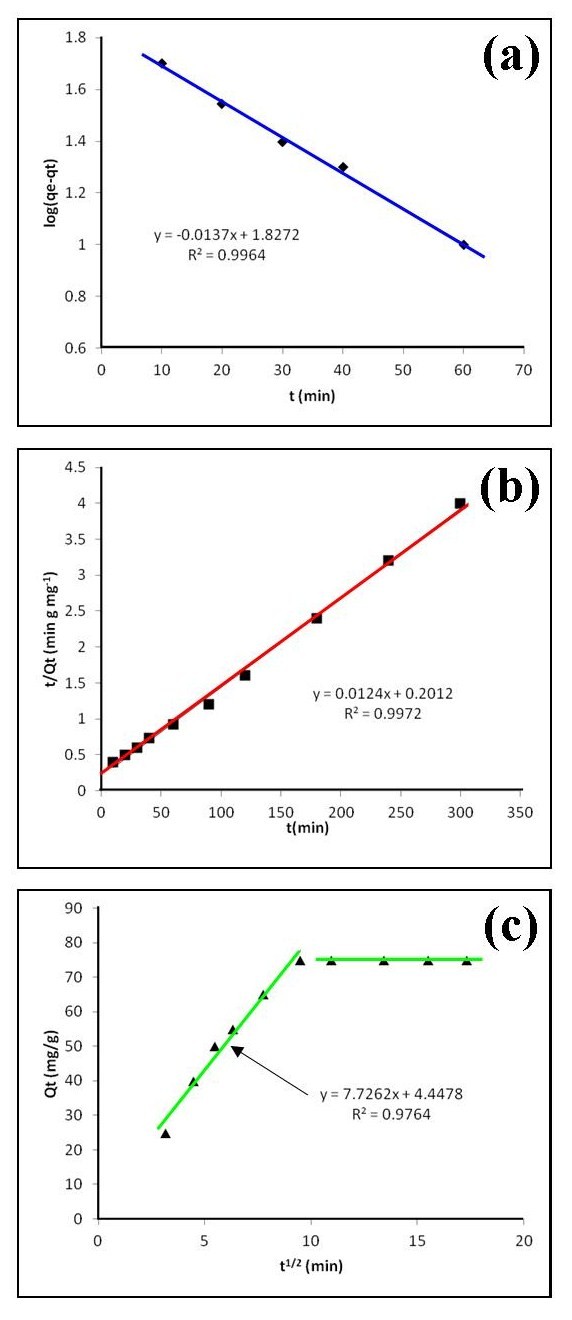 | Figure 5. Adsorption data modelled using three kinetic models: (a) Lagergren’s pseudo-first order law; (b) McKay and Ho’s pseudo-second-order law, and (c) the intra-particle diffusion model. [The study used 1 g/L HAP absorbent, a 100 mg/L  ion solution, with a pH of 7 and stirred at 400 rpm for a total contact time of 300 min] ion solution, with a pH of 7 and stirred at 400 rpm for a total contact time of 300 min] |
3.6. Adsorption Isotherm
- Analysis of the experimental data was important in determining the distribution of Cd2+ ions between solution and HAP absorber when the adsorption process had reached its equilibrium state. There are a number of isotherm equations available to model the results of equilibrium data obtained from adsorption systems. The two most widely used equilibrium modelling equations are Freundlich and Langmuir. Freundlich is purely an empirical equation used to fit experimental data. It takes into account surface heterogeneity, the exponential distribution of active adsorption sites and their respective energies over a wide range of concentrations. Langmuir, unlike the Freundlich assumes maximum adsorption occurs when the surface is covered by a monolayer of adsorbate. The equilibrium data for Cd2+ ions in solution over a concentration range starting from 50 to 175 mg/L at constant temperature of 298 K, pH of 7, 1 g/L absorbent dose and a contact time of 300 minutes was analysed using Freundlich and Langmuir isotherms. The Freundlich isotherm equation used for modelling the equilibrium data is presented in its linear form below:
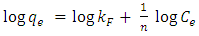 | (6) |
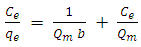 | (7) |
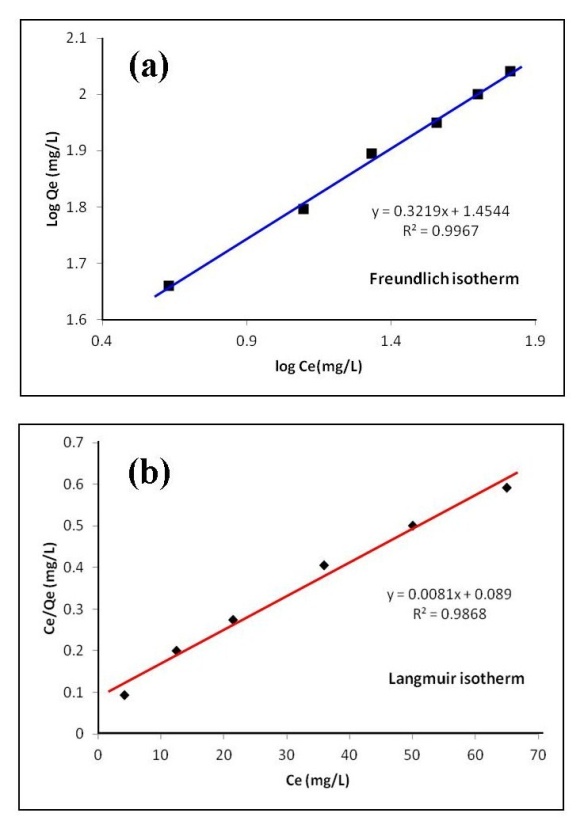 | Figure 6. Linear fits of experimental data using (a) Freundlich and (b) Langmuir isotherms [The study used 1 g/L HAP absorbent, a 100 mg/L  ion solution, with a pH of 7 and stirred at 400 rpm for a total contact time of 300 min] ion solution, with a pH of 7 and stirred at 400 rpm for a total contact time of 300 min] |
|
|
3.7. The Effect of Temperature
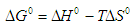
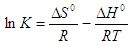
- An isothermal study was also carried out to investigate the effect of temperature on cadmium adsorption of HAP absorber. The five isotherms used were 283, 293, 303, 313 and 323 K, while the initial Cd2+ ion concentration (100 mg/L), contact time (300 min) and adsorbent dose (1 g/L) were kept constant during the study. The study revealed cadmium adsorption capacity steadily increased with increasing temperature [see Figure 4 (d)] and indicated the adsorption process was endothermic in nature. To investigate the thermodynamics of the adsorption process, parameters such as free energy change (ΔG0), enthalpy change (ΔH0) and entropy change (ΔS0) were calculated using the following equations:
 | (8) |
 | (9) |
 | (10) |
 | (11) |
 | (12) |
|
 | (13) |
4. Conclusions
- The present study has shown a HAP powder synthesized via a combined ultrasound and microwave based technique has resulted in the development of a highly crystalline structure with a spherical mean particle size of 30 nm. The prepared nanometre scale HAP powder was found to be an effective adsorbent for the removal of Cd2+ cations from aqueous solutions. The sorption performance was found to be a function of initial Cd2+ concentration, temperature and solution pH. Furthermore, Cd2+ removal was found to improve with increases in these parameters for specific contact times. The study also confirmed the sorption process was endothermic in nature and Cd2+ sorption increased with temperature. Kinetic studies revealed the sorption process closely followed pseudo-second order kinetics. During sorption, the initial uptake rate of Cd2+ was high, but this was followed by a much lower uptake rate. The ion-exchange mechanism (Cd2+ → Ca2+) was clearly identified as the major participant in the sorption process. The results of both XRD and EDS analysis confirmed ion-exchange was a major removal mechanism and sorption was heavily influenced by intra-particle diffusion. Isotherm studies indicated the Freundlich isotherm modelled experimental data better than the Langmuir isotherm. However, the Langmuir isotherm was used to determine maximum adsorption capacity of the HAP absorber and was found to be 123.45 mg/g. All calculated thermodynamic parameters (ΔGº, ΔHº and ΔSº) clearly indicate sorption was thermodynamically favourable, endothermic and spontaneous in nature.
ACKNOWLEDGEMENTS
- Ms. Sridevi Brundavanam would like to acknowledge Murdoch University for providing a PhD Scholarship to undertake the cadmium adsorption studies as part of her PhD project.
References
| [1] | Wongsasuluk, P., Chotpantarat, S., Siriwong, W., Robson, M., 2012, Heavy metal contamination and health risk assessment in drinking water from shallow groundwater wells in an agricultural area in Ubon Ratchathani province, Thailand. Environ Geochem. Health, 36, 169-182. |
| [2] | Jarup, L., 2003, Hazards of heavy metal contamination, British Medical Bulletin, 68 (1), 167-182. |
| [3] | Hartwig, A., 2013, Cadmium and cancer, Met. Ion. Life. Sci., 11, 491-507. |
| [4] | Mulligan, C.N., Yong, R.N., Gibbs, B.F., 2001, Remediation technologies for metal-contaminated soils and groundwater: an evaluation, Eng. Geol., 60, 193–207. |
| [5] | Ramos, R.L., Mendez, J.R.R., Baron, J.M., Rubio, L.F., Coronado, R.M.G., 1997, Adsorption of cadmium (II) from aqueous solution onto activated carbon, Water Sci. Technol., 5 (7), 205-211. |
| [6] | Zhu, R., Yu, R., Yao, J., Mao, D., Xing, C., Wang, D., 2008, Removal of Cd2+ from aqueous solutions by hydroxyapatite, Catalysis Today, 139, 94–99. |
| [7] | Kaji, M., 2012, Role of experts and public participation in pollution control: the case of Itai-itai disease in Japan, Ethics Sci. Environ Polit., 12, 99-111. |
| [8] | Barakat, M.A., 2011, New trends in removing heavy metals from industrial wastewater. Arabian Journal of Chemistry, 4 (4), 361-377. |
| [9] | Al-Enezi, G., Hamoda, M.F., Fawzi, N., 2004, Ion exchange of heavy metals from wastewater sludges, J. Environ Sci. Health A Tox. Hazard Subst. Environ. Eng., 39 (2), 455-464. |
| [10] | Nhapi, I., Banadda, N., Murenzi, R., Sekomo, C.B., Wali, U.G., 2011, Removal of heavy metals from industrial wastewater using rice husks, The open Environmental Engineering Journal, 4, 170-180. |
| [11] | Mobasherpour, I., Salahi, E., Pazouki, M., 2011, Removal of divalent cadmium cations by means of synthetic nano-crystallite hydroxyapatite, Desalination, 266, 142–148. |
| [12] | Mohan, D., and Singh, K.P., 2002, Single and multi-component adsorption of cadmium and zinc activated carbon derived from bagasse–an agricultural waste, Water Res., 26, 2304-2318. |
| [13] | Reichert, J., and Binner, J.G.P., 1996, An evaluation of hydroxyapatite-based filters for removal of heavy metal ions from aqueous solutions, Journal of Materials Science, 31, 1231–1241. |
| [14] | Del Rio, J.G., Sanchez, P., Morando, P.J., Cicerone, D.S., 2006, Retention of Cd, Zn, and Co on hydroxyapatite filters, Chemosphere, 64, 1015–1020. |
| [15] | Poinern, G.E.J., Brundavanam, R., Le, X., Djordjevic, S., Prokic, M., Fawcett, D., 2011, Thermal and ultrasonic influence in the formation of nanometre scale hydroxyapatite bio-ceramic, International Journal of Nanomedicine, 6, 2083-2095. |
| [16] | Dorozhkin, S.V., 2009, Nanodimensional and nanocrystalline apatites and other calcium orthophosphates in biomedical engineering, biology and medicine. Materials, 2, 1975-2045. |
| [17] | Poinern, G.E.J., Brundavanam, R., Le, X., Nicholls, P.K., Cake, M.A., Fawcett, D., 2014, The synthesis, characterisation and in vivo study of a bioceramic for potential tissue regeneration applications, Scientific Reports, 4, 6235, 1-9. |
| [18] | Tanaka, H., Futaoka, M., Hino, R., Kandori, K., Ishikawa, T., 2005, Structure of synthetic calcium hydroxyapatite particles modified with pyrophosphoric acid, J. Colloid Interface. Sci. 283 (2), 609-612. |
| [19] | Monteil Rivera, F., and Fedoroff, M., Sorption of inorganic species on apatite’s from aqueous solutions: In Encyclopaedia of surface and colloid Science. Marcel Dekker. Inc, New York, 2002. |
| [20] | Phillips, M.J., Darr, J.A., Luklinska, Z.B., Rehman, I., 2003, Synthesis and characterization of nano-biomaterials with potential osteological applications, J. Mater. Sci. Mater. Med. 14, 875-882. |
| [21] | Chaudhry, A.A., Haque, S., Kellici, S., Boldrin, P., Rehman, I., Khalid, F.A., Darr, J.A., 2006, Instant nano-hydroxyapatite: a continuous and rapid hydrothermal synthesis, Chem. Commun., 2286-2288. |
| [22] | Kuriakose, T.A., Kalkura, S.N., Palanichamy, M., Arivuoli, D., Dierks, K., Bocelli, G., Betzel, C., 2004, Synthesis of stoichiometric nano-crystalline hydroxyapatite by ethanol-based sol-gel technique at low temperature, J. Cryst. Growth, 263, 517-523. |
| [23] | Majumdar, S., Chakraborty, S., Devi, P.S., Sen, A., 2008, Room temperature synthesis of nanocrystalline SnO through sonochemical route, Mater. Lett., 62, 1249-1251. |
| [24] | Poinern, G.E.J., Brundavanam, R., Mondinos, N., Jiang, Z.T., 2009, Synthesis and characterization of nanohydroxyapatite using an ultrasound assisted method, Ultrasonics Sonochemistry, 16, 469-474. |
| [25] | McNamara, W.B., Didenko, Y.T., Suslick, K.S., 1999, Sonoluminescence temperatures during multi-bubble cavitation, Nature, 401, 772–775. |
| [26] | Cao, L.Y., Zhang, C., Huang, J.F., 2005, Influence of temperature, [Ca2+], Ca/P ratio and ultrasonic power on the crystallinity and morphology of hydroxyapatite nanoparticles prepared with a novel ultrasonic precipitation method, Mater. Lett., 59, 1902-1906. |
| [27] | Meejoo, S., Maneeprakom, W., Winotai, P., 2006, Phase and thermal stability of nanocrystalline hydroxyapatite prepared via microwave heating, Thermochim. Acta., 447, 115-120. |
| [28] | Poinern, G. E. J., Brundavanam, R., Le, X., Fawcett, D., 2012, The mechanical properties of a porous ceramic derived from a 30 nm sized particles based powder of hydroxyapatite for potential hard tissue engineering applications. Am. J. Biomed. Eng., 2, 278-286. |
| [29] | Danilchenko, S.N., Kukharenko, O.G., Moseke, C., Protsenko, I.Y., Sukhodub, L.F., Sulkio-Cleff, B., 2002, Determination of the bone mineral crystallite size and lattice strain from diffraction line broadening, Cryst. Res. Technol., 37 (11), 1234-1240. |
| [30] | Klug, H.P., and Alexander, L.E., 1974, X-ray diffraction procedures for poly-crystallite and amorphous materials. 2nd Ed., Wiley, New York. |
| [31] | Barrett, C.S., Cohen, J.B., Faber, J., Jenkins, J.R., Leyden, D.E., Russ, J.C., Predecki, P.K., 1986, Advances in X-ray analysis, Vol. 29, Plenum Press, New York. |
| [32] | Lee, C.K., Kim, H.S., Kwon, J.H., 2005, The removal of heavy metals using hydroxyapatite, Environ. Eng. Res., 10 (5), 205-212. |
| [33] | Evisa, Z., Yilmazb, B., Ustac, M., Aktugc, A.L., 2013, X-ray investigation of sintered cadmium doped hydroxyapatites, Ceramics International, 39, 2359–2363. |
| [34] | Panda, R.N., Hsieh, M.F., Chung, R.J., Chin, T.S., 2003, FTIR, XRD, SEM and solid state NMR investigations of carbonate-containing hydroyapatite nano-particles synthesised by hydroxide-gel technique, J. Physics and Chemistry of Solids, 64 (2), 193-199. |
| [35] | Wang, Y., Zhang, S., Wei, K., Zhao, N., Chen, J., Wang, X., 2006, Hydrothermal synthesis of hydroxyapatite nanopowders using cationic surfactant as a template. Mater Lett., 60 (12),1484-1487. |
| [36] | Lagergren, S., 1898, Zur theorie der sogenannten adsorption gelöster stoffe, Kungliga Svenska Vetenskapsakademiens Handlingar, 24, 1-39. |
| [37] | McKay, G., Ho, Y.S., 1999, Pseudo-second order model for sorption processes, Process Biochem., 34, 451-465. |
| [38] | Weber, W.J., and Morris, J.C., 1963, Kinetics of adsorption on carbon from solution, J. Sanit. Engng. Div. Am. Soc. Civ. Engrs, 89, 31-60. |
| [39] | Milonjic, S.K., 2007, A consideration of the correct calculation of thermodynamic parameters of adsorption, J. Serb. Chem. Soc., 72, 1363–1367. |
| [40] | Ajmal, M., Rao, R.A., Anwar, S., Ahmad, J., Ahmad, R., 2003, Adsorption studies on rice husk: removal and recovery of Cd (II) from wastewater, Bioresource Technol., 86, 147–149. |
| [41] | Al-Anber, Z.A., and Matouq, M.A.D., 2008, Batch adsorption of cadmium ions from aqueous solution by means of olive cake, J. Hazard Mater., 151 (1), 194–201. |
| [42] | Krishnan, K.A., Anirudhan, T.S., 2003, Removal of cadmium (II) from aqueous solutions by steam activated sulphurised carbon prepared from sugar-cane bagasse pith: kinetics and equilibrium studies, Water SA, 29, 147–156. |
| [43] | Tangjuank, S., Insuk, N., Tontrakoon, J., Udeye, V., 2009, Adsorption of Lead (II) and Cadmium (II) ions from aqueous solutions by adsorption on activated carbon prepared from cashew nut shells, World Acad. Sci. Eng. Technol., 52, 110–116. |
| [44] | Azouaoua, N., Sadaouia, Z., Djaafri, A., Mokaddema, H., 2010, Adsorption of cadmium from aqueous solution onto untreated coffee grounds: equilibrium, kinetics and thermodynamics, J Hazard Mater., 184 (1–3), 126–134. |
| [45] | Alfaro-Cuevas-Villanueva, R, Hidalgo-Vázquez, A.R., Cortés-Penagos, C., Cortés-Martínez, R., 2014, Thermodynamic, Kinetic, and Equilibrium Parameters for the Removal of Lead and Cadmium from Aqueous Solutions with Calcium Alginate Beads. Scientific World Journal, Volume 2014: Article ID 647512, 9 pages. |
| [46] | Kapoor, A., Viraraghavan, T., Cullimore, D.R., 1999, Removal of heavy metals using the fungus Aspergillus niger, Bioresource Technol., 70 (1), 95-104. |