-
Paper Information
- Paper Submission
-
Journal Information
- About This Journal
- Editorial Board
- Current Issue
- Archive
- Author Guidelines
- Contact Us
Physical Chemistry
p-ISSN: 2167-7042 e-ISSN: 2167-7069
2015; 5(1): 16-22
doi:10.5923/j.pc.20150501.03
Validation of Caffeic Acid in Emulsion by UV-Spectrophotometric Method
 Abstract
 Reference
 Full-Text PDF
 Full-text HTML
Caroline Magnani Spagnol, Thais Stoinov Oliveira, Vera Lucia Borges Isaac, Marcos Antonio Corrêa, Hérida Regina Nunes Salgado
Department of Drugs and Pharmaceuticals, School of Pharmaceutical Sciences of Araraquara- UNESP, Rodovia Araraquara-Jaú, km 1, CEP, Araraquara, SP, Brazil
Correspondence to: Caroline Magnani Spagnol, Department of Drugs and Pharmaceuticals, School of Pharmaceutical Sciences of Araraquara- UNESP, Rodovia Araraquara-Jaú, km 1, CEP, Araraquara, SP, Brazil.
| Email: |  |
Copyright © 2015 Scientific & Academic Publishing. All Rights Reserved.
A simple, fast and reproducible UV Spectrophotometric method was developed and validated for quantification of caffeic acid in emulsion, the method proved effective, easy applicability, low cost, besides it does not generate toxic wastes to the operator and the environment, corroborating with the routine analysis of quality control to ensure the therapeutic efficacy of the drug already marketed. The method presented being capable to detect and quantify the substance obtaining satisfactory results regarding specificity, precision, accuracy and robustness, linear range of 2 to 8 μg/mL, showing correlation coefficient of 0.9999 when analyzed in the wavelenght λ=325 nm spectrophotometer.
Keywords: Caffeic Acid, Emulsion, Analytical Method, Quantitative Analysis, Quality Control
Cite this paper: Caroline Magnani Spagnol, Thais Stoinov Oliveira, Vera Lucia Borges Isaac, Marcos Antonio Corrêa, Hérida Regina Nunes Salgado, Validation of Caffeic Acid in Emulsion by UV-Spectrophotometric Method, Physical Chemistry, Vol. 5 No. 1, 2015, pp. 16-22. doi: 10.5923/j.pc.20150501.03.
Article Outline
1. Introduction
- Caffeic acid (3,4-dihydroxycinnamic) is widely distributed in plant tissues and it is one of the hydroxycinnamate and phenylpropanoid metabolites. This polyphenol is present in many food sources, including blueberries, coffee drinks, cider and apples [1]. Besides food, caffeic acid is present in several medications of popular use, mainly based on propolis [2]. Besides acting as a carcinogenic inhibitor [3, 4], it is also known to possess antioxidant and antibacterial activity in vitro [5-7].Due to its high antioxidant activity, caffeic acid (CA) defends the organism from free radical and can be used in cosmetic emulsions for dermal application in order to maintain the skin healthier and younger-looking avoiding the reduction in skin hydration, pigmentation, fine wrinkles, signals from sagging and neoplasm diseases. Due its antibacterial activity CA can be used to treat skin infections such as acne and rosacea [8].There is no method for determination and quantification of caffeic acid in official compendia, such as pharmacopoeias, however most current articles recommends quantification of the substance by High Performance Liquid Chromatography (HPLC) [9-12].While HPLC is a widely used and robust analytical method for mixtures with known compositions, identification of the unknown ingredients will require MS or LC-MS/MS. There are many publications on the analysis of caffeic acid by LC-MS/MS approaches [13-16]. Studies focused on the development and refinement of analytical methodologies is crucial for optimization of laboratory tests carried out in the pharmaceutical industry, for quality assurance. However, many of these methods require pre-treatment of the sample, formation of metal complexes, drug degradation using sulfuric acid, require sophisticated equipment, high costs or use of large amounts of organic solvents, which are toxic for the operators and the environment. Furthermore, most of the methods described quantifies the drug in biological fluids [17].On the other hand, the quality control in the pharmaceutical industry requires reliable analytical methods capable of ensuring therapeutic efficacy of the marketed drug, but that is simple, fast, versatile, that does not require complex or costly procedures, does not generate toxic wastes, so that, in this way it can be employed in laboratory tests. The method by ultraviolet absorption spectrophotometry has been employed as a proof of identification, by comparison of the spectral profile; this feature is important for characterization purposes of the substance from obtaining the wavelengths of greatest absorbance [18]. The use of this method for quantification of drugs also has distinguished itself by offering favorable characteristics for applications in quality control. The inclusion of this instrumental technique is highly recommended for official textbooks, because the methods developed by UV spectroscopy have shown results also accurate, reproducible and accurate [19-25]. As an alternative to the existing methods, the aim of this study was to develop, validate and apply an inexpensive, useful, fast and simple UV-Spectrophotometric method for quantitative determination of CA in emulsion. Besides these advantages, this method uses only green solvents and reduces the toxic waste formation.
2. Methodology
- CA standard was supplied by Sigma Aldrich and the emulsion was prepared with CA from Nanjing Zelang Medical Technology. Spectrophotometric readings were held in UV-Vis spectrophotometer Shimadzu UV-mini 1240 model, using quartz cuvettes 1 cm optical path, under controlled temperature 25°C. An equivalent of 2.5 mg of CA reference standard (RS) substance, was weighed and transferred to a 25 mL volumetric flask, and the volume was completed with ethanol and purified water (40:60) v/v, in order to obtain a stock solution of 100 μg mL-1. Aliquots 200-800 µL of this solution were transferred to 10 ml volumetric flasks, and volume was completed with ethanol and water (40: 60) to yield solutions with final concentrations of 2, 3, 4, 5, 6, 7 and 8 µg mL-1. Ethanol and water (40: 60) was used as blank to reset the appliance; the dilutions were individually analyzed in UV spectrophotometer at a wavelength 325 nm.
3. Method Validation
- The method was validated according to the parameters established in guidelines as Brazil, 2003; FDA, 2004; ICH, 2005; INMETRO, 2011[26-29].
3.1. Linearity
- The linearity of the method was obtained through the analysis of three analytical curves on three different days. The results obtained were analyzed to obtain the equation of the straight by the least squares method and verification of the linearity was detected by statistical tool of analysis of variance (ANOVA).
3.2. Specificity/ Selectivity
- A sample stock solution was prepared in accordance with figure 1, weighing 0.3125 g cream containing 0.8% AC. This aliquot was diluted in 25 mL of ethanol to give a sample solution with a final concentration of CA 100 µg/mL. From this solution, three CA solutions were prepared with final concentrations 3, 5 and 7 µg/ ml.
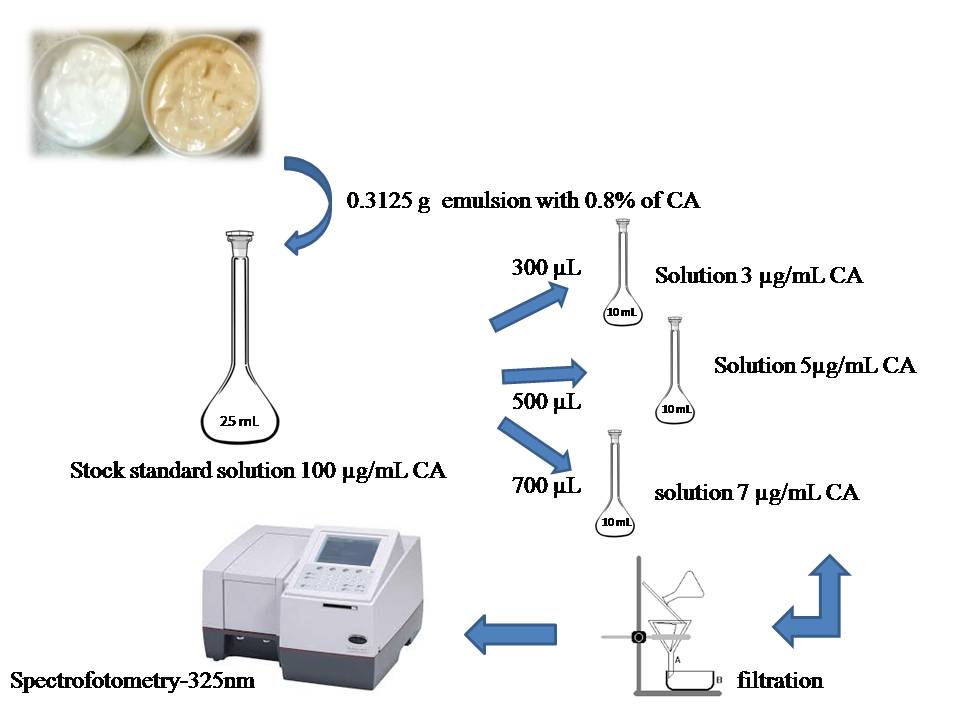 | Figure 1. Methodology to determine the specificity of CA in emulsion of the spectrometric method |
3.3. Precision
- The precision of the method was performed for repeatability and intermediate precision tests, which were evaluated by calculating the RSD sample content and statistical tools such as F-test.
3.3.1. Repeatability
- The repeatability was determined by analysis of seven solutions of CA in a concentration of 5 μg/mL prepared in the same day. Thus, results were obtained using the same experimental conditions and evaluated by the relative standard deviation.
3.3.2. Intermediate Precision
- The intermediate precision was evaluated through analysis of solutions of CA at a concentration of 5 μg/mL, and executed by different analysts in different days. The analyses were performed in seven replicates. The results were evaluated by the relative standard deviation of the levels and the Student’s t test.
3.4. Accuracy
- Accuracy was determined from nine determinations contemplating the linear interval of the procedure, i.e. three concentrations, low, medium and high, with three replicates each. Accuracy was expressed as the ratio between the average concentration determined experimentally and the corresponding theoretical concentration (Equation 1)
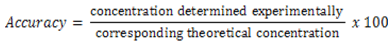 | (1) |
3.5. Limit of Detection (LD)
- The detection limit was calculated using the formula described in the literature [44], based on the standard deviation of the intercept and the slope of the analytical curve. The calculation was performed according to equation 2.
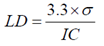 | (2) |
3.6. Limit of Quantification(LQ)
- The quantification limit was calculated using the formula described in the literature [29], based on the standard deviation of the intercept and the slope of the analytical curve. The calculation was performed according to equation 3.
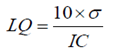 | (3) |
3.7. Robustness
- The robustness of the method was determined by comparing the contents obtained by varying the wavelength of absorption, proportion ethanol / water solution and ethanol manufacturer and evaluated by the relative standard deviation.
4. Results and Discussion
- Quantitative spectrophotometric analysis in the ultraviolet region has as its principle the direct relationship between the amount of light absorbed and the concentration of the substance, also known Lambert-Beer law [30].The molecular absorption in the ultraviolet region of the spectrum depends on the electronic structure of the molecule. The active proved to be soluble in the solvent tested and CA absorption spectra showed maximum absorbance at 325 nm (Figure 2).
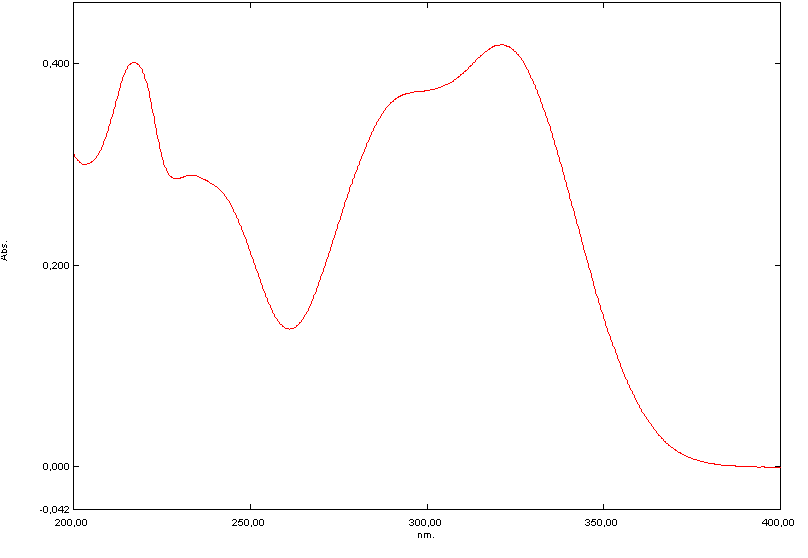 | Figure 2. Absorption spectrum in the ultraviolet region, solution of caffeic acid in a concentration of 4 µg/mL using as solvent ethanol and water (40: 60) |
4.1. Linearity
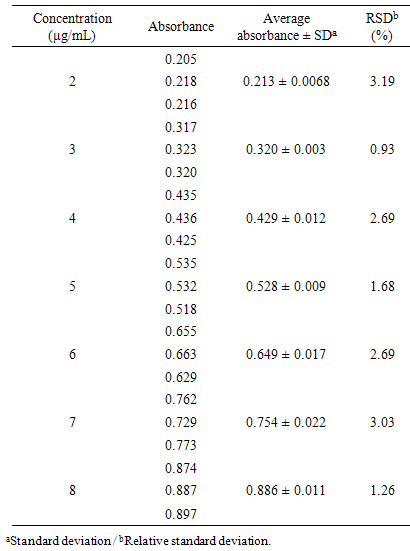
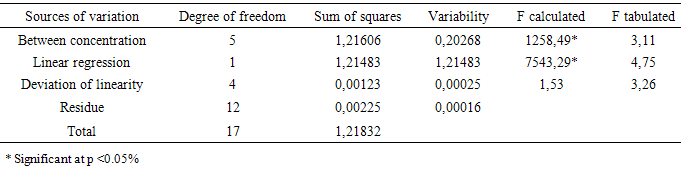
- The linearity is the ability of an analytical method to demonstrate that the results obtained are directly proportional to the concentration of the analyte in the sample within a specified range. The calibration curve (Figure 3) at concentrations of 2, 3, 4, 5, 6, 7, 8 µg mL-1 was constructed from the average of the absorbance values of three calibration curves obtained during the linearity test. The calibration curve was constructed with the average absorbance of three determinations versus the concentrations of CA by the method of least squares: y = 0,1110x - 0,0148 com R²= 0,9988. The correlation coefficient was satisfactory indicating excellent linear correlation between the analyzed data. The equation of the calibration graph or linear dependence straight line was obtained by linear regression (Table 1).
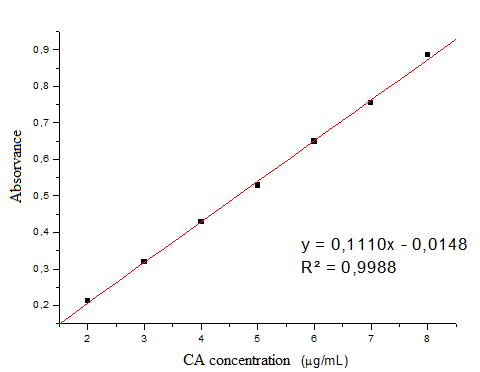 | Figure 3. Calibration curve of caffeic acid obtained by the spectrophotometric method in the UV region, using ethanol and water (40:60) as solvent at 325 nm |
|
|
4.2. Specificity / Selectivity
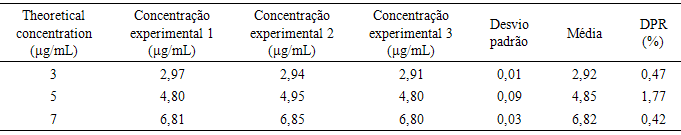
- It is the ability of the method to accurately measure a compound in the presence of other components such as impurities and degradation products of the matrix components [28].A stock solution of the emulsion sample was prepared with a final concentration of CA 100 µg/ ml in ethanol and water (40:60). To obtain three CA levels low, medium and high, this solution was diluted and the spectrophotometric reading was determined with three replicates each, and compared with theoretical CA concentrations (3, 5 and 7 µg/ ml) determining the DPR (Table 3).
|
4.3. Precision
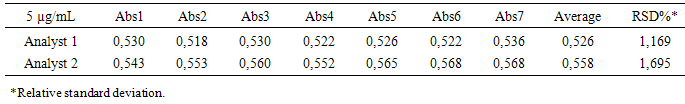
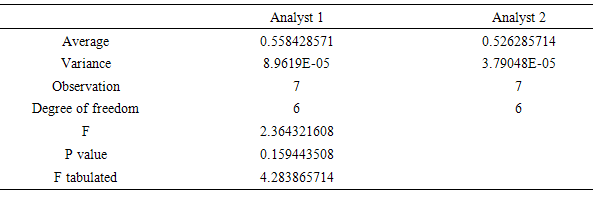
- The precision of the method was determined by repeatability (intraday), expressing the results on the basis of relative standard deviation [31]. Seven CA solutions prepared at a concentration of 5 μg/mL were submitted to successive analysis, and the data obtained on the same day, under the same experimental conditions, and by the same laboratory analyst, provided a RSD value of 1.1698%. Intermediate precision was evaluated through interday precision between-analysts and showed RSD of 1.6952% for the analyst 2. The values of the content of CA, determined during the assessment of the precision of the proposed method are shown in Table 4. The Intermediate precision was evaluated by F test (Table 5).
|
|
4.4. Accuracy
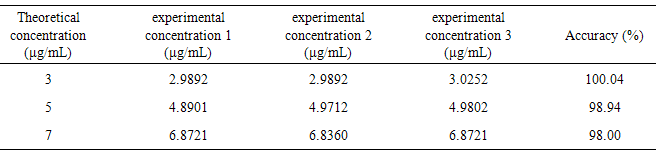
- The accuracy of an analytical method is the proximity of the results obtained compared to the true value [28, 32].For this purpose, known concentrations of CA, denominated theoretical concentrations were subjected to spectrophotometric reading at 325 nm, using the equation obtained in the linearity test, the experimental concentrations were calculated. Then, the accuracy of the method was determined as shown in Table 6.
|
4.5. Limit of detection (LD) and Limit of Quantification (LQ)
- The sensitivity of the spectrophotometric method was determined by the limits of detection (LD) and quantification (LQ). The calculated values for LD and LQ were 0.43 μg/mL and 1.32 μg/mL, respectively. The values are close to zero which indicate the sensitivity of the method [33].
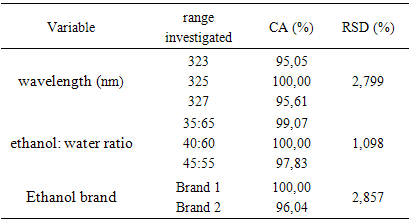
4.6. Robustness
- The robustness was evaluated by modifying wavelength, ethanol: water ratio in the preparation of solutions and ethanol: water ratio. The values of the content obtained after these changes had not relative standard deviations (RSD) higher than 5%. The results obtained is showed in Table 7.
|
5. Conclusions
- In this paper, an analytical method relying on UV spectrophotometry was developed and validated for the quantification of caffeic acid in an emulsion preparation of caffeic acid in a emulsion preparation, which shows advantages such as simplicity, speed, versatility, easy to apply, inexpensive and does not use toxic reagents and pollutants, satisfactory validation parameters, with highly reproducible results indicating linearity, selectivity, precision, proving to be suitable for routine analysis in cosmetic and pharmaceutical industries.