-
Paper Information
- Paper Submission
-
Journal Information
- About This Journal
- Editorial Board
- Current Issue
- Archive
- Author Guidelines
- Contact Us
Physical Chemistry
p-ISSN: 2167-7042 e-ISSN: 2167-7069
2015; 5(1): 6-15
doi:10.5923/j.pc.20150501.02
Theoretical and Experimental Study for FT-IR and UV/VIS Spectra of 1,4-diphenyl-3-(phenylammonio)-1H-1,2,4-triazolium(inner salt) by Using DFT Approach
 Abstract
 Reference
 Full-Text PDF
 Full-text HTML
Salah M. A. Ridha1, Zeyad A. Saleh2, Firyal Weli Askar3
1Physics Department, College of Science, Kirkuk University, Kirkuk, Iraq
2Physics Department, College of Science, AL-Mustansiriyah University, Baghdad, Iraq
3Chemistry Department, College of Science, AL-Mustansiriyah University, Baghdad, Iraq
Correspondence to: Salah M. A. Ridha, Physics Department, College of Science, Kirkuk University, Kirkuk, Iraq.
| Email: |  |
Copyright © 2015 Scientific & Academic Publishing. All Rights Reserved.
In this study, geometrical parameters, vibrational frequencies, electronic absorption maximum wavelengths in gas phase and chloroform solvent, and frontier orbitals (HOMO-LUMO) of 1,4-diphenyl-3-(phenylammonio)- 1H-1,2,4-triazolium(inner salt) were calculated by using DFT/B3LYP method with 6-311G(d,p) basis set. The Fourier Transform-Infrared (FT-IR) solid phase spectrum of the title compound was recorded in the spectral range 4000-400 cm-1. The difference between the scaled wavenumbers and the observed values of most of the vibrational modes is nearly small. The UV-Vis spectrum was measured in the spectral range 200-800 nm in chloroform solution. The theoretical electronic (UV-Vis) spectrum calculated using the TD-DFT(C-PCM) method with chloroform solvent is more suitable than the gas phase to the experimental spectrum. The calculated HOMO and LUMO energies show that charge transfer occurs within the molecule. Finally, a comparison between the experimental data and the calculated results appeared a good agreement.
Keywords: Nitron, inner salt, DFT, Theoretical electronic spectra, FT-IR spectra, Organic heterocyclic compound
Cite this paper: Salah M. A. Ridha, Zeyad A. Saleh, Firyal Weli Askar, Theoretical and Experimental Study for FT-IR and UV/VIS Spectra of 1,4-diphenyl-3-(phenylammonio)-1H-1,2,4-triazolium(inner salt) by Using DFT Approach, Physical Chemistry, Vol. 5 No. 1, 2015, pp. 6-15. doi: 10.5923/j.pc.20150501.02.
Article Outline
1. Introduction
- 1,4-diphenyl-3-(phenylammonio)-1H-1,2,4 triazolium (inner salt), commonly well-known as Nitron, is an organic heterocyclic compound consisting a cationic triazolium unit with an ionic PhN substituent [1]. Nitron compound has a chemical formula of C20H16N4 and the chemical structure is shown in Fig.1. In fact, Nitron takes its name from its ability to precipitate Nitrate Anion [2]. Nitron is insoluble in water but is quite soluble in chloroform, ethanol, benzene, alcohol, acetone, acetic acid, acetic ether, ethyl acetate, and slightly soluble in ether [3-5]. Nitron is used for the detection and gravimetric determination of nitrate ions. Nitron forms a covalent compound with poly(4-chloromethylstyrene) which removes nitrate from drinking water [6].
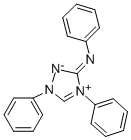 | Figure 1. Chemical Structure of Nitron molecule |
 ,
,  , and
, and  as well as a few other anions [2]. Practically,
  can always be expected to be present in ground water that contains perchlorate [16]. Furthermore, Nitron is used as desensitizers (A material that reduces the sensitivity of an emulsion to light exposures) [17] in photography [18]. Nitron compounds can be employed usefully as high energy desensitizers. It can be effective in desensitizing silver halide radiographic layer to light. Nitron compound is characterized by marked desensitizing action toward silver halide radiographic layers as well as its sensitivity to visible radiation (particularly in the blue region of the spectrum) [19]. Nitron also was used for preparing lithium iodide power sources utilized in manufacture of electrocardiostimulators [20].The present work aims to investigate the vibrational and UV–Vis spectral properties of Nitron using experimental and computational techniques.
2. Experimental Details
- The Nitron sample in the powder form was purchased from Sigma-Aldrich Chemical Company (Japan) with a stated purity of 99% and it was used as such in the following spectroscopic investigations at about 300 K without further purification.
2.1. FT-IR Spectrum
- Fourier transform-infrared (FT-IR) measurements were carried out by the KBr method using a Shimadzu corporation 8400S FTIR spectrometer. FT-IR spectra are generated by the absorption of electromagnetic radiation in the frequency range 4000–400 cm-1.
2.2. UV–Vis Spectrum
- UV/Vis spectrum of the compound has been recorded in the region of 200–800 nm using a Perkin Elmer Lambda 35 UV–Vis spectrometer.
3. Computational Methods
- The molecular structure optimization of the Nitron and corresponding vibrational harmonic frequencies were computed by using Becke's three parameter gradient-corrected exchange potential and the Lee-Yang-Parr gradient-corrected correlation potential (B3LYP) [21-23]. Density Functional Theory (DFT) method with standard split-valence 6-311G(d,p) basis set using Gaussian 09 [24] program package without any constraint on the geometry. All the computations have been done by adding polarization function d on heavy atoms and p on hydrogen atoms. The stability of the optimized geometries was confirmed by wavenumber calculations, which gave positive values for all the obtained wavenumbers. A frequency scaled factors of 0.952 and 0.985 were employed for the vibrational analysis, because the DFT-calculated harmonic vibrational frequencies are usually larger than those observed experimentally [25].The electronic properties (UV-Vis calculations) of the title compound, such as HOMO-LUMO energies, absorption wavelengths and oscillator strengths were performed by using TD-DFT/B3LYP method with 6-311(d,p) basis set, basing on the optimized structure in gas phase. In addition, the HOMO, LUMO energy values and energy gap of the title compound were calculated at the DFT-B3LYP/6-311G(d,p) level. All computational calculations were compared with the observed ones.
4. Results and Discussion
4.1. Molecular Geometry
- The most optimized structural parameters (bond lengths, bond angles and dihedral angles) of Nitron were calculated by DFT/B3LYP level with 6-311G(d,p) basis set and are given in Table 1. The calculated molecular structure of the title compound is found to be non-planar and is as shown in Fig. 2 along with the atom numbering scheme. In the literature, we have not found experimental data on molecular structure of Nitron, therefore the molecular structure of Nitron is compared with the available experimental data of 3-Phenylamino-4-Phenyl-1,2,4-Triazole-5-Thione and 5-[(E)-Methoxy(phenyl)methylidene]-1,3,4-triphenyl-4,5-dihydro-1H-1,2,4-triazole [26, 27] as crystal data of Nitron.
|
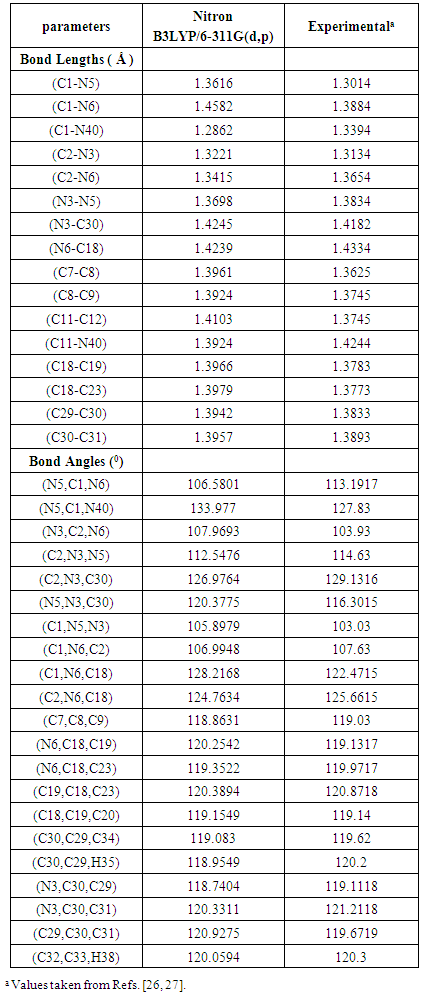
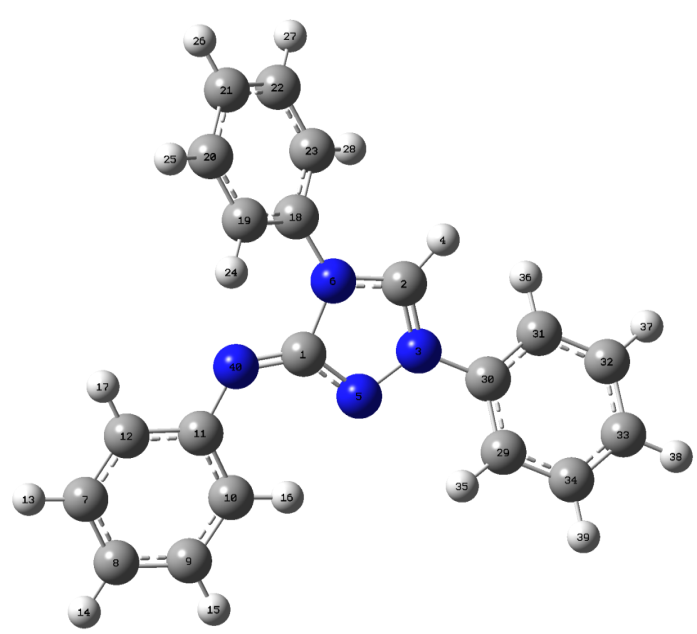 | Figure 2. Molecular structure and numbering scheme of Nitron |
4.2. Vibrational Frequencies
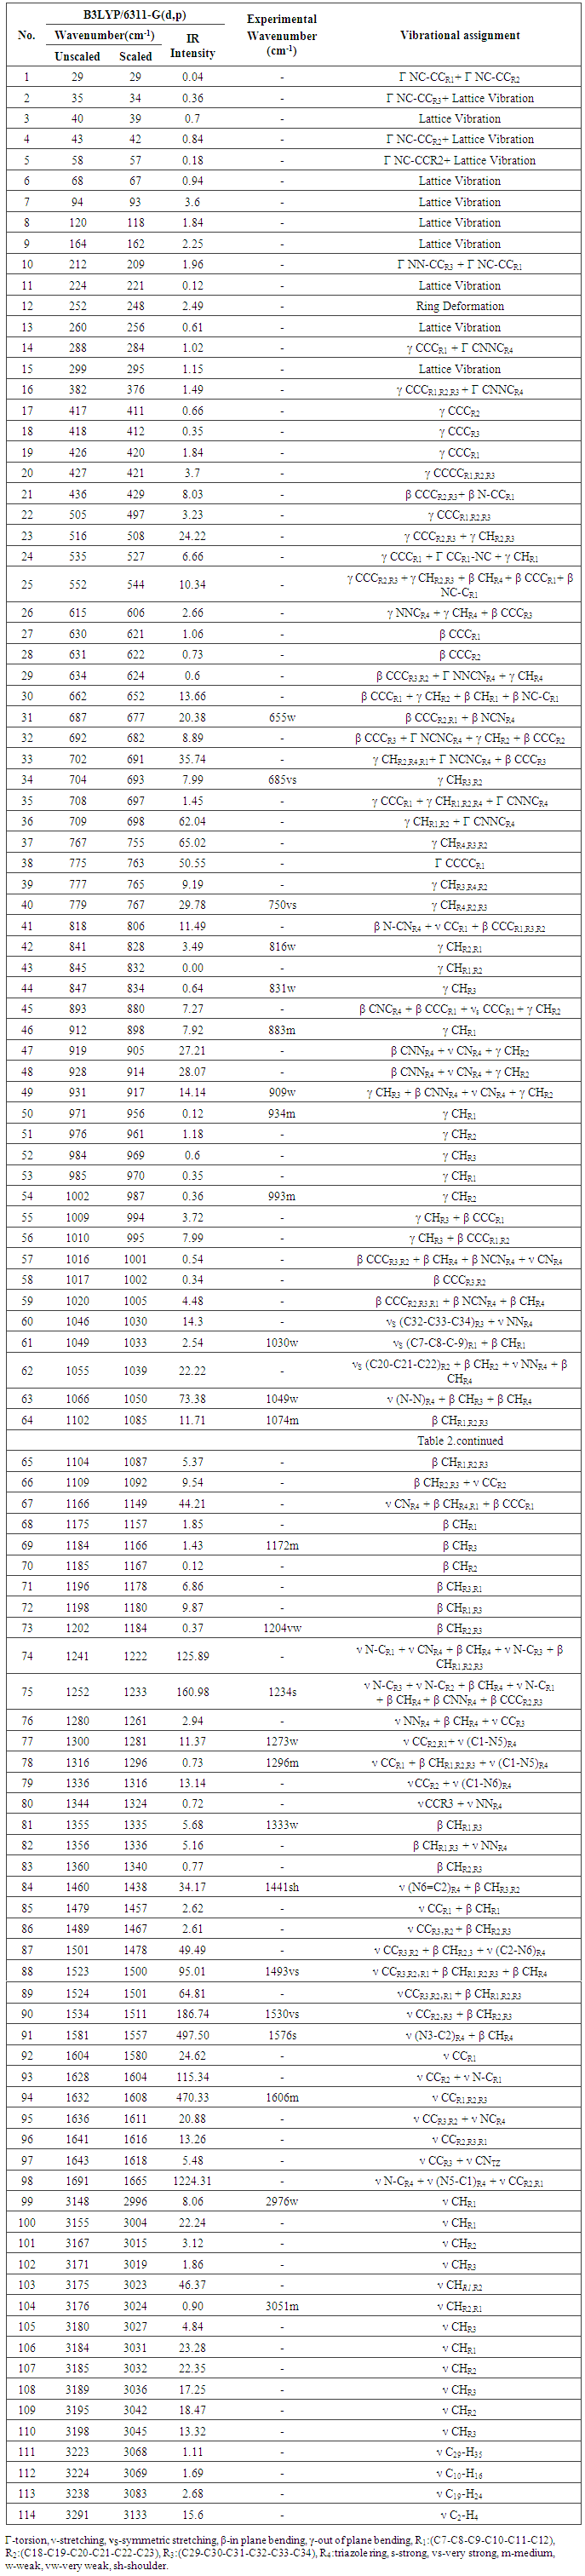
- 1,4-diphenyl-3-(phenylammonio)-1H-1,2,4-triazolium molecule have 40 atoms and the number of vibrational modes is 114. All fundamental modes of the title compound under C1 symmetry are active in IR spectrum.For visual comparison, the simulated and observed FTIR spectra of the title compound at DFT/B3LYP level using 6-311G(d,p) basis set are given in Figure 3. The observed vibrational frequencies of fundamental modes of Nitron along with the simulated IR frequencies, the calculated IR intensities and assignments of vibrational frequencies are reported in Table 2. Due to neglect of unharmonicity in real system, the vibrational frequencies simulated for Nitron with the unscaled B3LYP/6-311G(d,p) force field are slightly greater than the observed values. These differences can be rectified by scaling the simulated wavenumbers with appropriate factor. It is necessary to scale down the calculated harmonic frequencies to improve the calculated values in agreement with experimental values. The different scale factors can be used for different regions of vibrations to obtain a better agreement between the experimental and computed frequencies. The vibrational frequencies calculated at B3LYP/6-311G(d,p) level were scaled by 0.985 for wave numbers less than 1700 cm-1 and 0.952 for higher wave numbers.
|
4.2.1. C-H Vibrations
- The aromatic compounds shows the appearance of C-H stretching vibrations in the spectral range 3000-3100 cm-1 [28]. The observed bands at 2976 and 3051 cm-1 attributed to C-H stretching vibrations of the title compound. DFT computations predict these modes from 2996 to 3045 cm-1 for B3LYP/6-311G(d,p) level of theory. The other CH stretching modes (C29–H35, C10-H16, C19-H14, C2-H4) are computed from 3068 to 3133 cm-1. The C-H in-plane bending bands of aromatic compounds are observed in the spectral range 1300-1000 cm-1 [29]. The observed bands at 1074, 1172, 1204, 1333 cm-1 of title compound can attributed to the C-H in-plane bending vibrations combined with other vibration bands. The respective calculated bands are 1085, 1166, 1184, 1335 cm-1 at B3LYP/6-311G(d.p) level for C-H in-plane bending vibrations. The absorption bands arising from C-H out-of-plane bending vibrations are usually observed in the spectral range 1000-750 cm-1 [30]. The computed vibrations at 693, 767, 828, 834, 898, 917, 956, 987 cm-1 are assigned C-H out-of-plane bending vibrations using B3LYP/6-311G(d,p) which are comparable to experimental data at 685, 750, 816, 831, 883, 909, 934, 993 cm-1. The results showed that the theoretical data nearly coincide with experimental ones and these assignments are in good agreement with literature data [29, 30].
4.2.2. C-C Vibrations
- The C=C stretching modes in Benzene rings are in general appear in the spectral range 1650-1400 cm-1 [31]. For the title compound the observed C=C stretching vibrations are found at 1493, 1530, 1606 cm-1 and the respective calculated bands are assigned at 1500, 1511, 1608 cm-1. The CCC in-plane bending modes of aromatic rings is observed band at 655 cm-1 which is comparable to theoretical data at 677 cm-1 and CCC out-of-plane bending mode is not observed in the spectrum of the title compound. These assignments are in good agreement with B3LYP/6-311G(d,p) method and as well as with the literature data[32].
4.2.3. C-N,C=N, N-N Vibrations
- The recognition of C-N, C=N, and N-N vibrations is a very difficult task, since the mixing of several bands are possible in this region. The observed bands in IR at 1234 cm-1 belong to C(aromatic ring) - N stretching vibration, while the calculated value of this band was appeared at 1233 cm-1 for the title compound. The observed band at 1576 cm-1 can be assigned to the C-N stretching vibration of 1,2,4 triazole ring and the calculated value of the mention mode was found at 1557 cm-1. The C=N stretching mode of triazole ring is observed band at 1441 cm-1, while the calculated value was appeared at 1438 cm-1.
 | Figure 3. Theoretical (a) and experimental (b) FT-IR spectra of Nitron |
4.3. HOMO-LUMO Analysis
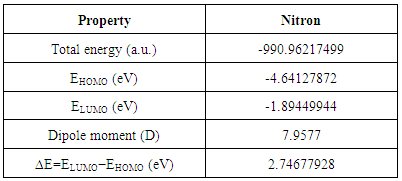
- Study of molecular orbitals can provide much useful information about electronic structures and is widely used in the analysis of chemical reactions [36]. The frontier molecular orbital energies were obtained using the B3LYP/6-311G(d,p) level for the optimized molecular structure. A total of 528 molecular orbitals were founded, 82 of which are occupied. The 3D plots of the frontier orbitals; the highest occupied molecular orbital (HOMO) and the lowest unoccupied molecular orbital (LUMO) are shown in Figure 4 that show it is likely to exhibit an efficient electron transfer from 3-(phenylammonio) group of the HOMO to the 1,4-(diphenyl) group of the LUMO if electronic transitions occur. The HOMO for the computed is localized at the 3-(phenylammonio) and triazole ring regions, whereas the LUMO is localized at 1,4-(diphenyl) and 1,2,4 triazole regions. LUMO as an electron acceptor represents the ability to accept an electron and HOMO represents the ability to donate an electron. Therefore, when electron transfer from the HOMO to LUMO, the electron density significantly decreases in the electron-donating 3-(phenylammonio) moiety, accompanied by an increase in the electron density of the electron-accepting 1,4-(diphenyl) moiety. This result indicates that the electron transfer from the 3-(phenylammonio) group to the 1,4-(diphenyl) group through the triazole group. The intramolecular charge transfer (ICT) from HOMO-LUMO occurs through π-conjugated path. The energy gap, the difference between HOMO and LUMO, is an indication of capability of electronic transitions from occupied orbitals to unoccupied ones. The energy gap is a parameter to determine the molecular electrical transport property because it is a measure of electron conductivity. The total energy, HOMO, LUMO energies, and energy gap of Nitron computed at the DFT/B3LYP method with 6-311G(d,p) level in gas phase is shown in Table 3 and it reveals the energy gap reflect the chemical activity of the molecule. In addition, The energy value of HOMO is computed as -4.64127872 eV and LUMO as -1.89449944 eV, and the energy gap value is 2.74677928 eV and the dipole moment is 7.9577 Debye in gas phase for the title compound. Lower value in the HOMO and LUMO energy gap explains the eventual charge transfer interactions taking place within the molecule.
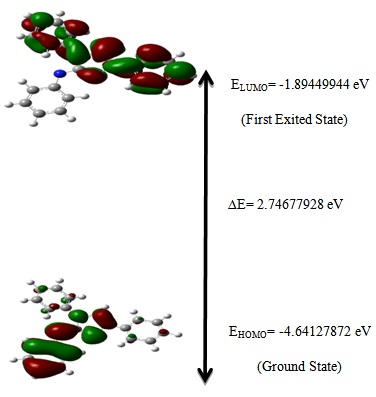 | Figure 4. The atomic orbital components of the frontier molecular orbital of Nitron |
|
4.4. UV/Vis Spectrum
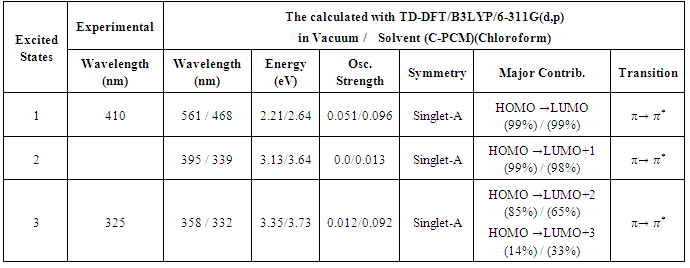
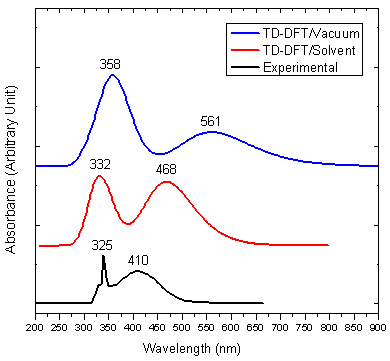
- Quantum chemical computations were carried out to further investigate the electronic properties of title compound. The TD-DFT/B3LYP method using 6-311G(d,p) basis set, has been used to determine the first three low-lying excited states for investigate the UV-Vis absorption spectra of the title compound. The calculated results involving the vertical excitations energies, oscillator strength (f), major contributions, and wavelength are carried out and compared with measured experimental wavelength. The experimental and theoretical UV-Vis absorption spectra of the title compound are shown in Figure 5. As can be seen from the figure, electronic absorption spectrum of the title compound shows two bands at 325 and 410 nm. From TD-DFT(C-PCM)/B3LYP calculation, the theoretical absorption bands are predicted at 358 and 561 nm for gas phase ,332, 468 nm for chloroform solution at 6-311G(d,p) basis set and as well as can easily be seen that solvent case data is the closest with compared to the experimental absorption bands. The error between the calculated and experimental results ranges from 33 nm to 151 nm for gas phase, and 7 nm to 58 nm for solvent case. These values indicate that the solvent case is more suitable than the gas phase for studying the absorption spectra of the title compound. The calculated TD-DFT(C-PCM)/B3LYP/ 6-311(d,p) has been determined using optimized gas phase geometries.The maximum absorption peak (λmax) optimized by TD-DFT(C-PCM)/6-311G(d,p) reduces the error to 6 nm for title compound. These results indicate the accuracy remarkably increases when solvent effects are taken into account because of the intermolecular hydrogen bonding interaction in the corresponding electronic exited state. When the electronic transition energy from the ground state to the excited state increases, which leads to a blue-shift in the electronic spectrum because of weakening of the excited hydrogen bond [37].The main orbital compositions of the computed lower-lying singlet excited states and the transition features of the title compound obtained at TD-DFT/6-311G(d,p) level in gas phase and at TD-DFT(C-PCM)/6-311G(d,p) level in solvent (Chloroform) are listed in Table 4. In view of calculated absorption spectra, the maximum absorption wavelength corresponds to the electronic transition from HOMO to LUMO with 99% contribution. This transition (HOMO→LUMO) is predicted as
 transition.
|
 | Figure 5. Experimental and theoretical electronic spectra for the title compound |
5. Conclusions
- The optimized geometry, harmonic vibrational wavenumbers and intensities, the electronic absorption maximum wavelengths, and HOMO-LUMO energy gap of 1,4-diphenyl-3-(phenylammonio)-1H-1,2,4-triazolium(inner salt) have been calculated at DFT/B3LYP method with 6-311G(d,p) level of theory for the first time. The fundamental modes of the title compound have been studied by FT-IR spectroscopy. The scaled wavenumbers are in a good agreement with observed vibrational wavenumbers. The maximum absorption wavelength in the UV-Vis spectrum has been observed at 468 nm. The TD-DFT calculations also show a good agreement with the observed values in solvent case. Furthermore, the calculated HOMO-LUMO energy gap show that charge transfer interactions takes place within the molecule. The calculated results have showed that the title compound possesses HOMO-LUMO energy gap at 2.74 eV which indicate high recommendations for photovoltaic fabrication.