-
Paper Information
- Previous Paper
- Paper Submission
-
Journal Information
- About This Journal
- Editorial Board
- Current Issue
- Archive
- Author Guidelines
- Contact Us
Physical Chemistry
p-ISSN: 2167-7042 e-ISSN: 2167-7069
2013; 3(1): 11-20
doi:10.5923/j.pc.20130301.03
Validation of Cefazolin Sodium by UV-Spectrophotometric Method
 Abstract
 Reference
 Full-Text PDF
 Full-text HTML
Pedroso T. M., Salgado H. R. N.
Department of Drugs and Pharmaceuticals, School of Pharmaceutical Sciences of Araraquara- UNESP, Rodovia Araraquara-Jaú, km 1, CEP 14801-902, Araraquara, SP, Brazil
Correspondence to: Salgado H. R. N., Department of Drugs and Pharmaceuticals, School of Pharmaceutical Sciences of Araraquara- UNESP, Rodovia Araraquara-Jaú, km 1, CEP 14801-902, Araraquara, SP, Brazil.
| Email: |  |
Copyright © 2012 Scientific & Academic Publishing. All Rights Reserved.
A simple, fast and reproducible UV Spectrophotometric method was developed and validated for quantification of cefazolin sodium in pharmaceutical form powder for injectable solution, the method proved effective, easy applicability, low cost, besides it does not generate toxic wastes to the operator and the environment, corroborating with the routine analysis of quality control to ensure the therapeutic efficacy of the drug already marketed. The method presented being capable to detect and quantify the drug obtaining satisfactory results regarding specificity, precision, accuracy and robustness, linear range of 8 to 28 µg/mL, showing correlation coefficient of 0.9999 when analyzed in the wavelenght λ=270 nm spectrophotometer.
Keywords: Cefazolin Sodium, Cephalosporin, Analytical Method, Quantitative Analysis, Quality Control
Cite this paper: Pedroso T. M., Salgado H. R. N., Validation of Cefazolin Sodium by UV-Spectrophotometric Method, Physical Chemistry, Vol. 3 No. 1, 2013, pp. 11-20. doi: 10.5923/j.pc.20130301.03.
Article Outline
1. Introduction
- Cephalosporins are antibacterial antibiotics belonging to the group β-lactam antibiotics often used as a therapeutic agent, for being broad spectrum, and low toxicity[1]. Since their discovery in 1948 by Brotzu[2] cephalosporins are widely used because they have significant activity against Gram-positive and Gram-negative bacteria by inhibiting synthesis of bacterial cell wall in a manner to similar penicillin[3-4]. Moreover they can be used in treating allergic patients to penicillin[3, 5].Cefazolin sodium (CFZ) is classified as a first-generation cephalosporin for injectable use; its use in clinical practice is distinguished by its effectiveness as a therapeutic agent and surgical prophylaxis. The antibacterial spectrum of cefazolin is typical of another first-generation cephalosporins, but stands out for showing activity against some Enterobacter species and have a longer half-life and can be administered at less frequent intervals, making it be preferred among the first-generation cephalosporins[4]. Cefazolin sodium is officially recognized in the British Pharmacopoeia, 2010; European Pharmacopoeia, 2005; Pharmacopoeia, 2005, Japanese Pharmacopoeia, 2006 and in The United States Pharmacopeia, 2010[6-10], in which methods by liquid chromatography with UV detection are employed.Studies focused on the development and refinement of analytical methodologies is crucial for optimization of laboratory tests carried out in the pharmaceutical industry, for quality assurance. Some analytical methods are described in the literature for analysis of cefazolin sodium in raw material and finished product. Among these are found bromometry methods[11]; Colorimetry,[12]; highperformance liquid chromatography[13-20]; capillary electrophoresis[21-22]; ultraviolet (UV) and visible (VIS) spectrophotometry[23-27]; fluorimetry[28]; refractive index[29]; polarography[30]; chemiluminescence[31]; radiosensibility[32] and voltammetry[33]. However, many of these methods require pre-treatment of the sample, formation of metal complexes, drug degradation using sulfuric acid, among other time-consuming complex procedures, which require sophisticated equipment, high costs or use of large amounts of organic solvents, which are toxic for the operators and the environment. Furthermore, most of the methods described quantifies the drug in biological fluids.On the other hand, the quality control in the pharmaceutical industry requires reliable analytical methods capable of ensuring therapeutic efficacy of the marketed drug, but that is simple, fast, versatile, that does not require complex or costly procedures, does not generate toxic wastes, so that, in this way it can be employed in laboratory tests. The method by ultraviolet absorption spectrophotometry has been employed as a proof of identification, by comparison of the spectral profile; this feature is important for characterization purposes of the substance from obtaining the wavelengths of greatest absorbance[34]. The use of this method for quantification of drugs also has distinguished itself by offering favourable characteristics for applications in quality control. The inclusion of this instrumental technique is highly recommended for official textbooks, because the methods developed by UV spectroscopy have shown results also accurate, reproducible and accurate [35-41]. In this sense, the objective of this study was to develop and validate a simple, fast, reproducible and viable method by spectrophotometry in UV region, for quantification of cefazolin sodium in pharmaceutical form powder for injectable solution, to be applied in routine analysis in pharmaceutical industries, ensuring therapeutic efficacy of the drug already marketed globally.
2. Methodology
- It were used commercial samples of cefazolin sodium (generic) pharmaceutical form powder for injection solutions in ampoules containing 1 g vial (batch: 203674C v. 02/2013) and reference substance (batch: F366391 v. 11/2013) with a purity of 98.2% declared, kindly provided by ABL antibiotics of Brazil Ltda. (Cosmópolis-SP).Spectrophotometric readings were held in UV-Vis spectrophotometer Shimadzu UV-mini 1240 model, using quartz cuvettes 1 cm optical path, under controlled temperature 25° C. An equivalent of 20.0 mg of cefazolin sodium reference standard (RS) substance, previously dried for 1 hour at 105 oC, was weighed and transferred to a 100 mL volumetric flask, and the volume was completed with purified water, in order to obtain a stock solution of 200 µg mL-1.For qualitative analysis of 1 mL aliquots of stock solution were transferred into 10 mL volumetric flask and the volume was completed with different solvents to obtain solutions of 20 μg/mL in purified water (Millipore ®); hydrochloric acid 0.1 M PA (Synth); sodium hydroxide 0.1 M PA (Merck); methanol PA (Synth); 1% phosphate buffer pH 6 and 1% phosphate buffer pH 8. All solvents used were of analytical grade, the absorption spectra were recorded in the wavelength range between 200 and 400 nm, the same was carried out for cefazolin sodium lyophilized powder and the spectra were compared.For the development of the UV spectrophotometer method, the Ringbom curve was constructed to determine the range in which the drug has a increased linearity. Aliquots of stock solutions corresponding to 0.4; 0.6; 0.8; 1.0; 1.2 and 1.4 mL were transferred to 10 mL volumetric flasks, and the volume was completed with purified water to obtain solutions in concentrations of 8, 12, 16, 20, 24 and 28 µg/mL, respectively. Purified water was used as blank to reset the appliance; the dilutions were individually analyzed in UV spectrophotometer at a wavelength more than 270 nm.
3. Method Validation
- The method was validated according to the parameters established in guidelines as Brazil, 2003; FDA, 2004; ICH, 2005; INMETRO, 2011[42-45].
3.1. Linearity
- The linearity of the method was obtained through the analysis of three analytical curves on three different days. The results obtained were analyzed to obtain the equation of the straight by the least squares method and verification of the linearity was detected by statistical tool of analysis of variance (ANOVA).
3.2. Precision
- The precision of the method was performed for repeatability and intermediate accuracy tests, which were evaluated by calculating the RSD sample content and statistical tools such as Student's t-test and ANOVA.
3.3. Calculation of Cefazolin Sodium Lyophilized Powder
- The solutions were prepared in triplicate and sample readings were held in spectrophotometer at a wavelength of 270 nm. The calculation of the concentration of cefazolin sodium lyophilized powder was accomplished through the equations (1-2).
 | (1) |
 | (2) |
3.4. Repeatability
- The repeatability was determined by analysis of seven solutions of SQR cefazolin sodium in a concentration of 20 µg/mL prepared in the same day. Thus, results were obtained using the same experimental conditions and evaluated by the relative standard deviation.
3.5. Intermediate Precision
- The intermediate precision was evaluated through analysis of solutions of cefazolin sodium RS and cefazolin sodium lyophilized powder at a concentration of 20 µg/mL, and executed by different analysts in different days. The analyses were performed in seven replicates.
3.5.1. Interday
- Seven solutions of cefazolin sodium RS and cefazolin sodium lyophilized powder at a concentration of 20 µg/mL were prepared and analyzed daily for three consecutive days under the same experimental conditions and the results were evaluated by the relative standard deviation and variance analysis (ANOVA).
3.5.2. Between-Analysts
- The accuracy among analysts was checked by preparing seven solutions of cefazolin sodium and cefazolin sodium RS lyophilized powder at a concentration of 20 µg/mL by two analysts, under the same experimental conditions, the results were evaluated by the relative standard deviation of the levels and the Student’s t test.
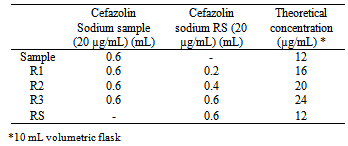
3.5.2.1. Accuracy
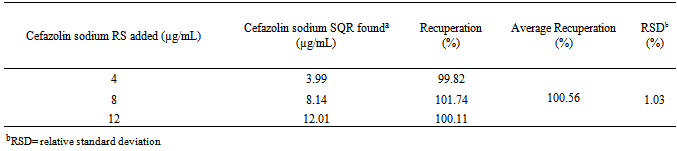
- The accuracy was determined by addition method in which a known quantity of standard is added to the sample, and is mathematically calculated according to the amount recovered. Samples were prepared in triplicate according to Table 1.
|
 | (3) |
3.5.2.2. Limit of Detection (LD)
- The detection limit was calculated using the formula described in the literature[44], based on the standard deviation of the intercept and the slope of the analytical curve. The calculation was performed according to equation 4.
 | (4) |
3.5.2.3. Limit of Quantification(LQ)
- The quantification limit was calculated using the formula described in the literature[44], based on the standard deviation of the intercept and the slope of the analytical curve. The calculation was performed according to equation 5.
 | (5) |
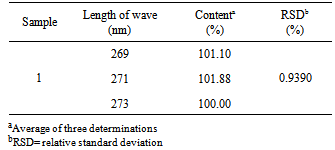
3.5.2.4. Robustness
- The robustness of the method was determined by comparing the contents obtained by varying the wavelength of absorption and evaluated by the relative standard deviation and by the Student's t test.
4. Results
4.1. Qualitative Analysis
- The molecular absorption in the ultraviolet region of the spectrum depends on the electronic structure of the molecule; thereby the identification of the drug can be carried out by determining its absorption characteristics in different solvents[46]. The spectra of cefazolin sodium SQR and lyophilized powder at a concentration of 20.0 µg/mL in many solvents were analyzed, among these solvents, water solvent came up with results similar to phosphate buffer solutions 1% pH 6 phosphate buffer and 1% pH 8, with a maximum absorption wavelength at 271 nm and absorbance around 0.5585 (Figure 1) while using methanol the maximum absorption observed was 0.6521 at 273 nm in an acid medium it was of 267 nm with absorbance of 0.4417 and basic medium it was 285 nm and absorbance of 0.5221.After analyzing the spectra, purified water was chosen to use as a solvent, by presenting appropriate features in the spectra and economic and environmental advantages, such as being easy acquisition and disposal and low cost.
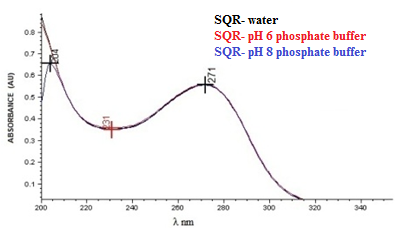 | Figure 1. Absorption spectrum in the ultraviolet region, solution of cefazolin sodium RS in a concentration of 20 µg/mL, using as solvent: water, pH 6 phosphate buffer and pH 8 phosphate buffer |
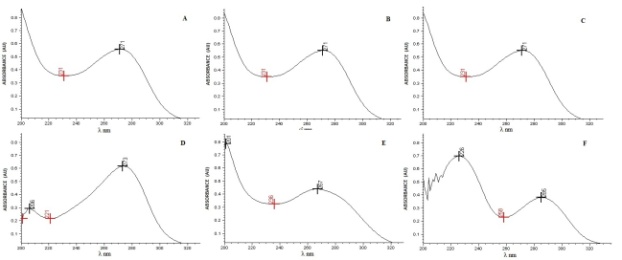 | Figure 2. Absorption spectrum in the ultraviolet region, solution of cefazolin sodium RS in a concentration of 20 µg /mL, using as solvent: purified water (A); phosphate buffer pH 6 (B); phosphate buffer pH 8 (C) methanol (D) hydrochloric acid 0. 1 M (E); 0.1 M sodium hydroxide (F) |
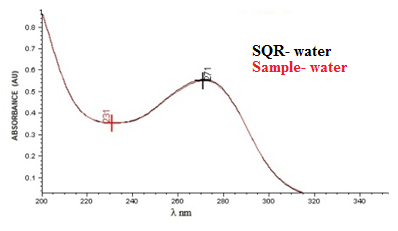 | Figure 3. Absorption spectrum in the ultraviolet region of cefazolin sodium RS compared to cefazolin sodium lyophilised powder, both at a concentration of 20 µg/mL using purified water as solvent |
4.2. Quantitative Analysis
- Quantitative spectrophotometric analysis in the ultraviolet region has as its principle the direct relationship between the amount of light absorbed and the concentration of the substance, also known Lambert-Beer law, which is the mathematical basis for measuring radiation absorption at a given wavelength when undergoing a sample since there is an exponential relationship between the light transmission and thickness of absorbent means. The absorbance given by electromagnetic spectra is obtained using equation 6[34,47].
 | (6) |
4.3. Ringbom's Curve
- For the development of the UV spectrophotometric method, a Ringbom curve was constructed in order to establish the concentrations of work to which the drug has linearity. Aliquots of the stock solution of 200/mL in SQR were transferred with the aid of a micropipette to 10 mL volumetric flasks, and the volume was completed with purified water, to obtain increasing concentrations 2-176 µg/mL, then analyzed individually. The readings were carried out at a wavelength of 270 nm, the absorbance of each concentration was converted to transmittance and the graphic of transmittance versus concentration is shown in Figure 4.
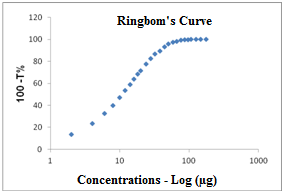 | Figure 4. Ringbom's curve obtained by the spectrophotometric method in the UV region to cefazolin sodium RS using water as solvent at a wavelength of 270 nm |
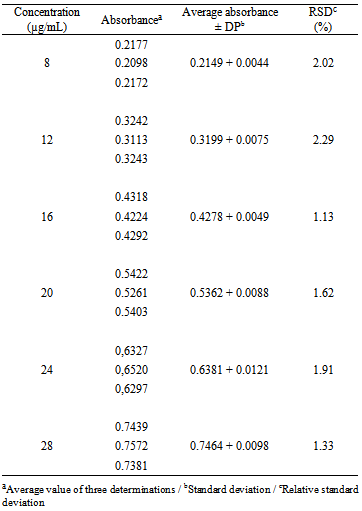
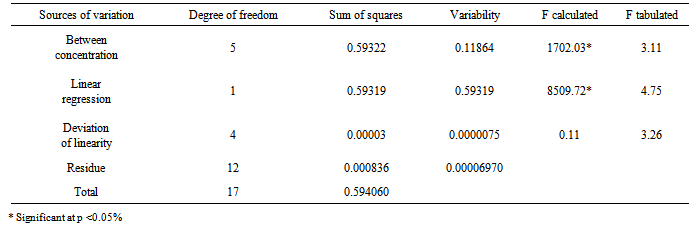
4.4. Calibration Curve
- The content of cefazolin sodium powder of 20 vials for the injectable solution was weighed and mixed; amount equivalent to 20 mg of RS was weighed and transferred to a 100 mL volumetric flask, which was dissolved and diluted with purified water to obtain stock solution at a concentration of 200/mL. From this solution, volumetric dilutions were prepared by transferring aliquots of 0.4, 0.6, 0.8, 1.0, 1.2 and 1.4 mL to 10 mL volumetric flasks and the volume was completed with purified water, for obtaining solutions with concentrations of 8, 12, 16, 20, 24 and 28 µg/mL, respectively, in which Beer's statement is obeyed. Each concentration was prepared in triplicate. The spectrophotometric readings were measured at a wavelength of 270 nm by using purified water as blank. The calibration curve was constructed with the average absorbance of three determinations versus the concentrations of cefazolin sodium RS. The equation of the straight line was obtained by linear regression (Table 2).The calibration curve of cefazolin sodium RS (Figure 5) was built with the average absorbance values of three analytical curves obtained during the tests of linearity.The calibration curve of cefazolin sodium was calculated by analysis of variance (ANOVA) and the results obtained are shown in Table 3.
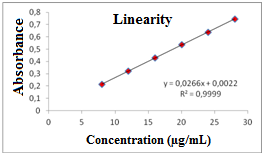 | Figure 5. Calibration curve of cefazolin sodium RS obtained by the spectrophotometric method in the UV region, using water as solvent at 270nm |
|
|
4.5. Precision
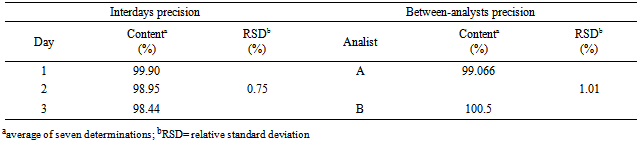
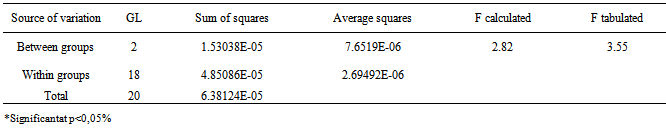
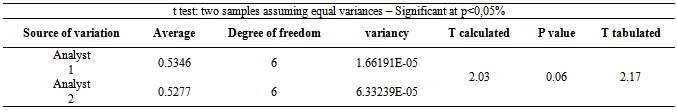
- The precision of the method was determined by repeatability (intraday), expressing the results on the basis of relative standard deviation. Seven cefazolin sodium RS solutions prepared at a concentration of 20 µg/mL were submitted to successive and the data obtained on the same day under the same experimental conditions, and laboratory analyst provided RSD of 0.32%. Intermediate precision was evaluated through interday precision and the between-analysts. The values of content of cefazolin sodium in lyophilized powder, determined during the assessment of the accuracy of the proposed method are shown in Table 4. The interday precision and between-RSD analysts showed 0.81 and 1.01%, respectively.The interday precision was evaluated by analysis of variance while the between-analyst precision was evaluated by Student's t test, as shown in Tables 5 and 6.
|
|
|
|
4.6. Limit of detection (LD) and Limit of Quantification (LQ)
- The sensitivity of the spectrophotometric method was determined by the limits of detection (LD) and quantification (LQ). The calculated values for LD and LQ were 0.2229 µg/mL and 0.6754 µg/mL, respectively.
4.7. Robustness
|
5. Discussion
- The method was developed and validated using water as solvent, based on the good absorption intensity of the functional chromophore groups present on the drug with this solvent, and presents advantages such as simplicity in sample preparation, low cost and easy disposal.By analyzing the Ringbom's curve, it was determined the best concentration range was selected for the method. The results obtained in the evaluation of linearity demonstrated that the solutions of cefazolin sodium SQR showed a linear correlation between absorbances and concentrations in the range used. Plotted graphs of absorbance versus concentration were used, which demonstrated a linearity in the range 8-28 µg/mL. The equation of the line for the method was: y= 0.0266 x 0.0022, with a correlation coefficient of 0.9999.The limits of detection and quantification were calculated based on the calibration curves generated on different days. The values found for detection and quantitation limits were 0.22 µg/mL and 0.67 µg/mL, respectively, which demonstrates that the range used is above the limits and, thus, with appropriate values of concentration.The precision of the method was demonstrated by repeatability (intraday precision) and intermediate precision (interday and between-analysts). The experimental value obtained from intraday analysis showed RSD of 0.32% for analysis of seven replicates of cefazolin sodium SQR performed on the same day under the same conditions. In interday precision, the analyses were performed on different days yielding an average content of 99.103%, and RSD of 0.75%. Statistical tools (ANOVA) were used to confirm that the significance level of 5%, variances in absorbance between analyzed days, did not differ statistically, giving an F 2.83 calculated that therefore is less than the tabulated F observed 3.55. The accuracy between analysts showed an RSD of 1.01% and was evaluated by t test which confirmed the effectiveness of the method, because the value found for t calculated 2.03 was less than the tabulated t value (2.17), showing that the significance level of 5% averages are not statistically different, therefore the results obtained demonstrate that the method is validated accurate.The accuracy was evaluated by the addition method and calculated mathematically by recovery. The results obtained are in the range of 99.82 to 101.74%, which is consistent with the recommended range for the accuracy of analytical methods (98-102%)[42].The parameter chosen to evaluate the robustness of the method was the wavelength. The results obtained by varying the wavelength of two units above and below two units showed no significant difference in the quantification of the sample. The test was evaluated using the ANOVA statistical tool featuring F calculated to be 0.14 which is less than F Tabulated of 3.55.The proposed spectrophotometric method met all requirements required by the official codes agency guidelines[10, 34, 44), making it adequate, presenting simplicity, specificity, linearity, precision, accuracy and robustness, and can be used for assay of cefazolin sodium in lyophilized powder.
6. Conclusions
- In this paper, an analytical method by UV spectrophotometry was developed and validated for the quantification of cefazolin sodium in pharmaceutical preparations, which shows advantages such as simplicity, speed, versatility, easy to apply, inexpensive and does not use toxic reagents and pollutants, satisfactory validation parameters, with highly reproducible results indicating linearity, selectivity, precision, proving to be suitable for routine analysis in pharmaceutical industries.
ACKNOWLEDGEMENTS
- FAPESP, CNPq, PADC, ABL Antibióticos do Brazil Ltda.