-
Paper Information
- Next Paper
- Paper Submission
-
Journal Information
- About This Journal
- Editorial Board
- Current Issue
- Archive
- Author Guidelines
- Contact Us
Physical Chemistry
p-ISSN: 2167-7042 e-ISSN: 2167-7069
2013; 3(1): 1-6
doi:10.5923/j.pc.20130301.01
Development and Validation of Infrared Spectroscopy Method for the Determination of Darunavir in Tablets#
 Abstract
 Reference
 Full-Text PDF
 Full-text HTML
Ana Carolina Kogawa, Hérida Regina Nunes Salgado
Department of Drugs and Medicines, School of Pharmaceutical Sciences of UNESP, Univ Estadual Paulista, Araraquara, 14801-902, Brazil
Correspondence to: Hérida Regina Nunes Salgado, Department of Drugs and Medicines, School of Pharmaceutical Sciences of UNESP, Univ Estadual Paulista, Araraquara, 14801-902, Brazil.
| Email: |  |
Copyright © 2012 Scientific & Academic Publishing. All Rights Reserved.
Darunavir is a protease inhibitor used in the treatment of HIV infection. It is a pillar of therapy cocktail for patients with this virus. This work proposed the development and validation of an infrared spectroscopy method for the determination of darunavir in tablets. The method was completely validated according to the International Conference on Harmonization guidelines, showing accuracy, precision, selectivity, robustness and linearity. It was linear over the concentration range of 1.5-3.5 mg with correlation coefficients greater than 0.9991 and limits of detection and quantification of 0.12 and 0.36 mg, respectively. The validated method is very useful to the routine quality control of darunavir, since it does not use polluting reagents, it is simple and has low-cost.
Keywords: Darunavir, Infrared, Method Validation
Cite this paper: Ana Carolina Kogawa, Hérida Regina Nunes Salgado, Development and Validation of Infrared Spectroscopy Method for the Determination of Darunavir in Tablets#, Physical Chemistry, Vol. 3 No. 1, 2013, pp. 1-6. doi: 10.5923/j.pc.20130301.01.
Article Outline
1. Introduction
- Darunavir is a protease inhibitor used in the treatment of HIV infection. It is a pillar of therapy cocktail for patients with the virus. It is a synthetic non-peptide analogue of amprenavir which became commercially available in 2006.Darunavir has the molecular formula C27H37N3O7S, molecular weight of 547.73 g mol-1[1], its melting point is 74°C with decomposition[2].There are three known forms of darunavir: ethanolate, hydrate and amorphous. Darunavir commercialized is called Prezista®[3] and it is in the form ethanolate (molecular weight of 593.73 g mol-1) because it is the most stable form, but the environmental conditions can trigger its conversion into other forms[4]. On the market are found tablets darunavir ethanolate of 75, 300, 400 and 600 mg.
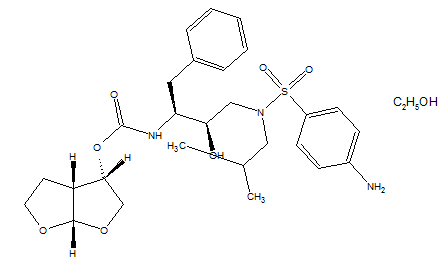 | Figure 1. Chemical structure of darunavir ethanolate (CAS 206361-99-1) |
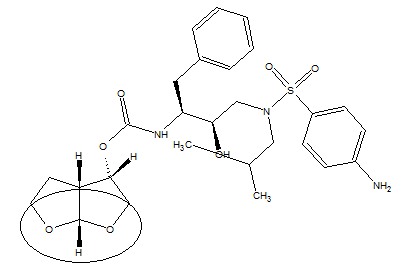 | Figure 2. Chemical structure of darunavir with emphasis on group 3 (R), 3a (S), 6th (R)- bis-tetrahydrofuranylurethane isostere |
2. Experimental
2.1. Equipments
- The equipments used were the following: IRPrestige-21 (Shimadzu®, Kyoto, Japão), the samples were dried in an oven (Nova Ética®, São Paulo, Brazil) and analytical balance model 410 Kern® (Kern, Germany).
2.2. Chemicals and Reagents
- The chemical used were: potassium bromide (Synth), analytical reagent; acetone (Synth), analytical grade; reference chemical substance (RCS) darunavir ethanolate, content of 98.0%, lot SRP07000d, the British firm Sequoia Research Products and the dosage form was 300 mg darunavir tablets, lot AEZOCOO, commercially known as PrezistaTM of Janssen-Cilag.We performed a previous dilution of 1:10 with potassium bromide and darunavir to facilitate and decrease/reset the possible errors in weighing.The diluent was potassium bromide dried 24 hours before use. Then, a stock standard mixture was prepared with potassium bromide and darunavir (RCS or tablets), at a concentration of 1:10. Pellets darunavir was prepared by dilute again an accurately weighed amount of the diluent in part of the mixture.The placebo mixtures were prepared in the laboratory by mixing appropriate amounts (commonly used in 300 mg darunavir tablets - PrezistaTM) of following pharmaceutical grade excipients: crospovidone, magnesium stearate, white OPADRY® II (partially hydrolyzed polyvinyl alcohol, titanium dioxide, talc and Macrogol®) PROSOLV® (microcrystalline cellulose and colloidal silicon dioxide), hydroxypropyl methylcellulose, polyethylene glycol, mannitol, starch and croscamelose.
2.3. Spectroscopy Measurements
- IR spectra of reference and sample mixture were recorded in pellets of 150 mg. The absorbance values obtained in the spectra were obtained at 1757-1671 cm-1for quantification of PrezistaTM tablets 300 mg. The spectroscopy measurements were recorded by using potassium bromide as a blank.
2.4. Preparation of Pellets
2.4.1. Stock and Working Standard Mixture
- Stock standard mixture containing darunavir at a concentration of 1:10 was prepared by accurately weighing 70 mg of darunavir reference substance and 630 mg of potassium bromide. Working standard mixture were prepared immediately before use by suitable dilutions of the corresponding stock mixtures to appropriate concentration levels by using potassium bromide as diluent.
2.4.2. Sample Mixture
- Twenty tablets of PrezistaTM 300 mg were used. The tablets were weighed and totally powdered. Appropriate dilutions were made with potassium bromide to obtain the working concentrations.
2.5. Method Validation
- Method validation was performed following ICH specifications[20] for linearity, selectivity, accuracy, precision, robustness, detection limit and quantitation limit.
2.5.1. Linearity
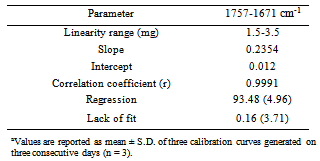
- Linearity was evaluated by regression analysis of darunavir standard mixture at fine concentration points in triplicate ranging from 1.5 to 3.5 mg prepared on three consecutive days (n = 3). The values are reported as the mean ± S.D. of the calibration curves. The data were analyzed at 1757-1671 cm-1. Correlation coefficient and. analysis of variance (ANOVA) were calculated and presented.
2.5.2. Selectivity
- Selectivity was evaluated by analysis of the spectra of the mixture of placebo and the darunavir working standard mixture at the concentration of 2.5 mg. The placebo mixture of PrezistaTM 300 mg containing the same composition as the pharmaceutical formulation was prepared for this study.
2.5.3. Accuracy
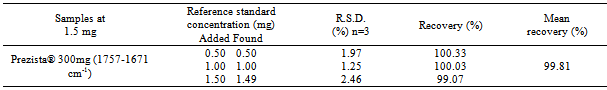
- The method accuracy was determined by measuring the reference standard recovery in triplicate at three levels from 80 to 120% of the method concentration (2.5 mg), according to ICH recommendations. A standard stock mixture containing darunavir at a concentration of 1:10 was prepared in potassium bromide. In pellets of 150 mg, amounts of 0.5, 1.0 and 1.5 mg of standard mixture were individually added with 1.5 mg of sample mixture and completed to 150 mg with potassium bromide. The final concentrations were 2.0, 2.5 and 3.0 mg, which correspond to 80, 100 and 120% of the target concentration, respectively. The mean recoveries, expressed in terms of percent recovery of the tablets (PrezistaTM tablets 300 mg) by the assay and the respective relative standard deviation (R.S.D.), were determined.
2.5.4. Precision
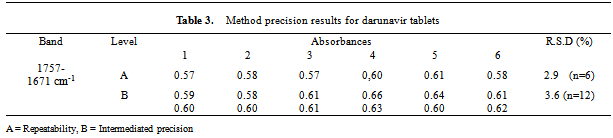
- Precision was evaluated with respect to both repeatability and intermediate precision. Repeatability was evaluated by analyzing darunavir work standard solutions at the same concentration and during the same day. Intermediate precision was studied by repetition of the assays on two different days by two analysts. Six replicates at a concentration of 2.5 mg were prepared and assayed. The data were analyzed at 1757-1671 cm-1. The percentages of relative standard deviation (R.S.D.) of the analytical responses were calculated.
2.5.5. Robustness
- The robustness of the method was evaluated by analyzing data after checking the time of compression, pressure and the mark of potassium bromide. Darunavir working standard mixtures at the concentration of 2.5 mg were used in these experiments.
2.5.6. Limits of Detection and Quantification
- The limit of detection (LOD) and the limit of quantification (LOQ) of the methods were obtained from the equations (1) and (2):
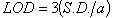 | (1) |
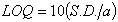 | (2) |
2.5.7. Assay of Pharmaceutical Products
- The validated IR spectroscopy method was applied for darunavir quantitation in tablets (PrezistaTM tablets 300 mg). The results were obtained by comparison of the sample spectroscopy measurements (n = 6) with those obtained from darunavir standard mixtures (n = 6) at the same concentration levels.
3. Results and Discussion
3.1. Method Development
- The reported methods for the determination of darunavir requires expensive equipment, use of buffer, methanol, ethanol and acetonitrile, in other words, is time consuming and demand the use of toxic solvent. In this paper, a single reagent was chosen in order to obtain a low cost, simple and environmentally friendly IR spectroscopy method for quantification of darunavir in tablets. In the spectra obtained was analyzed the carbonyl band between 1757-1671 cm-1. The values of these bands/peaks were provided in absorbance. There was no interference of the tablet excipients in the spectrum of the carbonyl region (1757-1671 cm-1), this band is specific and useful in the determination of darunavir in tablets.
3.2. Method Validation
- After identifying the carbonyl band (between 1757-1671 cm-1 for PrezistaTM tablets 300 mg), the analytical method was validated according to ICH recommendations[22].
3.2.1. Linearity
- The analytical curves, generated on three consecutive days (n = 3) by plotting the mean absorbance values of spectra at 1757-1671 cm-1 against concentration yielded correlation coefficients greater than 0.9991. Additionally, the data were validated by means of analysis of variance (Table 1), which showed significant linear regression (Fcalculated > Fcritical, P = 5%) and no significant lack of fit (Fcalculated < Fcritical, P = 5%).
|
3.2.2. Selectivity
- The spectra analyses show that formulation excipients of the pharmaceutical tablet product PrezistaTM 300 mg did not interfere significantly in the infrared spectroscopy method (Figure 3).
3.2.3. Accuracy
- The accuracy of the method was confirmed by determining the average recoveries from the samples by applying the standard addition method. As shown in Table 2, the mean percentage recoveries of product PrezistaTM 300 mg was in accordance with fixed limits of 98.0 up to 102.0%, indicating the suitability of the developed method in quantifying the concentration of darunavir in pharmaceutical tablets.
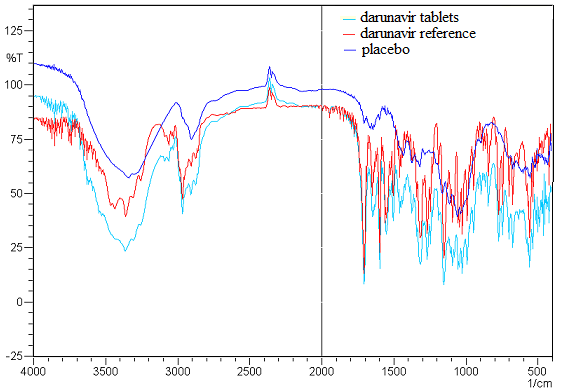 | Figure 3. Overlap of the infrared spectra referring the pellets of 150 mg at a concentration of 2.5 of placebo mixture, darunavir tablets and darunavir reference |
|
|
3.2.4. Precision
- Repeatability (intra-day precision) of the analytical method was found to be reliable based on %R.S.D. (< 2%). Intermediate precision (inter-day precision) was demonstrated on different days by two analysts. The %R.S.D. values were less than 2%, confirming that the method is sufficiently precise (Table 3).
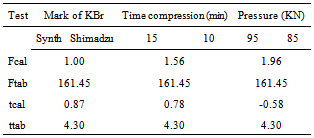
3.2.5. Robustness
- The results obtained in robustness test are shown in Table 4. Statistical analysis was performed to evaluate the influence of variation of the mark KBr, time compression and pressure. The robustness was confirmed by F test (Snedecor) homogeneity of variance and t (Student) to compare the mean, which showed Fcalculated < Fcritical, P = 5% and tcalculated < tcritical, P = 5%. Thus, the mean are equivalent.
|
3.2.6. Limits of Detection and Quantification
- LOD and LOQ values were found to be respectively 0.12 and 0.36 mg for PrezistaTM tablests 300 mg (1757-1671 cm-1). The values are close to zero which indicate the sensitivity of the method.
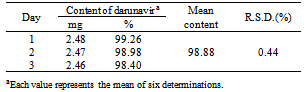
3.2.7. Assay of Pharmaceutical Products
- The validated method was applied for determination of darunavir in tablets. Samples from PrezistaTM tablets 300 mg were analyzed. The results, expressed as percentage drug related, are shown in Table 5.
|
4. Conclusions
- In this work, an analytical IR spectroscopy method was successful developed for quantitative determination of darunavir in tablets. Its advantages over other existing method are its simplicity, inexpensive conditions and it does not use polluting reagents.The results indicated that the IR spectroscopy method presents linearity, selectivity, accuracy, precision, robustness and adequate detection and quantification limits. Therefore, the validated method can be easily applied in routine analysis of darunavir.
ACKNOWLEDGEMENTS
- The authors acknowledge to CNPq (Brasília, Brazil) and FAPESP, CAPES, PADC/FCF/FUNDUNESP (São Paulo, Brazil).
Notes
- 1. Dedicated to Faculdade de Ciências Farmacêuticas da Universidade Estadual Paulista on the occasion of its 90th anniversary.